
Using a Quality Model to Evaluate User Interface Trustworthiness of
e-Commerce Systems: Scoring Strategies and Preliminary Results
Andr
´
eia Casare
1 a
, Tania Basso
1 b
, Celmar Guimar
˜
aes da Silva
1 c
and Regina Moraes
1,2 d
1
University of Campinas (UNICAMP), Limeira, Brazil
2
University of Coimbra (UC), Coimbra, Portugal
Keywords:
Trust, User Interface, Metric, Pilot Test.
Abstract:
Trust in computational systems involves technical aspects and also aspects of human interaction. While tech-
nical aspects have been largely studied, we noted that there are few studies about human interaction regarding
trust. In the e-commerce context, lack of consumer trust is a critical impediment to the success of e-commerce
activities since users avoid systems they do not trust. In this paper, we present the results of a pilot test on a
quality model to assess the trustworthiness of e-commerce systems based on user interface. The goal of the
interface-based quality model is to complement the trustworthiness measurement of the whole system (i.e.,
complementing technical aspects measurements, such as security, connectivity, scalability, isolation, among
others) and to help users to know if the e-commerce systems they are using are trustworthy. The pilot test was
a means of evaluating the material to be used in a wider user interface test. In this test, we collected ques-
tionnaire answers and automatic measures, which were normalized to be inserted into our quality model. We
also proposed a criteria to weight attribute scores in the model, according to the answers provided by users.
Based on these results, the evaluation procedure and assets should be refined to better attend the purposes of
the future assessment.
1 INTRODUCTION
It is a fact that individuals in societies interact with
each other expecting consolidated relationships based
on trust. This also happens in the digital environ-
ment, where the choice of whether to use a software
product or a computing environment depends on the
user’s trust in the manufacturer or the perception of
trust they have in the environment being used. How-
ever, different attributes are necessary to compose a
computational environment that brings a perception
of trust to the user (e.g. scalability, availability, QoS,
robustness, security, privacy assurance, dependability,
among others), since each layer of the environment to
be represented relies on a set of attributes.
Online shopping has been flourishing exponen-
tially during the last decade and is considered an ex-
cellent alternative for organizations to reach new cus-
tomers. Due to the ability of reaching and attracting
a
https://orcid.org/0000-0002-8009-4929
b
https://orcid.org/0000-0003-2467-2437
c
https://orcid.org/0000-0001-6112-892X
d
https://orcid.org/0000-0003-0678-4777
consumers online, e-commerce websites play a vital
role in online shopping, improving users satisfaction
and for this reason, attracting the attention of market-
ing practitioners, society, as well as academics. In
this context, the website interface plays a fundamen-
tal role in the proper functioning of the system as well
as in the perception and satisfaction of the user, which
leads him to trust the system being used. It has long
been said that elements of human computer interface
design have a significant influence on customer atti-
tudes and perceptions of the trustworthiness of a sup-
plier. Particularly, Roy, Dewit and Aubert (Roy et al.,
2001) studied the impact of interface usability on trust
in Web retailers and concluded that exists a strong re-
lationship between interface quality and trust, high-
lighting the importance of some components of user
interface quality and their implications.
In this direction, we argue that, although the per-
ception of trustworthiness is quite subjective, if we
identify measurable attributes that impact this per-
ception, we can approximate the relative perception
(benchmarking) by the composition of the measures
of these attributes. This conviction motivated the
proposal of a model (Casare et al., 2021) whose at-
Casare, A., Basso, T., Guimarães da Silva, C. and Moraes, R.
Using a Quality Model to Evaluate User Interface Trustworthiness of e-Commerce Systems: Scoring Strategies and Preliminary Results.
DOI: 10.5220/0010889700003124
In Proceedings of the 17th International Joint Conference on Computer Vision, Imaging and Computer Graphics Theory and Applications (VISIGRAPP 2022) - Volume 2: HUCAPP, pages
209-216
ISBN: 978-989-758-555-5; ISSN: 2184-4321
Copyright
c
2022 by SCITEPRESS – Science and Technology Publications, Lda. All rights reserved
209

tributes consider several aspects linked to the sys-
tem interface, including from technical (e.g., compu-
tational infrastructure, storage space, services compo-
sition) to sociological aspects (e.g., company reputa-
tion, among others).
Based on the quality model presented in Casare et
al. (Casare et al., 2021), we report a pilot test to assess
the trustworthiness of an e-commerce website based
on its interface. The evaluation was performed by 21
participants, whose answers help the authors to refine
the evaluation process for a future application with a
larger number of participants. The model being eval-
uated complements other similar models concerning
infrastructure, data managing and services to reach,
all together, the trustworthiness of the whole system.
Through the test with the users, it seeks to arouse
feelings, reflections and changes in the behaviour of
using the website (i.e., subjective feelings) that can
be measured through objective measures (i.e., perfor-
mance when loading the pages, control on the neces-
sary functionalities, among others). The goal of the
test with the users was to validate if the chosen at-
tributes set, collected in the literature, is able to trans-
late the perception of relative trust in using different
websites.
The remainder of the work is organized as fol-
lows: Section 2 presents some background and re-
lated work; the way proposed to measure a system
trustworthiness is presented in Section 3; experiments
performed as a preliminary validation are presented in
Section 4; finally, in Section 5 some conclusions and
the suggestions for future work are presented.
2 BACKGROUND AND RELATED
WORK
To the best of our knowledge, trustworthiness mea-
surement from the perspective of the user experience
(i.e., user perception based on interface) were not ex-
tensively studied up to now. Recently, Casare et al.
(Casare et al., 2021) identified a set of user interface-
based attributes that characterizes the perceived feel-
ing of trust by the users and formalized a set of re-
lated trustworthiness metrics, based on usability, ac-
cessibility and user experience. Olsina et al. (Olsina
et al., 2008) proposed an evaluation framework that
allows saving values for concrete real-world measure-
ment and evaluation projects. Their model is very
similar to what we are proposing, that is, it uses soft-
ware quality attributes, metrics, weights, aggregation,
operators and the Logic Score of Preferences (LSP)
technique. However, our model use attributes that im-
pact user trust, and also calculates a final score that
can be used to choose the most trustworthy website
(e.g., the one with best trustworthiness score).
Regarding usability measurement, Brooke
(Brooke, 1996) proposed a set of usability metrics
called SUS (System Usability Scale), which measures
the efficiency, effectiveness, satisfaction in use, and
ease of learning attributes. Seffah et al. (Seffah
et al., 2006) proposed the QUIM (Quality in Use
Integrated Measurement) model, which encompasses
10 usability attributes (with efficiency, effectiveness,
satisfaction in use and ease of learning among
them). Furthermore, standards proposed by ISO/IEC
formalized some usability and accessibility attributes
(e.g., ISO/IEC 25022 (ISO, 2016), which defines
metrics for the quality of interaction between a user
and a system).
Regarding accessibility measurement, Parmanto
and Zeng (Parmanto and Zeng, 2005) proposed the
WAB (Web Accessibility Barrier) metric. Based on
the Web Content Accessibility Guidelines (WCAG)
1.0 checkpoints, it measures quantitatively the acces-
sibility of web content. Song and Lai (Song and Lai,
2017) proposed a metric called Web Accessibility Ex-
perience Metric (WAEM) that matches the accessibil-
ity evaluation results with the user experience by pair-
wise comparisons between different websites. Also,
some tools can be used for the assessment of accessi-
bility, since they are based on WCAG guidelines (e.g.,
ASES
1
and Nibbler
2
).
3 MEASURING
TRUSTWORTHINESS
Due to the complex nature of the human in business
environment, assessing the interface trustworthiness
is extremely subjective. However, by carefully iden-
tifying and evaluating all relevant measurable func-
tional and non-functional characteristics that may in-
fluence trust on that service, its trustworthiness can be
transformed into an objective notion. Considering the
complex nature of trustworthiness, it is very unlikely
that it can be scored based on only one characteris-
tic in any scenario. More than that, it is very likely
that several characteristics (i.e., attributes) from het-
erogeneous scales may compose the trustworthiness
measurement and to score on a criteria it will be nec-
essary to aggregate the values through a given proce-
dure, which in turn is very likely to require the values
to be expressed in the same units to operate with them.
Quality Model (QM) is a reference model proposed in
1
http://asesweb.governoeletronico.gov.br/ases/
2
https://nibbler.silktide.com/
HUCAPP 2022 - 6th International Conference on Human Computer Interaction Theory and Applications
210

the ISO/IEC 25000 (SQuaRE) standard (IEC, 2005),
whose structure formalizes the interpretation of mea-
sures and the relationship among them. It allows the
representation of several attributes and the definition
of how the measures should be aggregated, as well as
what procedures have to be used to homogenize their
values. It is possible to define one quality model for
each attribute, and then, these different perspectives
can be aggregated following a hierarchical structure.
Furthermore, it allows the configuration of thresholds,
weights and operators. The next subsections present
two Quality Model representing e-commerce system
components, such as the component for Interface and
for the whole system.
3.1 Interface Trustworthiness Quality
Model
Like any part of a software product, measuring inter-
face quality is important because it helps to under-
stand deficiencies and guides improvements in this
field. The work of Casare et al. (Casare et al., 2021)
presented 25 interface metrics formalized, as follows:
4 sub attributes composing Learnability (Easy of
Learning, Navigation, Coherent Buttons and Coher-
ent Menus); 4 composing Efficiency (General Flex-
ibility, Environment Flexibility, Responsive, Perfor-
mance); 4 composing Perceivability (Simple Screens,
Colors and Fonts, Perception of System Status, Per-
formance); 4 composing Operability (Back Button,
Perceivable Focus, Broken Links, Affordable); 2
composing Safety in Use (Failure Handling, Rate of
Failures); 5 composing User Experience (Company
Information, Company Reputation, Privacy Policies,
Customer Opinion and Padlock). Furthermore, Sat-
isfaction and Usefulness are not composed of other
metrics. More details about these metrics can be
found in the work of Casare et al. (Casare et al.,
2021).
Based on this interface-based metrics formaliza-
tion, we designed an Interface Quality Model so that
an interface trustworthiness score can be calculated
based on the identified attributes. To preserve the
readability, Figure 1 shows only the main composite
attributes of the interface QM. It presents three levels
of this QM and partially presents the fourth and fifth
levels (in fact, we detailed only the Efficiency sub at-
tributes in the fourth level and Performance PageUp
in the fifth level). It is important to note that there is
a common sub attribute between Efficiency and Per-
ceivability (i.e., Performance), which means that this
measurement is used to calculate the score of both
composite attributes.
Due to the strong subjectivity of the interface at-
tributes, the scores for the majority of the attributes
are obtained through questionnaires, which are sup-
posed to be answered after a test with the users (e.g.,
the users interact with the website to perform some
usual functionalities and after answering the question-
naires). Only 4 attributes (Broken Links, Affordable,
Performance Page Up and Responsive) are less sub-
jective and can be measured through automatic tools.
Leaf attributes represent metric definitions with as-
sociated scores based on the measures collected by
the system monitoring process. They can be nor-
malized (using the limit values NormalMin and Nor-
malMax) ensuring that operators aggregate values at
same scales and they are compared against thresholds
(ThresholdMin and ThresholdMax) assuring that only
relevant and valid values are considered. The values
for each attribute i are influenced by an adjustable
weight (Wi), which specifies a preference over one or
more attributes of the system, according to predefined
requirements. For example, in the context of Figure
1, Usability (W
1
=35%) and Accessibility (W
2
=35%)
have the same importance to compose the Interface
Trustworthiness score, while User Experience has a
bit less importance (W
3
=30%) in this composition.
The final score is computed using the aggrega-
tion of the attribute values, starting from the leaf-
level attributes towards the root one, using the Opera-
tors (OPn), which describe the relation between them.
Different types of operators may be used to define
the conditions under which composite attributes are
aggregated, such as neutrality (combination of simul-
taneous satisfaction requirements with replaceability
capability); simultaneity (all requirements must be
satisfied); replaceability (used when one of the re-
quirements has a higher priority replacing the remain-
ing requirements). In Figure 1, Environment Flexibil-
ity is a Efficiency sub attribute, which, in turn, com-
poses Usability attribute. This is a subjective sub at-
tribute and it must be obtained by applying a ques-
tionnaire that must be answered by users. The ques-
tionnaire uses a 7-point Likert scale, with questions
that helps to evaluate if the e-commerce website un-
der test is flexible to be used in different browsers
and devices. The measurement score is obtained by
the weighted average of each question answered by
all users. With the answers of the questionnaires, the
weighted average is obtained considering the Likert
scale (1 to 7) and the total of responses for each of
these points (n1 – total responses as “Strongly Dis-
agree” to n7 – total responses as “Strongly Agree”),
after counting the answers of all participants. Then,
the standard deviation must be evaluated allowing bet-
ter analysis of the perception score.
Using a Quality Model to Evaluate User Interface Trustworthiness of e-Commerce Systems: Scoring Strategies and Preliminary Results
211
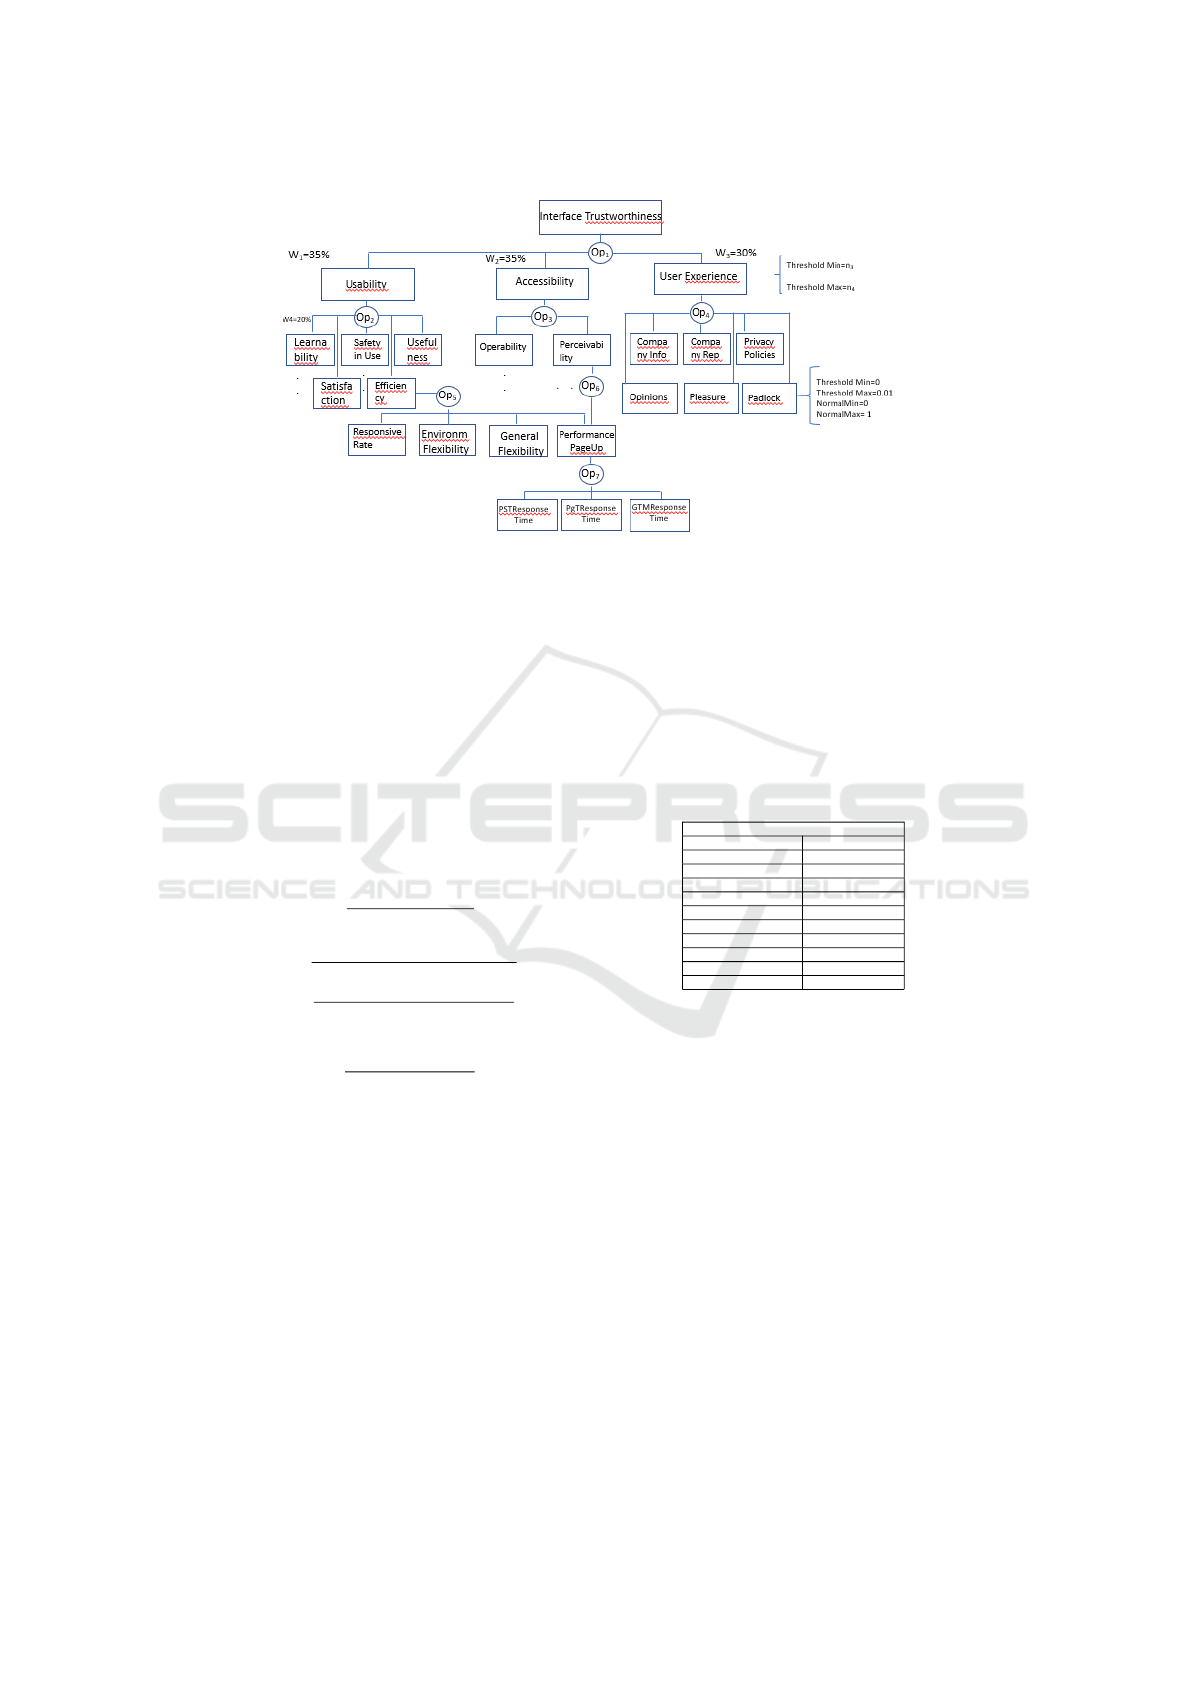
Figure 1: Interface Quality Model.
Expressions (1) and (2) present, respectively, the
equations for calculating the weighted Average (Avg)
and the Standard Deviation (SD) of the values in-
formed by users considering the set of questions Q
(e.g., j
(
1), j
(
2), ..., j
(
m)) related to each attribute k. In
these expressions, i is the value of the Likert Scale, n
ij
is how many times the value i of the Likert Scale was
pointed out (by all the participants) for each question
j of the attribute k, AVG
attr
k
is the weighted average
score considering all questions j belonging to the set
of questions Q, and SD
attr
k
is the standard deviation
of the scores considering the same set of questions.
AV Gattr
k
=
∑
j∈Q(k)
∑
7
i=1
i∗n
i j
∑
j∈Q(k)
∑
7
i=1
n
i j
(1)
SDattr
k
=
v
u
u
t
∑
j∈Q(k)
∑
7
i=1
(i−AV Gattr
k
)
2
∗n
i j
∑
j∈Q(k)
∑
7
i=1
n
i j
(2)
Score
attr
k
=
Score
attr
k
− S
min
S
max
− S
min
(3)
To generate the score for each attribute of the QM,
transformation from the Likert Scale (1-7) to the inter-
val score [0-1] of the AVG
attr
k
must be done. Expres-
sion (3) shows the equation for calculating this score,
where AVG
attr
k
is the weighted average of attribute k,
Smin is the first value of the used Likert Scale (1) and
Smax is the last value of the used Likert Scale (7).
Table 1 presents an example of these calculus for
the sub attribute Environment Flexibility (EF) of an e-
commerce website, measured through questionnaires,
as a pilot test. Two respondents strongly agreed (Lik-
ert Scale 7) and one respondent agreed (Likert Scale
6) with question (i), and also two respondents strongly
agreed and one respondent agreed with question (ii)
(totaling six responses related to EF): (i) the website is
flexible to be used in different browsers; (ii) the web-
site is flexible to be used in different devices (smart-
phones, tablets). As a result, the average (AVG
attr
EF
)
is 6.677, the standard deviation (SD
attr
EF
) is 0.471 and
the Score
attr
EF
is 0.944, which indicates that, as the
score value is close to 1, for this pilot test, the e-
commerce website under test has a good level of en-
vironment flexibility.
Table 1: Sub Attribute Environment Flexibility - Website 1.
Environment Flexibility
Likert Scale (1 to 7) Total Responses
1 0
2 0
3 0
4 0
5 0
6 2
7 4
AVG 6.667
SD 0.471
Score 0.944
As we mentioned before, the interface Trustwor-
thiness measurement is a complement to trustworthi-
ness measurement of the whole system. The idea
followed by this work is aligned with the inter-
est of the Adaptive, Trustworthy, Manageable, Or-
chestrated, Secure, Privacy-assuring Hybrid, Ecosys-
tem for Resilient cloud computing (ATMOSPHERE)
project. ATMOSPHERE is an Europe-Brazil col-
laborative project that aims to propose solutions for
federated clouds and our proposal complements the
trustworthiness score with a user experience measure-
ment. So, we present three other QMs that were de-
fined in the scope of ATMOSPHERE project (Fig-
ure 2): Infra Trustworthiness (refers to available
hardware and software resources), Data Management
Trustworthiness (refers to data storage and retrieval)
and Trustworthy Data Processing Services (TDPS)
Trustworthiness (refers to services that are running
to provide the expected results to the user). The de-
HUCAPP 2022 - 6th International Conference on Human Computer Interaction Theory and Applications
212

tails of these three QMs can be found in the ATMO-
SPHERE project website
3
. Figure 2 shows the Sys-
tem Trustworthiness QM that includes the Interface
Trustworthiness (sub) QM.
Figure 2: System Trustworthiness Model.
4 INTERFACE
TRUSTWORTHINESS
MEASUREMENT
EXPERIMENTS
This section presents the experiments (pilot test) re-
garding the application of the Interface Trustworthi-
ness Quality Model in order to calculate interface-
based trustworthiness scores for e-commerce web-
sites. The purpose of this pilot test is to refine the user
testing process, that is, to improve the instructions on
how to use the websites, improve the questions in the
questionnaires and verify planned calculations on col-
lected data, which is performed using the metrics de-
fined in the work of Casare et al. (Casare et al., 2021).
Although the main goal is not to report test results or
conclusions (given that it is too early to conclude any-
thing based on the measurements obtained with few
users), we intended to test from the users interaction
to complete calculations to better understand the weak
points of the whole process. The first task of all the
participants was to fulfill a Free and Informed Con-
sent Form (Termo de Consentimento Livre e Esclare-
cido - TCLE, in Portuguese) to meet the requirements
of the research ethics board.
4.1 Profile of Participants
Twenty one people between 21 and 52 years old per-
formed the tests to evaluate three e-commerce web-
sites: one of a world-renowned e-commerce, one of
a famous Brazilian e-commerce and one of a famous
Brazilian product. The participants (12 male and 9
female) answered questionnaires about their experi-
3
https://www.atmosphere-eubrazil.eu/sites/default/
files/D3.6-Trustworthiness Measurement and Analysis
Services Implementation.docx.pdf
ence using these websites. Regarding their profes-
sional performance, 70% are not from the Information
Technology domain and have never worked with user
interface or computer systems; 22% already worked
with computer systems, and 8% currently work with
computer systems. The users were divided into two
groups: 12 participants performed the test on the three
websites and answered one questionnaire for each
evaluated website, with questions about learnability,
satisfaction, usefulness, privacy policies, among oth-
ers; the other 9 participants performed the test us-
ing one website and different devices (smartphones,
tablets or laptops) and browsers (Chrome, Firefox,
Safari), and answered the questionnaire composed
by questions about general flexibility and environ-
ment flexibility.The questionnaires and respective re-
sponses can be seen in more detail in the site
4
.
4.2 Results and Discussions
Based on the answers obtained through the question-
naires, the weighted average, standard deviation and
score were calculated for each attribute represented
in the Interface QM. Figure 3 presents these calculus
for the three evaluated e-commerce websites. For the
results presentation, we have decided not to mention
the company and the e-commerce website to assure
neutrality and because usually these companies do
not allow the publication of evaluation results. This
way, they are referred to in the rest of this paper
as e-commerce 1, e-commerce 2 and e-commerce 3,
with no particular order. In Figure 3, for e-commerce
1, the Environment Flexibility attribute presented the
best values for weighted average (AVG = 6.667), stan-
dard deviation (SD = 0.471) and score (0.944). For
e-commerce 2, the Customer Opinions attribute pre-
sented the best values for average (6.583), standard
deviation (0.862) and score (0.931). For e-commerce
3, the best values were presented for the Company
Info attribute (average 5.500, standard deviation 1.708
and score 0.750).
As mentioned before, some attributes are less sub-
jective and can be evaluated using automatic tools.
So, the scores for Responsive Rate, Performance Page
Up, Affordable Rate and Broken Links attributes of
the Interface QM were calculated based on the results
of automatic tools. Regarding the Responsive Rate
attribute, the Mobile Friendly Test tool
5
is the only
stable tool identified to obtain its metric. In this case,
this metric should be 0 (non responsive) or 1 (respon-
sive). All the e-commerce websites used in the exper-
iment are considered ready for mobile devices (scored
4
https://wordpress.ft.unicamp.br/seis/relatorios/
5
https://search.google.com/test/mobile-friendly
Using a Quality Model to Evaluate User Interface Trustworthiness of e-Commerce Systems: Scoring Strategies and Preliminary Results
213
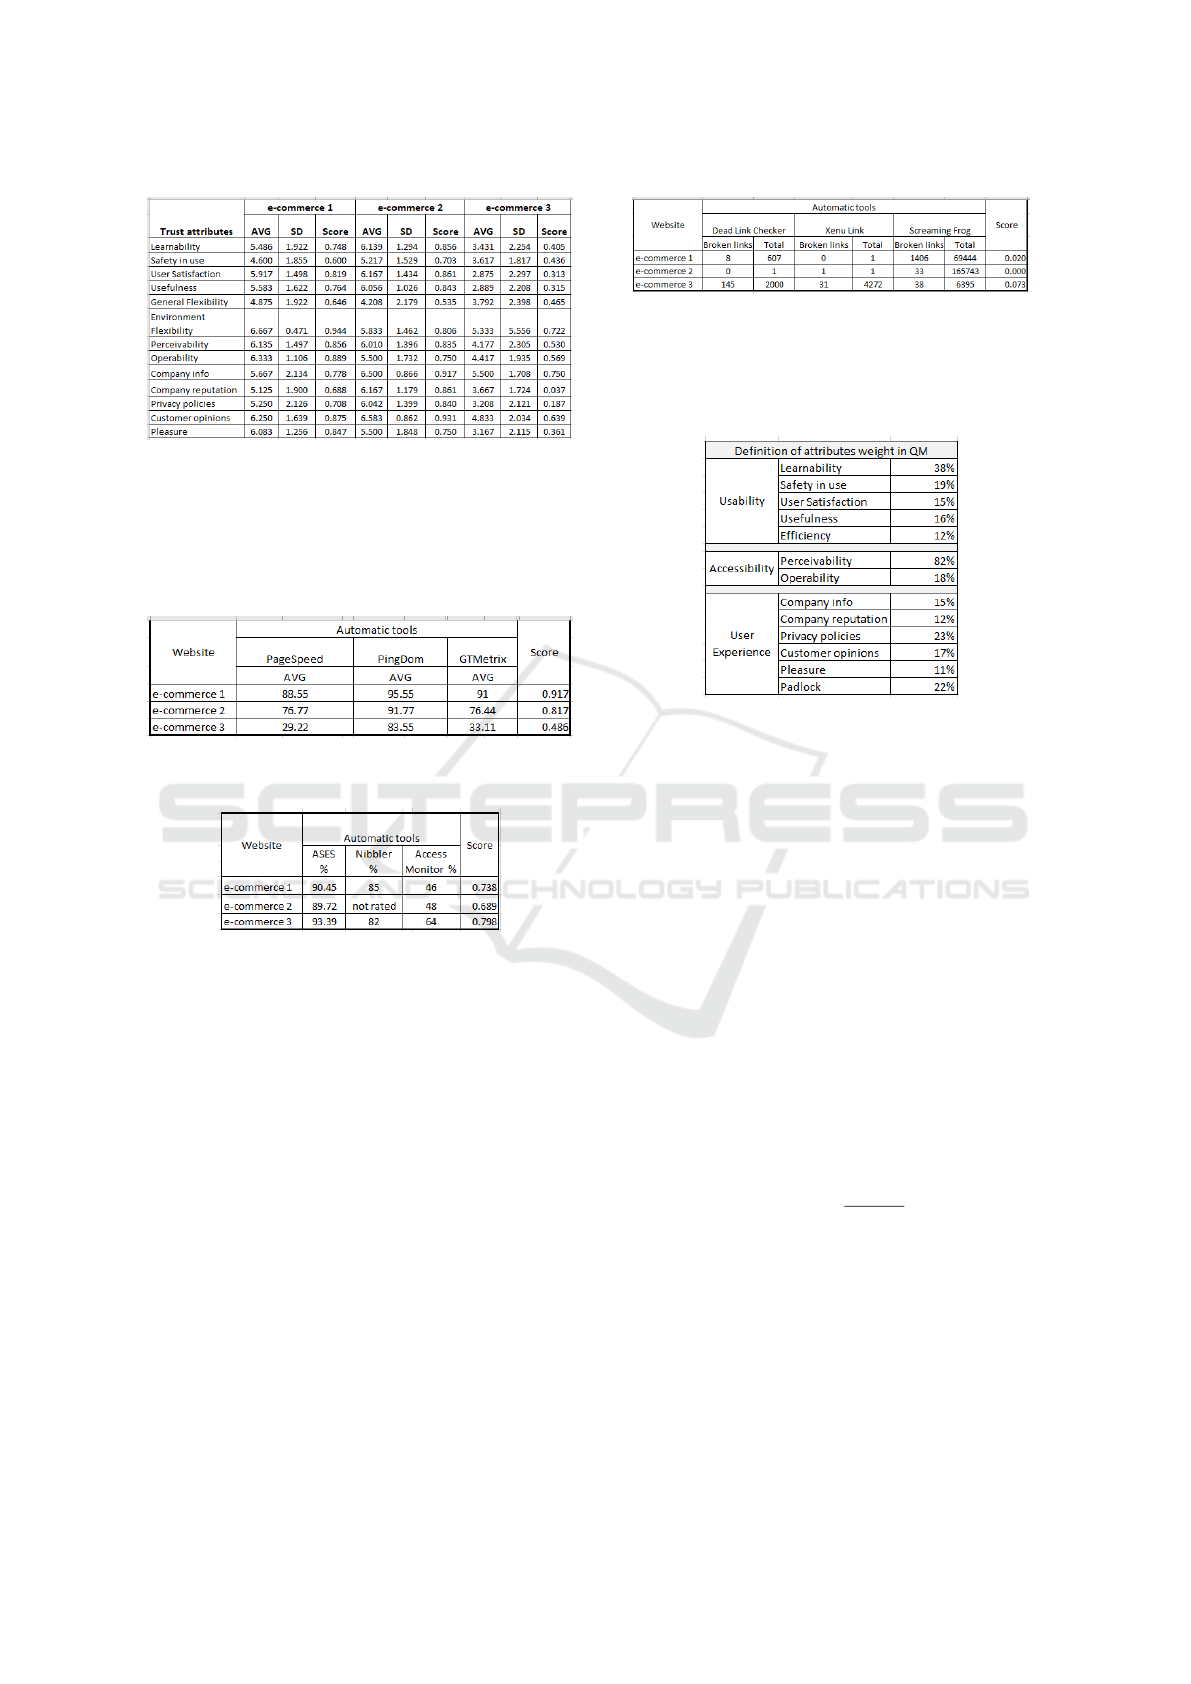
Figure 3: Average (AVG), Standard Deviation (SD) and
Score calculation for e-commerce, based on questionnaires.
as 1) based on Mobile Friendly Test tool (i.e., they are
responsive). Furthermore, Figures 4, 5 and 6 shows,
respectively, the results for Performance Page Up, Af-
fordable Rate and Broken Links attributes.
Figure 4: Performance Page Up measurements and score
calculation for e-commerce, based on automatic tools.
Figure 5: Affordable Rate measurements and score calcula-
tion for e-commerce, based on automatic tools.
In Figure 4, the Performance Page Up score is cal-
culated using the average of the measurements pro-
vided by the automatic tools (Page Speed, PingDom
and GTMetrix). The same calculation (i.e., average)
is performed to obtain the Affordable Rate score (5),
which uses the Ases, Nibbler and Access Monitor
tools. The Broken Link score is calculated based on
the maximum rate obtained by any of the tools, i. e.,
it is calculated as MAX(Dead Link Checker (broken
links / total links), Xenu’s Link (broken links / total
links)). More details about the metrics for calculating
scores based on automatic tools can be found in the
work of Casare et al. (Casare et al., 2020).
After calculating the scores for the leaf attributes
(i.e., the attributes already presented, whose calculus
were obtained through questionnaires or automatic
tools), these values are used to calculate the scores of
their respective composite attributes in the Interface
QM. To do this, it is necessary to use the weights for
Figure 6: Broken links measurements and score calculation
for e-commerce, based on automatic tools.
each composite attribute. These weights are shown
in Figure 7 and the way how they were obtained is
explained in the next subsection.
Figure 7: Weights of Sub Attribute of QM.
4.3 Weighting the Attributes
Besides calculating the attribute scores, it was possi-
ble, analyzing the questionnaires responses, to deter-
mine the weights for each composite attribute in the
Interface QM. These weights were defined according
to the participants’ perception, i.e., the attributes that
received the highest score (7) are considered more
significant for measuring trust Expression (4) presents
the equation for calculating the weight for each com-
posite attribute. The Weight
j
is the importance of the
attribute j for its parent attribute. It is important to
mention that, if two attributes have the same amount
of respondents who scored it with the highest score
(7), the second highest score (6) will be used to deter-
mine which one is the most important; then the third
highest score (5) will be used, and so on so forth.
However, the weight for both attributes will be the
same.
Weight
j
=
n7
j
∑
n
j=1
n7
j
(4)
Figure 7 presents the weight of each composite at-
tribute of Interface QM that was collected with ques-
tionnaires. These weights were calculated with Ex-
pression (6), and were distributed guided by the QM
structure. According to the experiments, the most im-
portant Usability sub attribute is Learnability, with
38%; for Accessibility is Perceivability, with 82% and
for User Experience is Privacy Policies, with 23%.
HUCAPP 2022 - 6th International Conference on Human Computer Interaction Theory and Applications
214
These weights must be considered to complete the In-
terface QM.
4.4 Calculating the Trustworthiness
Scores for the e-Commerce Websites
In this subsection we present the process to calcu-
late the scores for composite attributes. For sake of
simplicity, we explain, as example, the calculation of
some attributes of the third level of the Interface QM
(e.g.Efficiency), one attribute of the second level (Us-
ability) and the first level, i.e., the root attribute in the
QM (Interface Trustworthiness). The remaining com-
posite attributes, which are not explained here, follow
the same calculation process.
The Efficiency attribute is a composition of Re-
sponsive Rate, Environment Flexibility, General Flex-
ibility and Performance Page Up. Environment Flex-
ibility and General Flexibility attributes were evalu-
ated through the questionnaires. Their weights were
defined based on the Expression (6) and got a rate
of 11% and 15% respectively. To reach the full rate
(100%), it was assigned, respectively, a weight of
37% for Responsive Rate and Performance Page Up
attributes. Therefore, as an example, the calculation
of Efficiency score is:
ScoreEfficiency = (ResponsiveRate * W + Envi-
ronmentFlexibility * W + GeneralFlexibility * W +
PerformancePageUp * W), i.e., ScoreEfficiency = (1
* 0.37 + 0.944 * 0.11 + 0.646 * 0.15 + 0.917 * 0.37)
= 0.910.
Following the Interface QM, the next attribute
to be calculated is Usability, which is composed by
Learnability, Satisfaction, Safety in use, Efficiency
and Usefulness attributes. The same reasoning ap-
plies to Accessibility and User Experience attributes.
Finally, the Interface Trustworthiness score, which is
composed by Usability, Accessibility and User Expe-
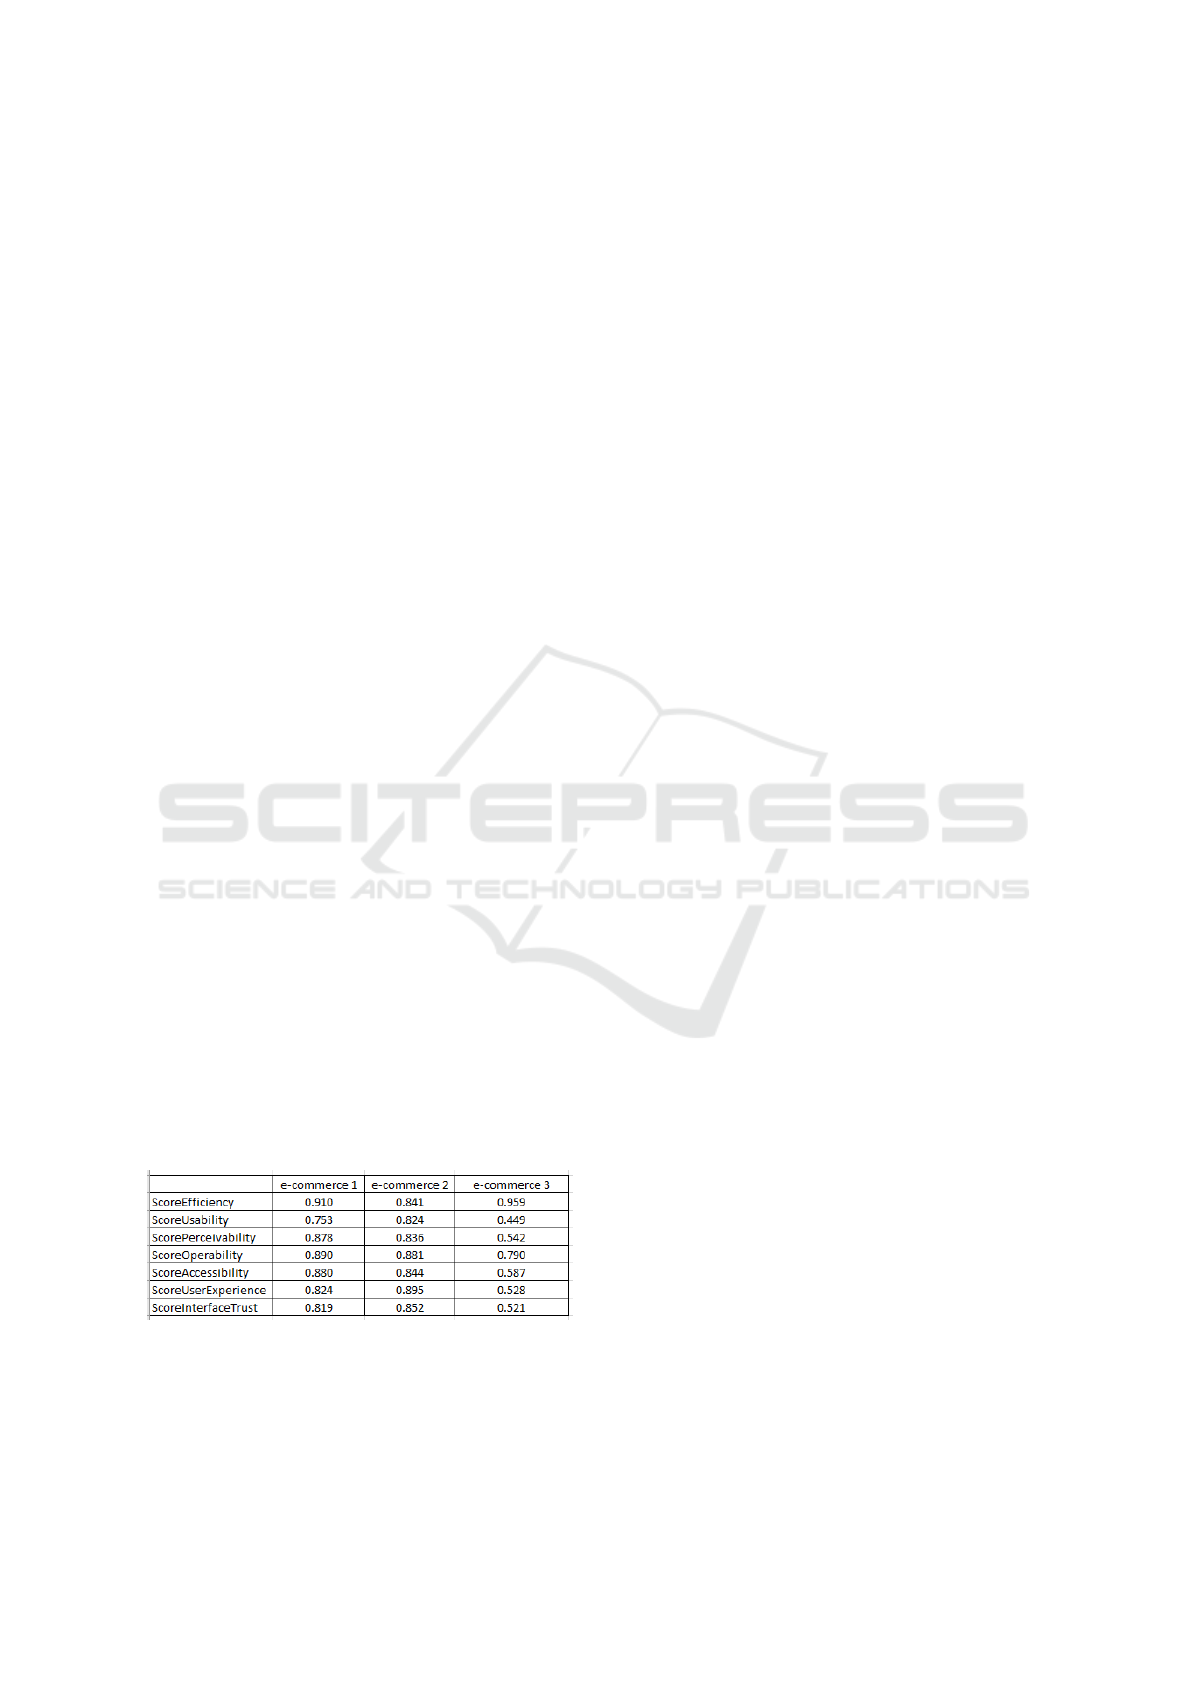
rience is calculated. Figure 8 presents the Usability,
Accessibility, User Experience and Interface Trust-
worthiness scores of the Interface QM.
Figure 8: Trustworthiness score calculation for e-commerce
websites.
Analyzing the scores obtained in the pilot test
we have some evidence that e-commerce 2 had the
best Interface Trustworthiness score (0.852), followed
by e-commerce 1 (0.819) and e-commerce 3 (0.521),
which presents the worst trustworthiness. The worst
score is the e-commerce 3 Usability attribute (0.449).
The e-commerce 2 User Experience score is the best
one. The e-commerce 2 also presents the best usabil-
ity among the three websites and e-commerce 1 is the
most accessible of them.
Although these results may provide some evi-
dence, they are not conclusive results, since the test
was carried out with few users and aimed to improve
the process. However, the pilot test reached the ex-
pected goals once we are able to identify problems in
some steps of the methodology and fix them before
the test with a wider number of users.
Firstly, the participants reported that knowing the
post-test questionnaire before starting the pilot test
helped them to have more attention to some details
of the interface and the task that had to be performed
during the test on the website. Aware of this, we have
improved our test guideline to suggest that the partic-
ipant read the post-test questionnaire before interact-
ing with the website.
Some participants reported that the option “not ap-
plicable” was missing in some questions, such as ones
related to website failures. If there is no failure, how
should it be scored? The questionnaire was analyzed
and this option was added in the questions about Fault
Handling and Broken Links, plus an observation in
the instruction to select the option ”4” (neutral score)
in case of doubt in choosing the answer.
During the results calculation step, the lack of in-
formation about “Start and end time” of the test in
each analyzed website was detected. In addition to
being interesting to measure the test effort, it is nec-
essary to calculate the failure rate, which is one of
the attributes in the model and it was completely for-
gotten. The information now is being required in the
questionnaire and we added an alert in the guideline
to highlight the importance of this information.
At the beginning we were in doubt about the use-
fulness of performing the whole evaluation process,
as the results with few people would not be reliable
enough for any strong conclusion. Fortunately, we
persisted in completing the Quality Model with all
collected metrics and calculated the results (all the
scores). In doing so, we realized that the weights
of the metrics collected by the automatic tools were
overvalued. This was happening because the value to
complete the total percentage (100%), taking into ac-
count the other attributes of the same group, was be-
ing attributed to this weight automatically. To solve
the problem, a question was added for each automatic
tool about the importance perceived by the participant
Using a Quality Model to Evaluate User Interface Trustworthiness of e-Commerce Systems: Scoring Strategies and Preliminary Results
215

related to the automatic attribute.
5 CONCLUSIONS AND FUTURE
WORK
This work presents a solution to support user inter-
face measurement and analysis, which can help the
computation of trustworthiness scores. The approach
was evaluated during a pilot test whose results are
also presented. Twenty one metrics were obtained
based on the answers of questionnaires and four met-
rics with automatic tools evaluation. The work is part
of a wider proposal, in which several metrics were
defined, validated and combined following a method-
ology toward trustworthiness score calculation.
The interface trustworthiness score should trans-
late the relative user’s perception when using online
applications. It complements other technical trust-
worthiness scores (such as Infrastructure, Data Man-
agement and Data Processing Services) toward the
System Trustworthiness Score, which will allow users
to compare (benchmarking) and choose systems that
present a high level of trust. It is important to em-
phasize that the proposal is not to predict the web-
site trustworthiness, but rather to offer a mechanism
for evaluating the website trustworthiness aiming to
choose, among the possible websites available for the
task to be done, the one with the highest level of trust.
Through the use case composed by 3 e-commerce
websites, it was possible to conclude that the ap-
proach is feasible and can be applied to e-commerce
websites. Moreover, it was possible to observe the
importance of the proposed mechanism (i.e., the In-
terface Quality Model) to obtain the score, as well as
the equation to calculate the weight of each sub at-
tribute, as it balances the results based on the impor-
tance of the attributes.
The problems identified during the pilot test were
fixed for the more complete test, as follows: (i) in the
test guidelines, a suggestion to read the post-test ques-
tionnaire before accessing the website was added and
also a highlight on the importance of filling the time
of test start and end on each website; (ii) the option
“Not Applicable” was added to some questions plus
a remark linking option ”4” when no answer is ade-
quate; (iii) the start and end time were added to the
post-test questionnaire; (iv) a question was added for
each metric collected by the automatic tools, to catch
the participant perception about their importance.
Future work includes the use of the testing proce-
dure with a larger number of participants and defin-
ing appropriate statistical models (for example, PLS -
Partial Least Squares and Cronbach’s alpha), to assess
the reliability of the measures, their consistency and
the homogeneity of the items in the scale, helping to
identify the best set of attributes to consider (that is,
the most reliable set of measures).
ACKNOWLEDGEMENTS
This work is supported by the ATMOSPHERE project
(https://www.atmosphere-eubrazil.eu/ - Horizon 2020
No 777154 - MCTIC/RNP), ADVANCE project
(http://advance-rise.eu/ - Horizon 2020-MSCA-RISE
No 2018-823788) and CAPES, Finance code 001.
REFERENCES
Brooke, J. (1996). Sus: a ”quick and dirty” usability. Us-
ability evaluation in industry, 189.
Casare, A., Basso, T., and Moraes, R. (2020). Trust met-
rics to measure website user experience. In The 13th
International Conference on Advances in Computer-
Human Interactions, pages 1–8.
Casare, A., Silva, C., Basso, T., and Moraes, R. (2021).
Towards usability interface trustworthiness in e-
commerce systems. In 15th International Confer-
ence on Interfaces and Human Computer Interaction,
pages 1–8.
IEC, I. (2005). Software Product Quality Requirements and
Evaluation - SQUARE. User guide, ISO/IEC.
ISO (2016). Systems and software engineering - sys-
tems and software quality requirements and evaluation
(square) - measurement of quality in use (ISO/IEC).
Olsina, L., Papa, F., and Molina, H. (2008). Ontologi-
cal support for a measurement and evaluation frame-
work. International Journal of Intelligent Systems,
23(12):1282–1300.
Parmanto, B. and Zeng, X. (2005). Metric for web accessi-
bility evaluation. Journal of the American Society for
Information Science and Technology, 56(13):1394–
1404.
Roy, M. C., Dewit, O., and Aubert, B. A. (2001). The im-
pact of interface usability on trust in web retailers. In-
ternet research: Electronic Networking Applications
and Policy, 11(5):388–398.
Seffah, A., Donyaee, M., Kline, R. B., and Padda, H. K.
(2006). Usability measurement and metrics: A con-
solidated model. Software quality journal, 14(2):159–
178.
Song, L. and Lai, H. (2017). Identifying factors affect-
ing customer satisfaction in online shopping. In Proc.
of the 4th Multidisciplinary International Social Net-
works Conference, pages 1–12.
HUCAPP 2022 - 6th International Conference on Human Computer Interaction Theory and Applications
216
