
Panoptic Visual Analytics of Eye Tracking Data
Valeria Garro
a
and Veronica Sundstedt
b
Blekinge Institute of Technology, Karlskrona, Sweden
Keywords:
Eye Tracking, Visualization, Semantic Areas of Interest, Panoptic Segmentation.
Abstract:
In eye tracking data visualization, areas of interest (AOIs) are widely adopted to analyze specific regions of
the stimulus. We propose a visual analytics tool that leverages panoptic segmentation to automatically divide
the whole image or frame video in semantic AOIs. A set of AOI-based visualization techniques are available
to analyze the fixation data based on these semantic AOIs. Moreover, we propose a modified version of radial
transition graph visualizations adapted to the extracted semantic AOIs and a new visualization technique also
based on radial transition graphs. Two application examples illustrate the potential of this approach and are
used to discuss its usefulness and limitations.
1 INTRODUCTION
Several visualization techniques have been proposed
to perform analysis of eye tracking data providing in-
formation about the location of the user’s visual at-
tention and its variations on a stimulus. The use of
Areas of Interest (AOIs) is a well-established method
for eye tracking data analysis to study how par-
ticipants’ attention is distributed over particular re-
gions (Blascheck et al., 2017a). AOIs are specific
regions of the stimulus which are highly significant;
they can have a specific meaning for the analyst, com-
monly a semantic meaning (e.g. a specific object in
the scene), or they can be identified directly using
the gaze data, e.g. clustering of fixations (Blascheck
et al., 2017a). The definition of AOIs plays a crucial
role in the analysis, and it is a fundamental part of the
study’s hypothesis (Holmqvist et al., 2015); missing
or inaccurate AOIs can limit the results. A common
practice in eye tracking analysis is to define AOIs by
manual annotation. This process is time-consuming,
especially for video stimuli (Holmqvist et al., 2015),
and prone to spatial inaccuracies. In some cases,
this manual process is necessary due to the need of
the analyst to define a particular area of the stimuli.
However, in the case of AOIs with semantic meaning
(e.g. object classes like vehicles, people, and furni-
ture), computer vision methods for image object de-
tection and image classification can support the AOIs
extraction and automate the process. Recently several
a
https://orcid.org/0000-0002-9527-4594
b
https://orcid.org/0000-0003-3639-9327
automatic AOIs extraction methods based on object
detection have been proposed, due also to the latest
improvement of performance and accuracy of deep
learning approaches (Wolf et al., 2018) (Panetta et al.,
2020) (Barz and Sonntag, 2021). These automatic ap-
proaches also support the analysis of eye tracking data
gathered from head-mounted devices, e.g. eye track-
ing glasses. In this case, the recording sessions are
usually long and they differ between participants due
to the nature of egocentric footage; hence a manual
definition of AOIs would be time-consuming.
Following the recent advancements in image seg-
mentation research, in this position paper we in-
vestigate the use of panoptic segmentation (Kirillov
et al., 2019b) to divide the entire stimulus into dif-
ferent areas with semantic meaning, from here on
denoted as Semantic AOIs (SAOIs), and we apply
several AOI-based visualization techniques to ana-
lyze the eye tracking data. In computer vision, im-
age parsing (Tu et al., 2005) or scene parsing (Tighe
et al., 2014), more recently addressed as panoptic
segmentation (Kirillov et al., 2019b), can be defined
as the combination of semantic segmentation (Shel-
hamer et al., 2017) and instance segmentation. With
semantic segmentation, we address the problem of
assigning a semantic class label to every pixel of
the image (or video frame) with no distinction be-
tween different instances of the same class (e.g. two
cars belong to the same class). Combining this to
instance segmentation, panoptic segmentation also
distinguishes between different instances of specific
countable classes. We argue that this technique ap-
plied to the analysis of eye tracking data allows a
Garro, V. and Sundstedt, V.
Panoptic Visual Analytics of Eye Tracking Data.
DOI: 10.5220/0010889500003124
In Proceedings of the 17th International Joint Conference on Computer Vision, Imaging and Computer Graphics Theory and Applications (VISIGRAPP 2022) - Volume 3: IVAPP, pages
171-178
ISBN: 978-989-758-555-5; ISSN: 2184-4321
Copyright
c
2022 by SCITEPRESS – Science and Technology Publications, Lda. All rights reserved
171

comprehensive semantic analysis of the entire stim-
ulus, not limiting the analysis to a set of predefined
AOIs. For this reason, we explore a novel approach
of visual analytics of eye tracking data which lever-
ages a holistic semantic scene parsing of the stim-
uli. More in detail: (i) we present a prototype of our
visual analytics tool of eye tracking data which au-
tomatically extracts SAOIs from the stimulus using
deep learning panoptic segmentation; (ii) the visual
analytics tool includes a set of established AOI-based
visualization techniques showing both temporal and
relational features, among which we propose a variant
of the AOI radial transition graph (Blascheck et al.,
2013) (Blascheck et al., 2017b) adapted to the con-
cept of SAOIs, and a novel AOI transition graph also
based on the radial transition graph. Finally, two ap-
plication examples are included to illustrate the poten-
tial of the tool performing a semantic AOIs analysis of
eye tracking data and discussing its limitations.
2 RELATED WORK
AOI visual analytics of eye tracking data consists of
two main steps: the AOIs definition and the selection
of visualization techniques to analyze the data. In this
section, we group relevant previous works based on
these two phases.
2.1 AOI Definition
AOIs are usually created by manual annotation, e.g.
defining the region of interest with simple shapes
like rectangles or more complex polygon shapes.
Alternatively, a common approach is the automatic
generation of AOIs by processing the eye tacking
data (Blascheck et al., 2017a), e.g. spatial clustering
of fixation locations (Privitera and Stark, 2000) (San-
tella and DeCarlo, 2004), and processing fixation
heatmaps (Fuhl et al., 2018a) in image stimuli, as well
as space-time clustering of fixations in video stim-
uli (Kurzhals and Weiskopf, 2013). A third approach
is based on processing the stimulus (image or video)
and extracting AOIs based on saliency maps (Fuhl
et al., 2018b), (Privitera and Stark, 2000), (Borji and
Itti, 2013).
Recent works investigated the application of ma-
chine learning image segmentation algorithms sup-
porting AOIs extraction, also in conjunction with the
need to analyze eye tracking data gathered from head-
mounted devices. In (Wolf et al., 2018), the authors
proposed a method for automatic gaze mapping on
AOIs extracted based on Mask R-CNN (He et al.,
2017), a deep learning object detection and segmen-
tation algorithm. In their pilot study, they trained the
algorithm with a relatively small dataset limiting the
object detection to two different classes of objects in
a controlled test environment. They compared the au-
tomatic gaze mapping to a manual mapping consid-
ered as ground truth. The evaluation showed promis-
ing results but also highlighted the impact of the size
of the training dataset when applying a deep learning-
based algorithm. Recently, Barz and Sonntag pre-
sented two methods for automatic AOIs detection
based on pre-trained deep learning models (Barz and
Sonntag, 2021). The first one classifies fixed-size im-
age patches centered on the gaze signal using ResNet,
while the second one has a similar approach of (Wolf
et al., 2018) but uses a Mask R-CNN model pre-
trained on the MS COCO dataset (Lin et al., 2014).
The use of image segmentation algorithms for
AOIs extraction as part of visual analytics tools of
eye tracking data has been proposed by (Panetta et al.,
2020). The authors presented ISeeColor, a visualiza-
tion system of eye tracking data that defines AOIs us-
ing deep learning-based image semantic segmentation
algorithms, i.e. Deeplabv3 (Chen et al., 2018a) (Chen
et al., 2018b) and EncNet (Zhang et al., 2018). The
system is designed for the analysis of egocentric eye
tracking data and it automatically annotates objects of
interest (OOI) according to a predefined set of seman-
tic categories, e.g. cars and people. The fixation data
are analyzed with respect to the extracted OOI and
visualized in the system. In addition to classic eye
tracking data visualizations, e.g. scarf plot (Richard-
son and Dale, 2005), the fixation duration of each OOI
is also visualized by a recoloring of the segmented
OOI overlaid on the video frames. Different colors
represent different fixation durations.
Our work differs from IseeColor as we investi-
gate the use of panoptic segmentation, a holistic scene
parsing of the entire image, instead of the extraction
of only specific classes. We also provide different vi-
sualization techniques to analyze the fixation data; in
particular, we add visualization techniques that ana-
lyze the relation between AOIs, such as AOI transi-
tion graphs. Moreover, we propose two new variants
of the AOI radial transition graph.
2.2 AOI-based Visualization Techniques
According to (Blascheck et al., 2017a), AOI-based
visualizations can be categorized in two main ap-
proaches: one drawing attention to AOIs temporal vi-
sualizations, and the other highlighting the relation-
ship between AOIs.
Timeline AOI visualizations represent the gaze
data in relation to the AOIs focusing on the tempo-
IVAPP 2022 - 13th International Conference on Information Visualization Theory and Applications
172

ral feature. A typical example of temporal visualiza-
tion is the scarf plot (Richardson and Dale, 2005), a
color-coded timeline representing the focus of the par-
ticipant over time on the set of AOIs in which each
AOI is represented by a different color. Scarf plots
of several participants can be aligned and displayed
close to each other in the same view for compari-
son. Parallel Scan-Path (Raschke et al., 2012) and
AOI Rivers (Burch et al., 2013) are examples of time-
line visualizations representing in one dimension the
time while in the other dimension the set of prede-
fined AOIs. While the scarf plot is unique for each
participant, these visualizations can intrinsically dis-
play gaze data from multiple participants. In Parallel
Scan-Path, the data of each participant are shown in-
dividually while in the AOI rivers in an aggregated
form.
Alternatively, relational AOI visualizations focus
on displaying the relation among AOIs, e.g. tran-
sitions between AOIs. AOI transitions can be visu-
alized in different ways. A simple approach is an
AOI transition matrix (Goldberg and Kotval, 1999)
in which rows and columns correspond to the AOIs
and the value at cell (i, j) represents the frequency
of transitions from AOI i to AOI j of two consec-
utive fixations. Examples of more complex visual-
ization techniques are AOI transition trees (Kurzhals
and Weiskopf, 2015), and AOI circular transition dia-
grams (Blascheck et al., 2013) also called radial tran-
sition graphs (Blascheck et al., 2017b). In the radial
transition graph, the AOIs are represented in a circu-
lar diagram as ring sectors. In the internal part of the
circular diagram, lines connecting two sectors depict
transitions between the two AOIs, while the thickness
of the line encodes the transition frequency. Only the
AOIs which were focused on by the participant are
displayed in the layout. Several variants of this type
of visualization have been proposed varying the size
and the colors of the ring sectors. For example, the
sector size can be equal for all AOIs or proportional to
the aggregated fixation duration within an AOI, while
the color can encode the fixation count or identify a
specific AOI. In (Blascheck et al., 2017b), the authors
presented a graph comparison method based on ra-
dial transition graphs. In their method, they applied a
version of radial transition graph in which the size of
the sectors is proportional to the aggregated fixation
duration and the colors identify different AOIs. Each
radial transition graph displays the eye tracking data
of one participant. This circular and compact layout
supports a direct comparison of a pair of participants
based on the juxtaposition of their corresponding ra-
dial transition graphs (Blascheck et al., 2017b).
Our proposed visualization tool includes both
temporal (scarf plot) and relational AOI-based visu-
alizations. Our version of the radial transition graph,
i.e. the SAOI radial transition graph, also encodes the
area of the extracted AOIs. Moreover, we also pro-
pose a further modification called SAOI mirror radial
transition graph in which the transition lines follow a
predefined pattern that could improve the readability.
3 PANOPTIC VISUAL
ANALYTICS TOOL
The proposed visualization tool is implemented in
Python and all visualizations are created with the
Matplotlib library (Hunter, 2007). An overview of
the interface is shown in Figure 1a. The user loads
the stimulus (image or video) via the interface and
can choose between starting the segmentation algo-
rithm or directly loading the segmentation data in
case the segmentation has already been performed.
The panoptic segmentation is performed using Detec-
tron2 (Wu et al., 2019), Facebook AI Research library
platform which provides state-of-the-art computer vi-
sion detection and segmentation algorithms, and it is
based on PyTorch (Paszke et al., 2019). The panoptic
segmentation algorithm available in Detectron2 is an
implementation of the work of (Kirillov et al., 2019a)
called Panoptic Feature Pyramid Networks (Panoptic
FPN) based on Mask R-CNN. In the case of video
stimuli, the current implementation of panoptic seg-
mentation in Detectron2 also provides a basic propa-
gation of instance IDs across frames which is suitable
for scenes that do not present major overlaps between
different instances.
The output of the segmentation consists of a seg-
mented image or a set of frames in which the color
of each pixel represents a specific semantic AOI, and
a corresponding text file provides information about
the association between colors and SAOIs. When the
user loads the eye tracking data, the tool processes the
fixation data and assigns each fixation to a SAOI ac-
cording to the fixation location. This process is per-
formed by analyzing the colors of a 5×5 mask cen-
tered on the location of the fixation and extracting the
SAOI corresponding to the most frequent color on the
mask. The SAOIs extracted in the segmentation phase
are displayed on the lower left part of the visualization
tool. They are ordered according to the percentage of
occupied area in the stimuli. This ordering allows an
initial analysis of the SAOIs and facilitates the selec-
tion of the relevant SAOIs and the exclusion of those
SAOIs which have been classified incorrectly by the
segmentation algorithm. When the user imports the
Panoptic Visual Analytics of Eye Tracking Data
173
1
1
2 3
4
(a)
(b)
(c)
SAOI Transitions Count
(d) (e) (f)
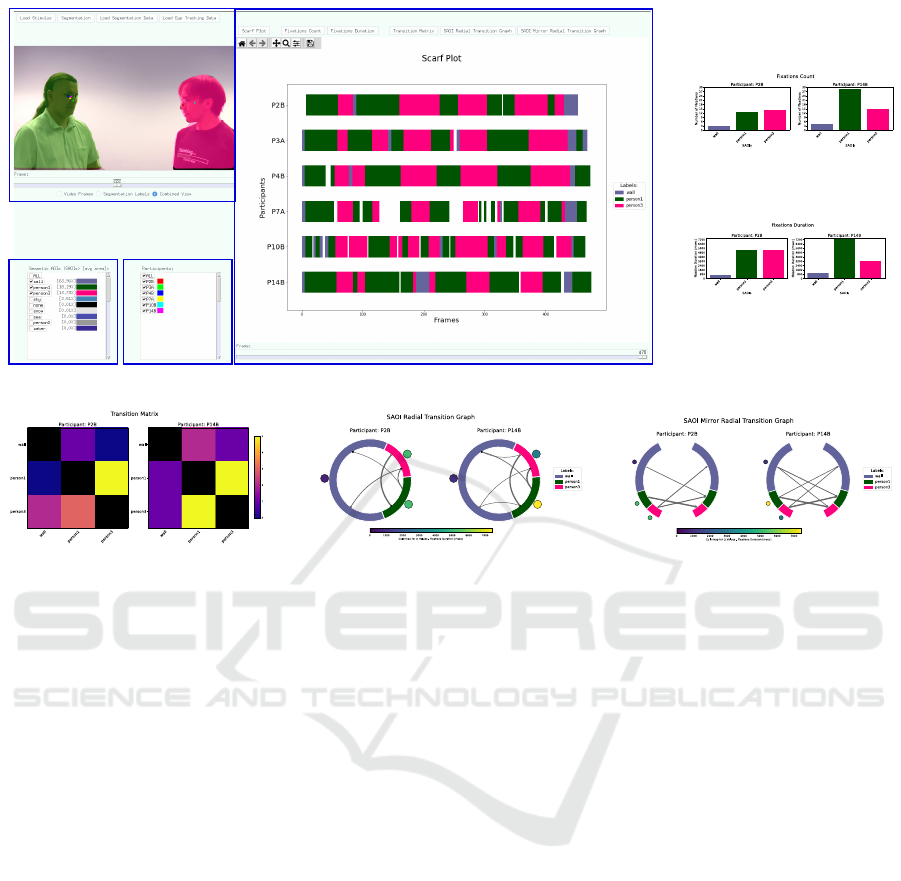
Figure 1: (a) Panoptic Visual Analytics Tool. (1) The stimuli view shows the stimuli frame and the segmentation results
together with the fixation locations for the selected participants. (2) List of SAOIs extracted from the panoptic segmentation
algorithm. (3) List of participants from the loaded eye tracking data. (4) Visualization view in which the user can choose
between six different visualizations; here the scarf plot is shown from six participants. (b)-(f) The other available visualiza-
tions, in this example only for participants P2B and P14B and the selected SAOIs: (b) Fixation count bar graph, (c) Fixation
duration bar graph, (d) Transition matrix, (e) SAOI radial transition graph, and (f) SAOI mirror radial transition.
eye tracking data on the tool, the list of participants
appears on the right of the list of extracted SAOIs.
The stimuli view on the top left can be used to in-
spect the semantic AOIs and also the fixation loca-
tions. The user can choose among the original stimuli,
the color-coded segmented stimuli, and a combination
of these two views by a superimposition of the semi-
transparent version of the segmentation over the orig-
inal stimuli. The fixation locations are represented by
small colored circles with the corresponding color of
the participant shown in the participants list.
A set of six different visualizations are available
to analyze the fixation data of the selected partici-
pants over the selected SAOIs: a scarf plot, bar graphs
representing fixation counts and fixation durations, a
transition matrix, a modified version of the radial tran-
sition graph, and a novel transition diagram which we
call SAOI mirror radial transition graph. For all visu-
alizations, the analyst can navigate through time us-
ing the frame slider at the bottom of the visualization
area. The selected visualization is then updated show-
ing only the data related to the time span up to the
frame indicated by the slider. The adapted version of
the radial transition graph, which we call SAOI radial
transition graph, is presented in the following section,
while the description of the components of the novel
SAOI mirror radial transition graph is presented in
Section 3.2.
3.1 SAOI Radial Transition Graph
The SAOI radial transition graph is a modified version
of the radial transition graph (Blascheck et al., 2017b)
which has been described in Section 2.2. In our ver-
sion, the size of a ring sector is proportional to the
percentage of the area covered by the corresponding
SAOI on the stimuli. Moreover, all SAOIs selected by
the user are visualized in the graph, not exclusively
the ones focused on by the participant. Each ring sec-
tor has the same color of its corresponding SAOI from
the segmentation data to facilitate the data correlation
between the stimuli view and the visualization view.
The fixation duration value of each SAOI is dis-
played with a color-coded circle positioned in the ex-
ternal part of the circular layout and it is centered to
its corresponding ring sector, as shown in Figure 1e.
IVAPP 2022 - 13th International Conference on Information Visualization Theory and Applications
174
(a)
(b)
(c)
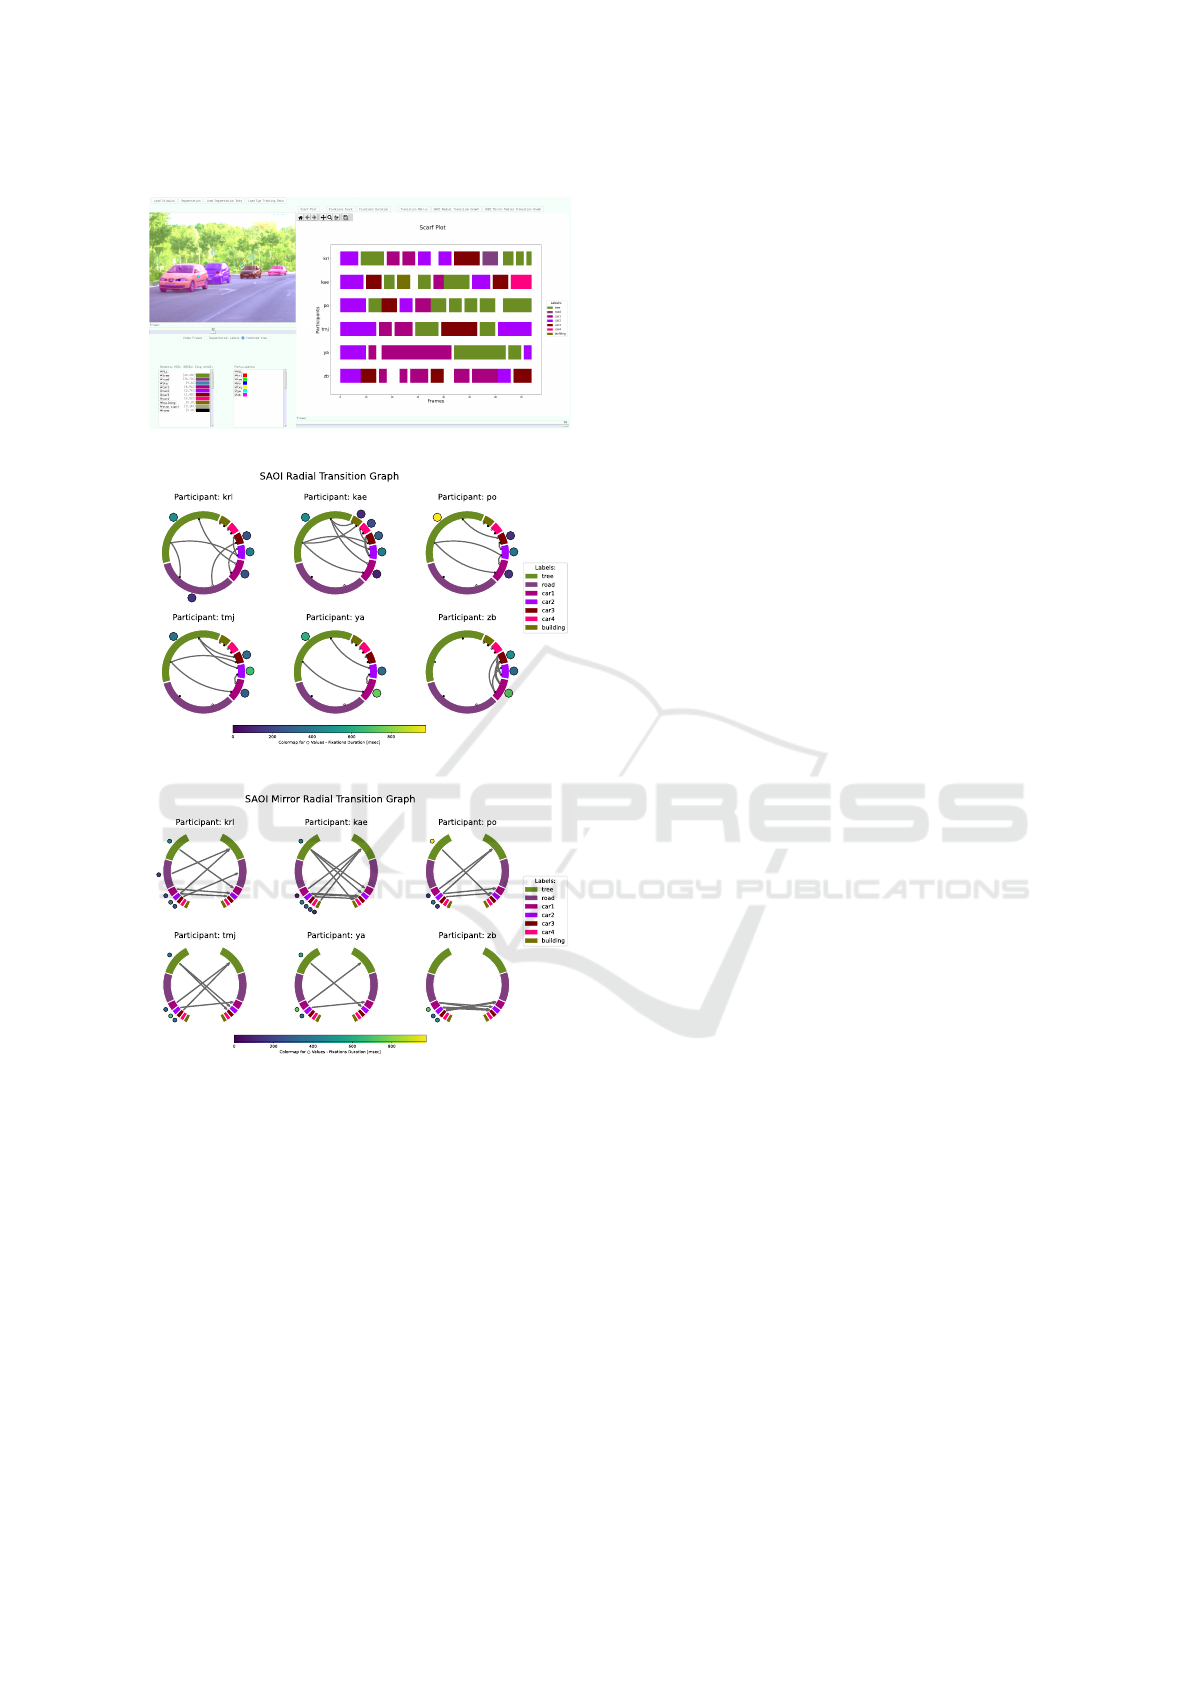
Figure 2: Panoptic Visual Analytics Tool extracting SAOIs
with panoptic segmentation from an image of the FixaTons
dataset. (a) Tool interface and scarf plot visualization. (b)
SAOI radial transition graph. (c) SAOI mirror radial transi-
tion graph.
The applied colormap is a global colormap ranging
from zero to the highest fixation duration extracted
from all selected participants’ data. Only the ring sec-
tors of SAOIs focused on by the participant are com-
plemented with the corresponding fixation duration
circles. The transitions between SAOIs are encoded
with a transition line in the internal part of the circular
graph. The thickness of the line is proportional to the
number of transitions. As in (Blascheck et al., 2017b),
each ring sector has two distinct anchor points for the
transition lines to avoid visual clutter, one represent-
ing the starting point of a transition and the other the
ending point.
3.2 SAOI Mirror Radial Transition
Graph
The proposed novel visualization called SAOI mir-
ror radial transition graph is based on our SAOI ra-
dial transition graph. The layout of the diagram is
still circular but each SAOI is represented twice in
the graph with two ring sectors positioned symmet-
rically with respect to the vertical axis, as shown in
Figure 1f. This design has been inspired by the con-
nectogram (Irimia et al., 2012), a graph representation
of brain regions’ connectivity, which has a symmetri-
cal layout of the two cerebral hemispheres.
A transition between two SAOIs s
i
and s
j
is en-
coded with an arrow line starting from the ring sector
on the left side of the graph corresponding to s
i
and
ending on the ring sector on the right side of the graph
corresponding to s
j
. The proposed layout would al-
low better readability of the transitions compared to
the radial transition graph, especially for transitions
between two adjacent SAOIs and in the case of a
graph with numerous SAOIs. The starting SAOIs are
always located on the left side of the diagram while
the ending SAOIs are always on the right side. More-
over, it does not require two distinct anchors points
in each ring sector. As in the SAOI radial transition
graph, the size of each ring sector is proportional to
the area of the corresponding SAOI and the thickness
of the arrow lines corresponds to the number of transi-
tions. The fixation duration of each SAOI is still rep-
resented by a color-coded circle positioned near the
matching ring sector but only on the left side of the
graph to avoid visual clutter.
4 APPLICATION EXAMPLES
As a first analysis, we show the capabilities of our vi-
sualization tool, and the two proposed visualizations
are presented by two application examples, i.e. an im-
age stimulus and a video stimulus. The image stim-
ulus belongs to the FixaTons dataset (Zanca et al.,
2018), a collection of datasets’ scanpaths, i.e. or-
dered sequences of fixations, including stimuli from
the MIT1003 dataset (Judd et al., 2009). The video
stimulus is included in the Eye Tracking Benchmark
dataset (Kurzhals et al., 2014). For both examples, we
used the Panoptic FPN model pretrained on COCO
(R101-FPN) available on the Detectron2 website (Wu
Panoptic Visual Analytics of Eye Tracking Data
175

et al., 2019). In the first example, we test our visual-
ization tool with an image from the FixaTons dataset
showing an outdoor scene with four cars on a road.
We run the panoptic segmentation on the image with
a confidence threshold of 0.6, i.e. keeping instance
predictions with a confidence score higher or equal to
0.6. The algorithm correctly extracted four instances
of the class ‘car’, one instance of the class ‘stop sign’,
and the following uncountable classes: ‘tree’, ‘road’,
‘sky’, and ‘building’, as shown in the stimuli view
of the interface in Figure 2a. In Figure 2, we show
three different visualizations available in our tool for
the data of six participants. The scarf plot in Fig-
ure 2a reveals the timeline of the SAOIs focused on by
each participant during the three seconds free-viewing
sequence. From the scarf plot, it is possible to no-
tice the difference in the scanpaths between partici-
pants. For example, the fixations of the last partici-
pant (‘zb’) focused more on the ‘car’ SAOIs, shifting
attention between car instances, while participant ‘po’
looked longer at the vegetation (‘tree’ SAOI). This
can also be observed from the two transition graphs
(Figures 2b and 2c). Looking at the color-coded cir-
cles, the SAOI with longer fixation duration is easily
identified as the ‘tree’ SAOI for participant ‘po’. The
focus of participant ‘zb’ on the car SAOIs is also de-
picted by the related transition lines in contrast for
example to participant ‘kae’ that shows more diverse
transitions between SAOIs related to cars, trees, and
buildings. Comparing the two transition graphs, the
SAOI radial transition graph in Figure 2b looks more
compact but the clarity of the transition lines connect-
ing adjacent radial sectors might be impaired. This is-
sue is not present in the SAOI mirror radial transition
graph in Figure 2c since all transition lines start from
a sector on the left and reach one on the right.
The video example from the Eye Tracking Bench-
mark dataset is a 19 seconds video of a dialog scene
between two people. We run the panoptic segmen-
tation with a confidence threshold of 0.9. The algo-
rithm extracted the correct SAOI classes with a few
exceptions of some last frames for which it wrongly
classified the wall as e.g. ‘sky’ or ‘snow’. This might
be due to the simplicity of the scene and the lack of
additional context. Moreover, the algorithm did not
properly track the person on the right for the first two
frames during the moment he enters the room, asso-
ciating two different instance labels, ‘person2’ and
‘person3’, to the same person. The incorrect classes
can be easily identified being at the bottom of the list
which is ordered by percentage of the occupied area,
from higher to lower percentage. Hence, SAOIs at
the bottom of the list can be deselected and not taken
into consideration for the analysis through the visu-
alizations. The scarf plot of six participants of the
dialog video is shown in Figure 1a together with the
interface of the tool. Due to page restrictions, Fig-
ures 1b-1f show the other available visualizations for
only two participants, P2B and P14B, to assure a suf-
ficient level of readability. Analyzing the SAOI ra-
dial and mirror radial transition graphs in Figures 1e
and 1f, we can see different approaches between the
two participants; while P2B has the focus evenly dis-
tributed between the two people of the video stim-
uli, P14B has more fixations on ‘person1’; moreover,
P14B presents more transition lines. The same in-
formation could be gathered by analyzing the other
visualizations one at a time, i.e. the fixation dura-
tion bar chart and the transition matrix, while the two
radial transition graphs provide it in a single visual-
ization. Moreover, the SAOI radial and mirror radial
transition graphs also encode the size of the area of
the SAOIs. This can be useful for the semantic anal-
ysis in case we want to compare the results between
different SAOIs of the same class, e.g. ‘car4’ is much
smaller than ‘car1’, hence we could consider normal-
izing the fixation data in this case (Holmqvist et al.,
2015). Another case for which it could be useful to
normalize the fixation data across SAOIs is when we
compare different stimuli of the same scene, e.g. ego-
centric video from different participants using head-
mounted devices.
5 DISCUSSION AND FUTURE
WORK
The visual analytics made possible by this holistic
semantic approach can be a useful and convenient
method for an initial semantic analysis of the data
when no other AOIs are defined yet. However, it is
important to highlight that the methods relying on au-
tomatic semantic segmentation have to deal with pos-
sible errors in the classification. Even if the accuracy
of the latest deep learning approaches is very high it
needs to be considered when we build a visualization
analysis upon these techniques. For image and short
video stimuli, a visual check of the semantic segmen-
tation can be enough; however, for longer video stim-
uli this needs to be handled in a different way ,for
example, by statistical filtering of the SAOIs outliers.
Panoptic segmentation provides the most compre-
hensive and distinctive type of segmentation and, at
the same time, it is easy to convert its output in a
more generic semantic segmentation by unifying all
instances of the same class. This can be useful in
long video stimuli or very complex image stimuli for
which the differentiation of instances of a class might
IVAPP 2022 - 13th International Conference on Information Visualization Theory and Applications
176

result in the extraction of too many distinct SAOIs.
A limitation of the current implementation is that,
in the case of video stimuli, we rely on the simple
instance tracking available on Detectron2. Hence, in
the case of dynamic SAOIs heavily overlapping with
each other during the video we can lose track of the
instances. Some recent works on video panoptic seg-
mentation, e.g. (Kim et al., 2020) address this issue
and we are planning to adopt similar solutions in our
tool. At the present time, the use of deep learning ap-
proaches on a specific scenario requiring the training
of the model might still be an obstacle due to the re-
quired large size of the training dataset. However, the
advantages of this technique are numerous especially
in the analysis of dynamic stimuli distinct among par-
ticipants, such as head-mounted eye tracking data. In
the case of natural stimuli covered by a large and re-
liable dataset such as MS COCO, the use of the pre-
trained models available online allows a valid analysis
if combined with the possibility to visually check and
filter the segmentation output.
Regarding the proposed SAOI radial and mir-
ror radial transition graphs, we plan to analyze their
efficacy through a user study and to compare the
two techniques. As future work, we also plan to
explore the integration of more complex visualiza-
tion techniques that handle for example hierarchical
AOIs (Blascheck et al., 2016) by considering inter-
class relationships between semantic classes. This
would allow a multi-layer analysis of the SAOIs giv-
ing the possibility to the analyst to choose the gran-
ularity of the data. Another factor to consider is the
scalability of the number of SAOIs processed by the
tool. Since the SAOIs are color-coded, their total
number needs to be limited to guarantee distinguisha-
bility between SAOIs both in the stimuli view and the
visualization view.
6 CONCLUSIONS
We present an initial investigation on using panop-
tic segmentation for automatic extraction of seman-
tic AOIs as a support for the analysis of eye track-
ing data through visualizations. Our visual analytics
tool processes an image or a video dividing the entire
stimulus on semantic AOIs and provides a set of AOI
visualizations adapted to semantic AOIs. We propose
a novel AOI visualization based on radial transition
graphs. We show the capabilities of our tool by ana-
lyzing two application examples with data taken from
online datasets. We plan to expand the analysis of our
tool with further user evaluations and the implemen-
tation of other AOI-based visualization techniques.
ACKNOWLEDGEMENTS
This work was supported in part by KK-stiftelsen
Sweden, through the ViaTecH Synergy Project (con-
tract 20170056).
REFERENCES
Barz, M. and Sonntag, D. (2021). Automatic visual at-
tention detection for mobile eye tracking using pre-
trained computer vision models and human gaze. Sen-
sors, 21(12).
Blascheck, T., Kurzhals, K., Raschke, M., Burch, M.,
Weiskopf, D., and Ertl, T. (2017a). Visualization of
eye tracking data: A taxonomy and survey. Computer
Graphics Forum, 36(8):260–284.
Blascheck, T., Kurzhals, K., Raschke, M., Strohmaier, S.,
Weiskopf, D., and Ertl, T. (2016). Aoi hierarchies for
visual exploration of fixation sequences. ETRA ’16,
page 111–118, New York, NY, USA. Association for
Computing Machinery.
Blascheck, T., Raschke, M., and Ertl, T. (2013). Circular
heat map transition diagram. ETSA ’13, page 58–61,
New York, NY, USA. Association for Computing Ma-
chinery.
Blascheck, T., Schweizer, M., Beck, F., and Ertl, T. (2017b).
Visual comparison of eye movement patterns. Com-
puter Graphics Forum, 36(3):87–97.
Borji, A. and Itti, L. (2013). State-of-the-art in visual atten-
tion modeling. IEEE Transactions on Pattern Analysis
and Machine Intelligence, 35(1):185–207.
Burch, M., Kull, A., and Weiskopf, D. (2013). Aoi rivers for
visualizing dynamic eye gaze frequencies. Computer
Graphics Forum, 32(3pt3):281–290.
Chen, L.-C., Papandreou, G., Kokkinos, I., Murphy, K.,
and Yuille, A. L. (2018a). Deeplab: Semantic im-
age segmentation with deep convolutional nets, atrous
convolution, and fully connected crfs. IEEE Trans-
actions on Pattern Analysis and Machine Intelligence,
40(4):834–848.
Chen, L.-C., Zhu, Y., Papandreou, G., Schroff, F., and
Adam, H. (2018b). Encoder-decoder with atrous sep-
arable convolution for semantic image segmentation.
In Proceedings of the European Conference on Com-
puter Vision (ECCV).
Fuhl, W., Kuebler, T., Brinkmann, H., Rosenberg, R.,
Rosenstiel, W., and Kasneci, E. (2018a). Region of
interest generation algorithms for eye tracking data.
ETVIS ’18, New York, NY, USA. Association for
Computing Machinery.
Fuhl, W., Kuebler, T., Santini, T., and Kasneci, E. (2018b).
Automatic Generation of Saliency-based Areas of
Interest for the Visualization and Analysis of Eye-
tracking Data. In Beck, F., Dachsbacher, C., and
Sadlo, F., editors, Vision, Modeling and Visualization.
The Eurographics Association.
Goldberg, J. H. and Kotval, X. P. (1999). Computer inter-
face evaluation using eye movements: methods and
Panoptic Visual Analytics of Eye Tracking Data
177

constructs. International Journal of Industrial Er-
gonomics, 24(6):631–645.
He, K., Gkioxari, G., Doll
´
ar, P., and Girshick, R. (2017).
Mask r-cnn. In 2017 IEEE International Conference
on Computer Vision (ICCV), pages 2980–2988.
Holmqvist, K., Nystr
¨
om, M., Andersson, R., Dewhurst, R.,
Jarodzka, H., and van de Weijer, J. (2015). Eye track-
ing: a comprehensive guide to methods and measures.
Oxford University Press.
Hunter, J. D. (2007). Matplotlib: A 2d graphics environ-
ment. Computing in Science & Engineering, 9(3):90–
95.
Irimia, A., Chambers, M. C., Torgerson, C. M., and Van
Horn, J. D. (2012). Circular representation of hu-
man cortical networks for subject and population-level
connectomic visualization. NeuroImage, 60(2):1340–
1351.
Judd, T., Ehinger, K., Durand, F., and Torralba, A. (2009).
Learning to predict where humans look. In 2009 IEEE
12th International Conference on Computer Vision,
pages 2106–2113.
Kim, D., Woo, S., Lee, J.-Y., and Kweon, I. S. (2020).
Video panoptic segmentation. In 2020 IEEE/CVF
Conference on Computer Vision and Pattern Recog-
nition (CVPR), pages 9856–9865.
Kirillov, A., Girshick, R., He, K., and Doll
´
ar, P.
(2019a). Panoptic feature pyramid networks. In 2019
IEEE/CVF Conference on Computer Vision and Pat-
tern Recognition (CVPR), pages 6392–6401.
Kirillov, A., He, K., Girshick, R., Rother, C., and Doll
´
ar, P.
(2019b). Panoptic segmentation. In 2019 IEEE/CVF
Conference on Computer Vision and Pattern Recogni-
tion (CVPR), pages 9396–9405.
Kurzhals, K., Bopp, C. F., B
¨
assler, J., Ebinger, F., and
Weiskopf, D. (2014). Benchmark data for evaluating
visualization and analysis techniques for eye tracking
for video stimuli. In Proceedings of the Fifth Work-
shop on Beyond Time and Errors: Novel Evaluation
Methods for Visualization, BELIV ’14, page 54–60,
New York, NY, USA. Association for Computing Ma-
chinery.
Kurzhals, K. and Weiskopf, D. (2013). Space-time vi-
sual analytics of eye-tracking data for dynamic stim-
uli. IEEE Transactions on Visualization and Com-
puter Graphics, 19(12):2129–2138.
Kurzhals, K. and Weiskopf, D. (2015). Aoi transition trees.
In Proceedings of the 41st Graphics Interface Confer-
ence, GI ’15, page 41–48, CAN. Canadian Informa-
tion Processing Society.
Lin, T.-Y., Maire, M., Belongie, S., Hays, J., Perona, P., Ra-
manan, D., Doll
´
ar, P., and Zitnick, C. L. (2014). Mi-
crosoft coco: Common objects in context. In Fleet,
D., Pajdla, T., Schiele, B., and Tuytelaars, T., edi-
tors, Computer Vision – ECCV 2014, pages 740–755,
Cham. Springer International Publishing.
Panetta, K., Wan, Q., Rajeev, S., Kaszowska, A., Gardony,
A. L., Naranjo, K., Taylor, H. A., and Agaian, S.
(2020). Iseecolor: Method for advanced visual ana-
lytics of eye tracking data. IEEE Access, 8:52278–
52287.
Paszke, A., Gross, S., Massa, F., Lerer, A., Bradbury, J.,
Chanan, G., Killeen, T., Lin, Z., Gimelshein, N.,
Antiga, L., Desmaison, A., Kopf, A., , E., DeVito,
Z., Raison, M., Tejani, A., Chilamkurthy, S., Steiner,
B., Fang, L., Bai, J., and Chintala, S. (2019). Pytorch:
An imperative style, high-performance deep learning
library. In Advances in Neural Information Process-
ing Systems 32, pages 8024–8035. Curran Associates,
Inc.
Privitera, C. and Stark, L. (2000). Algorithms for defining
visual regions-of-interest: comparison with eye fixa-
tions. IEEE Transactions on Pattern Analysis and Ma-
chine Intelligence, 22(9):970–982.
Raschke, M., Chen, X., and Ertl, T. (2012). Parallel scan-
path visualization. In Proceedings of the Symposium
on Eye Tracking Research and Applications, ETRA
’12, page 165–168, New York, NY, USA. Association
for Computing Machinery.
Richardson, D. C. and Dale, R. (2005). Looking to under-
stand: The coupling between speakers’ and listeners’
eye movements and its relationship to discourse com-
prehension. Cognitive Science, 29(6):1045–1060.
Santella, A. and DeCarlo, D. (2004). Robust clustering of
eye movement recordings for quantification of visual
interest. In Proceedings of the 2004 Symposium on
Eye Tracking Research & Applications, ETRA ’04,
page 27–34, New York, NY, USA. Association for
Computing Machinery.
Shelhamer, E., Long, J., and Darrell, T. (2017). Fully con-
volutional networks for semantic segmentation. IEEE
Transactions on Pattern Analysis and Machine Intel-
ligence, 39(4):640–651.
Tighe, J., Niethammer, M., and Lazebnik, S. (2014). Scene
parsing with object instances and occlusion ordering.
In 2014 IEEE Conference on Computer Vision and
Pattern Recognition, pages 3748–3755.
Tu, Z., Chen, X., Yuille, A. L., and Zhu, S.-C. (2005). Im-
age parsing: Unifying segmentation, detection, and
recognition. Int. J. Comput. Vision, 63(2):113–140.
Wolf, J., Hess, S., Bachmann, D., Lohmeyer, Q., and
Meboldt, M. (2018). Automating areas of interest
analysis in mobile eye tracking experiments based
on machine learning. Journal of Eye Movement Re-
search, 11(6).
Wu, Y., Kirillov, A., Massa, F., Lo, W.-Y., and Gir-
shick, R. (2019). Detectron2. https://github.com/
facebookresearch/detectron2.
Zanca, D., Serchi, V., Piu, P., Rosini, F., and Rufa, A.
(2018). Fixatons: A collection of human fixations
datasets and metrics for scanpath similarity.
Zhang, H., Dana, K., Shi, J., Zhang, Z., Wang, X., Tyagi,
A., and Agrawal, A. (2018). Context encoding for se-
mantic segmentation. In 2018 IEEE/CVF Conference
on Computer Vision and Pattern Recognition, pages
7151–7160.
IVAPP 2022 - 13th International Conference on Information Visualization Theory and Applications
178
