
Multi-Resolution Modeling of the Tufa Formation Dynamic using
Close-Range Photogrammetry, Handheld 3D Scanner and
Terrestrial Laser Scanner
Ivan Marić
a
, Lovre Panđa
b
and Rina Milošević
c
University of Zadar, Department of Geography, Trg Kneza Višeslava 9, 23000 Zadar, Croatia
Keywords: Tufa Formation Dynamic, Artec Eva, Faro Focus M70, Close-Range Photogrammetry, NP Krka.
Abstract: Advances in geospatial technologies (GST) have revolutionized the ability to quantify spatio-temporal
changes in various geomorphological forms at different scales. One of the most complex geomorphological
forms are tufa and travertine cascades whose evolution is the subject of numerous research in various scientific
fields. In this paper, we are presenting a new methodological framework for analyzing tufa formation dynamic
(TFD) at three levels of research (macro-meso-micro) using the close-range photogrammetry (CRP) method,
handheld 3D scanner, and terrestrial laser scanner (TLS). The results, 3D models and digital elevation models
(DEMs), of the first (reference) measurement at three levels of research, are presented in this paper. Reference
models were generated using Agisoft Metashape, Artec Studio Professional 15, and SCENE software.
Measurements were done in an artificial tufa tunnel, located within the Jaruga, the second oldest hydroelectric
power plant in the world constructed within National Park Krka, Croatia. This tunnel is a specific tufa-forming
environment. The subject of the next paper will be the comparison of interval tufa 3D tufa models at three
levels of research and the calculation of volumetric (mm
3
a
-1
) and linear (mm a
−1
) tufa growth rates after two
years of exposure to the Krka River. The presented methodological framework will expand the knowledge
about TFD within this specific depositional sub-environment and can be applied in the dynamic formation
analysis of other hydroprecipitates.
1 INTRODUCTION
Calcium carbonate (CaCO3) precipitation is a feature
of many freshwater systems. Various names for
hydroprecipitates formed by this process exist (Viles
and Goudie, 1990). The most often are (1) tufa and
(2) travertine (Bonacci et al., 2017) which can be
found worldwide (Viles and Pentecost, 2007).
Sometimes misinterpretation of these names occurs in
the literature, although there are clear differences
between them (Ford and Pedley, 1996; Capezzuoli,
2014; Bonacci et al., 2017). Travertine is by the most
authors associated with the precipitate sedimented in
warm and hot hydrothermal waters (Cukrov et al.,
2010), while the tufa is secondary carbonate
sedimented in freshwater at ambient temperature and
usually includes the remains of micro- and
a
https://orcid.org/0000-0002-9723-6778
b
https://orcid.org/0000-0003-4549-4481
c
https://orcid.org/0000-0002-5473-2579
macrophytes, invertebrates, and bacteria (Ford and
Pedley, 1996; Pedley, 2000; Capezzuoli, 2014,
Barešić et al., 2021). These hydroprecipitates
represent one of the most spectacular depositional
forms in karst landscapes (Šiljeg, et al., 2020) which
have universal aesthetic and scientific values and are
often included in the UNESCO World Heritage List.
Analysis of tufa and travertine formation
dynamics are oriented to quantification of the growth
and erosion rates which can be measured using
various direct and indirect methods (Marić et al,
2020a) and expressed using different units. Accurate
calculation of rates is important for several reasons
(Marić, et al. 2020b). Recent advances in data
acquisition sensors have revolutionized the ability to
quantify different spatial-temporal changes on a wide
range of scales. In the majority of TFD studies, very
large variability in rates was recorded as a result of
Mari
´
c, I., Pan
¯
da, L. and Miloševi
´
c, R.
Multi-Resolution Modeling of the Tufa Formation Dynamic using Close-Range Photogrammetry, Handheld 3D Scanner and Terrestrial Laser Scanner.
DOI: 10.5220/0010887000003185
In Proceedings of the 8th International Conference on Geographical Information Systems Theory, Applications and Management (GISTAM 2022), pages 75-82
ISBN: 978-989-758-571-5; ISSN: 2184-500X
Copyright
c
2022 by SCITEPRESS – Science and Technology Publications, Lda. All rights reserved
75
specific sedimentation conditions, their spatial
distribution along the water body, and selected
measurement method (Arenas et al., 2010, Arenas et
al., 2014, Auqué et al., 2014).
In this research, we are presenting a new
framework for monitoring the tufa formation
dynamic (TFD) using the modern active and passive
3D coordinate measuring devices at three levels of
research within the tufa tunnel. To demonstrate the
new framework in the Jaruga hydroelectric power
plant tunnel, located within National park (NP) Krka
was chosen. The TFD will be analyzed using close-
range photogrammetry (CRP) method - micro level,
handheld 3D scanner - meso level, and terrestrial laser
scanner (TLS) - macro level of research.
The basic objective of the research was to expand
knowledge about TFD within this specific
depositional environment and then compare it with
the results of other tufa-forming systems in the world.
A detailed overview of the TFD research is available
in Marić et al. (2020a). Furthermore, the objective is
to determine are there any differences in the TFD at
different levels of research using the above-
mentioned sensors. Also, since TFD will be analyzed
on an empty and smooth limestone plate (PL) and
rough substrate of the tunnel lateral walls, which is
composed of tufa, plant fragments, microorganisms,
and moss, it will be interesting to see whether the
growth and erosion rate will be similar. Namely, in
order for tufa formation to occur, in addition to
CaCO3 oversaturation, it is desirable that the water
contains a suitable substrate for calcite deposition.
They can be provided by organisms or organic
substances such as plant fragments and moss.
Therefore, one of the basic hypotheses of this and
future research is that the expected growth rate will
be higher on rougher surfaces (meso level of
research), ie on already formed tufa (tunnel lateral
wall).
Thus, it can be tested whether the tufa growth rate
determined on the lower level of research can be
extrapolated on the highest level of research. TLS was
used on a macro level of research with the aim of
examining the possibility of measuring TFD using
this type of sensor since such research has not yet
been done according to our knowledge.
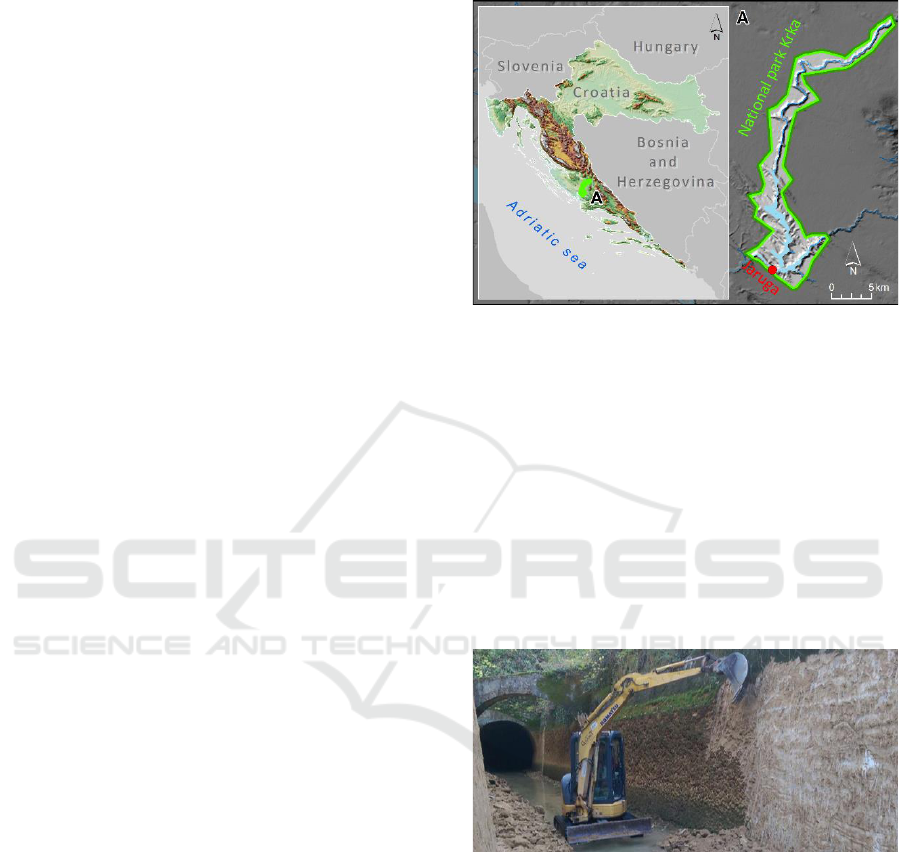
2 STUDY AREA
Hydroelectric power plant Jaruga is located on the
Krka River, in Šibenik-Knin County (Croatia). It is
the second oldest hydroelectric power plant in the
world and the first in Europe. It was built near the
waterfall Skradinski buk.
Figure 1: Location of Jaruga HE power plant in NP Krka.
The Jaruga system includes a separate supply
structure within the small closed part of the Krka in
the area of the Skradinski Buk waterfall. The supply
structure consists of a tufa tunnel (Figure 3A) with
gravity flow, a concrete channel with almost vertical
sides (Figure 3B) leading to the water tank, and two
water flow regulators leading to the turbines. The
length of the tufa tunnel is around 82.7 meters
(Holjevac and Kuzle, 2019). On these almost vertical
sides of the tunnel tufa is forming (Figure 3B) and
periodically removed, depending on the growth rate
(Figure 2).
Figure 2: Removal of the tufa formed on the lateral sides of
tunnel (URL 1).
Given the fact that during the year the flow rate
and water level in this tunnel are more or less constant
and that certain parts of the tunnel are completely in
the dark (Figure 3C), while other parts are constantly
exposed to light, it is obvious why this area is
recognized as an excellent depositional environment
for analyzing TFD using the advance active and
passive sensors at a different level of research.
GISTAM 2022 - 8th International Conference on Geographical Information Systems Theory, Applications and Management
76
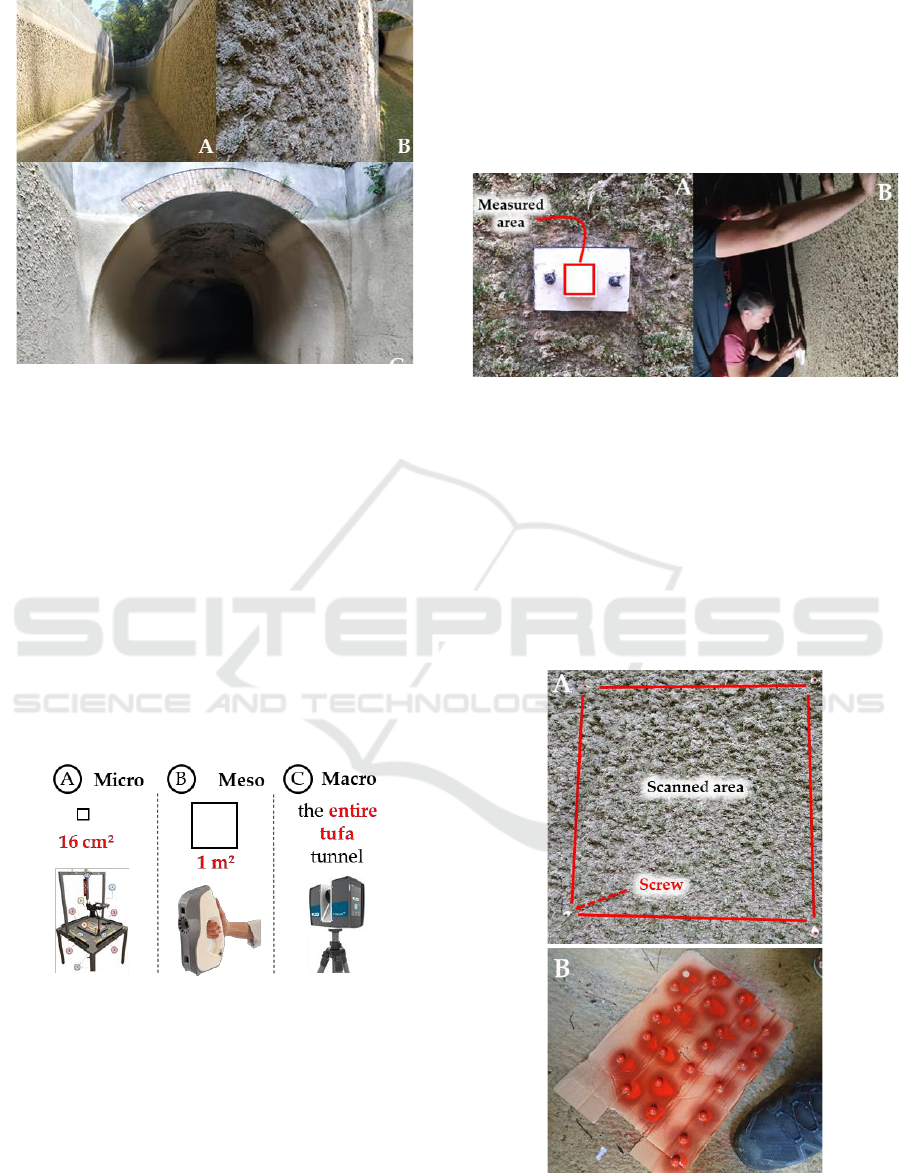
Figure 3: (A) Lateral sides of tufa tunnel; (B) formed tufa;
(C) parts of tunnel in dark.
3 MATERIALS AND METHODS
3.1 Data Acquisition
Data acquisition was done using (A) coordinate
measuring macro-photogrammetry device (CMD)
(Marić et al. 2020a) at micro-level of research; (B) 3D
hand-held scanner Artec Eva at meso level of
research; and (C) TLS Faro M70 at the macro level
of research. The water in the tunnel was stopped for
the conduction of the measurements which were all
made in one day.
Figure 4: Sensors used in three level of research at tufa
tunnel.
3.1.1 CMD: Micro Level
On the micro-level of research, the TFD was
monitored by CMD on an area of 16 cm
²
. The CMD
consists of six main parts and was designed by Marić
et al. (2020a). It minimizes the frequent problems that
occur in the CRP process and when using a modified
micro-erosion meter (Drysdale, Gillieson, 1997). The
area of 16 cm² represents the upper part of the
limestone plate (PL) mounted on the lateral sides of
the tufa tunnel (Figure 5A). A total of three PLs were
mounted, one in the always illuminated area, the
second in constant dark (Figure 5B), and the third at
location with interchangeable conditions. The PL
design is described in Marić et al. (2020a). PLs were
measured with CMD before installation.
Figure 5: (A) Limestone PL measured with CMD; (B)
instalation of PL on the lateral sides of tunnel in no-light
condition.
3.1.2 Artec Eva: Meso Level
Artec Eva was used at the meso level of research. It is
a lightweight and compact structured light 3D hand-
held scanner that uses triangulation and structured
light for data collection. Its 3D resolution is up to 0.5
mm at a distance of 40 cm to 1 m. The accuracy of the
3D is up to 0.1 mm (Marić et al., 2020b).
Figure 6: (A) Square surfaces scanned using Artec Eva; (B)
colored caps used as GCPs.
Multi-Resolution Modeling of the Tufa Formation Dynamic using Close-Range Photogrammetry, Handheld 3D Scanner and Terrestrial
Laser Scanner
77
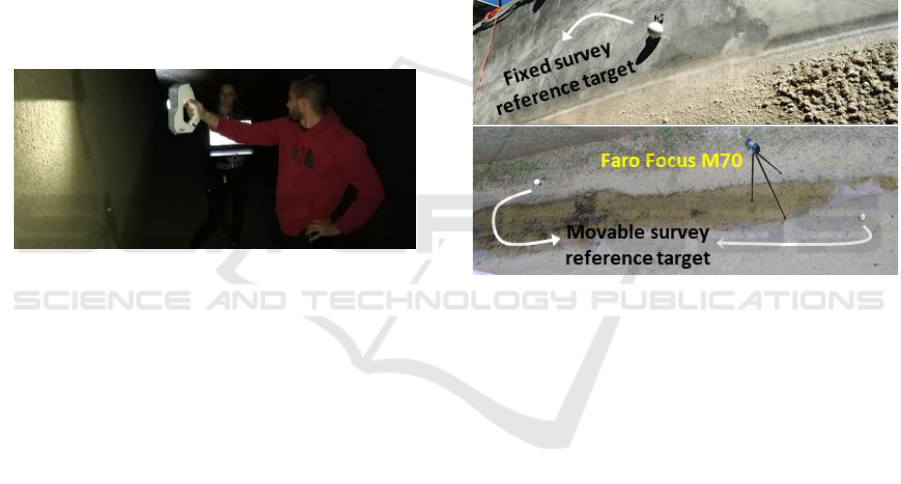
The TFD was monitored by Artec Eva on three
surfaces of around 1 m
2
. Three square surfaces were
marked and scanned on the lateral sides of the tunnel
(Figure 6A). The frame square surfaces were marked
with four screws that had colored caps (Figure 6B).
The screws were used as ground control points
(GCPs). Also, they were useful for the scanning
procedure. GCPs were necessary because the 3D
scanner axes (X, Y, Z) are relative to the scene being
scanned. Therefore, the GCPs eases the alignment of
the interval tufa 3D model enabling the interval
comparison of the formed tufa and quantification of
growth and erosion rates between interval models.
A distance adjustment indicator was used while
scanning marked test surfaces. Localization of Artec
Eva was achieved by moving it away or closer to
surfaces in order to get the best scanning quality
(Figure 7). The speed of scanning was around 13.5
fps. Scanning of the one test surface lasted around 3
minutes.
Figure 7: Scanning of test surface using Artec Eva.
3.1.3 Faro Focus M70: Macro Level
At the macro level of the research, terrestrial scanning
of the whole tufa tunnel on October 10, 2020, was
performed using a FARO Focus M70 laser scanner
(Figure 8). FARO Focus M70 is a phase laser 3D
scanner with a measuring range from 0.6 m to 70 m,
with a measuring accuracy of ± 3 mm. It collects
about 488,000 points per second and has a level of
protection against water and dust.
There were a total of nine scanning locations. The
total number of scans was determined with respect to
available survey time which was only one day. Within
that time, data acquisition had to be made at all three
levels of research. Ideally, the number of TLS
scanning locations can be higher. The optimal
positions for survey reference targets were identified
in the field following examples of good practice
(Domazetović et al., 2020). Survey reference targets
(spheres) were used for faster and easier registration
of the multiple scans. Spheres were set at a distance
of 15–20 meters to enable target registration. Since,
this type of research requires an interval comparison
of 3D tufa models on all three levels of research, four
targets (spheres) have been fixed on exact XYZ
location. The X, Y, and Z coordinates of spheres will
not differ between interval scanning. The XYZ
coordinates of the spheres were not measured using
GNSS receivers because in this type of research the
location of the tunnel or survey area within the global
coordinate system is not important. However, the
relative positional accuracy is very important, ie
overlapping of interval models. Therefore, all spheres
were fixed and their location will not change between
interval scanning.
The following scanning settings were set: 1/4
resolution (with a point distance of approximately 6
mm at 10 m distance) and 2× quality. Also, the HDR
texture was set. The scanning per one location took
6–7 min.
Figure 8: Terestrial laser scanning of tufa tunnel.
3.2 Data Processing
3.2.1 Micro Level Data Processing
At the micro-level of research image workflow
process (capturing + processing) was done following
the guidelines proposed by James et al. (2019). Image
capture was done using CMD which contained
system sensors NIKON D5300 and macro-lens Venus
LAOWA 60-mm f/2.8. Each PL was represented with
more than 180 overlapping (>80%) images. Initial
(reference) 3D tufa models and digital elevation
models (DEMs) were derived in Agisoft Metashape
1.5.1. The overall methodological process is shown in
Figure 9. Four GCS and four CP (checkpoint) were
used to georeference and assess the X, Y, and Z
accuracy of the models.
GISTAM 2022 - 8th International Conference on Geographical Information Systems Theory, Applications and Management
78
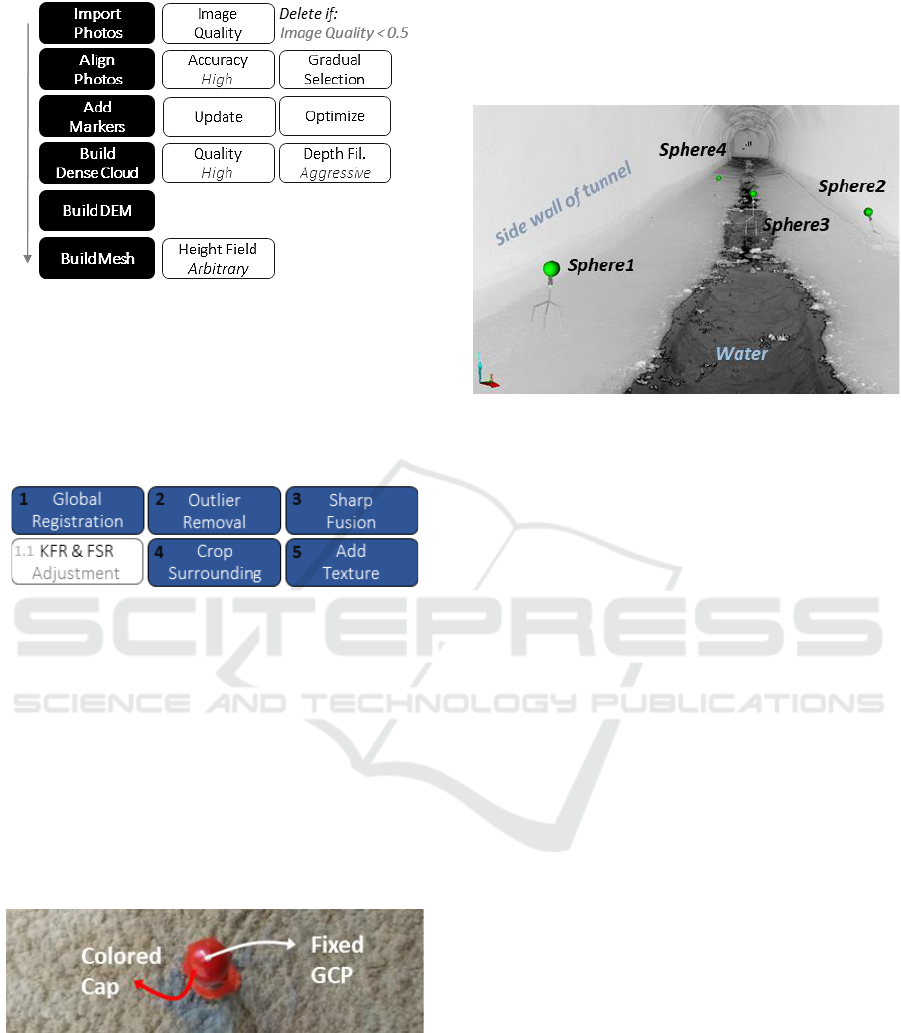
Figure 9: Image processing in Agisoft Metashape.
3.2.2 Meso Level Data Processing
At the meso level of research, scanned surfaces were
processed using Artec Studio 15 Professional,
software for professional 3D data processing. The
overall methodological process is given in Figure 10.
Figure 10: Data processing in Artec Studio 15 Professional.
After the second and subsequent scans, which will be
presented in future research, the data processing will
include the sixth step (alignment). It refers to the
placement of the interval 3D tufa models in the same
coordinate system. Align of interval models will be
done using the Rigid Align option. The center of the
colored caps mounted on top of the screws (Figure
11) will serve as fixed GCPs for each reconstructed
3D model. Then using the Measure option which
contains the Distance map and Section, volume, tufa
growth, and erosion rates will be measured.
Figure 11: Fixed GCP used in meso level of research.
3.2.3 Macro Level Data Processing
At the macro level of research collected 9 scans were
processed using FARO SCENE 2019 software. It was
used for scan registration and creation of dense point
cloud and polygonal model of whole scanned site
(tufa channel). Scan registration was done using
Target Based mode in the Automatic Registration
option. This setting causes SCENE to look only for
artificial targets (spheres) in scans. Figure 12 shows
recognized spheres at the eighth scan location.
Figure 12: Recognized spheres at eighth scan station.
4 RESULTS
This paper was conceived as an introduction to the
possibility of using different sensors in analyzing the
TFD and to expand knowledge about TFD through
various aspects mentioned in the introduction.
Therefore, the results section contains only the initial
models that will be used in further research. Namely,
numerical results comparisons between derived
models were not done because it requires another data
acquisition process at all three levels of research that
has not yet been carried out.
4.1 3D Tufa: Micro Level
3D tufa models at the micro-level of research were
created in Agisoft Metashape. Polygonal mesh
models of PLs were generated based on the
reconstructed dense point cloud. The Surface type
parameter was set to Arbitrary (3D). The Face count
parameter to "0" to skip the decimation stage so the
model has all the reconstructed faces. Based on this
reference and new interval 3D models which will be
recorded in the following periods (2-year interval),
volumetric (mm
3
a
-1
) TGRs will be calculated. Also,
DEMs of PLs were derived. Based on them and new
interval tufa DEMs linear TGRs (mm a
-1
) will be
calculated (Figure 13). Volumetric (mm
3
a
-1
) TGRs
will be calculated in Artec Studio 15 Professional
after two years of exposure PLs to water. Linear
TGRs (mm a
-1
) will be calculated in ArcMap
software.
Multi-Resolution Modeling of the Tufa Formation Dynamic using Close-Range Photogrammetry, Handheld 3D Scanner and Terrestrial
Laser Scanner
79
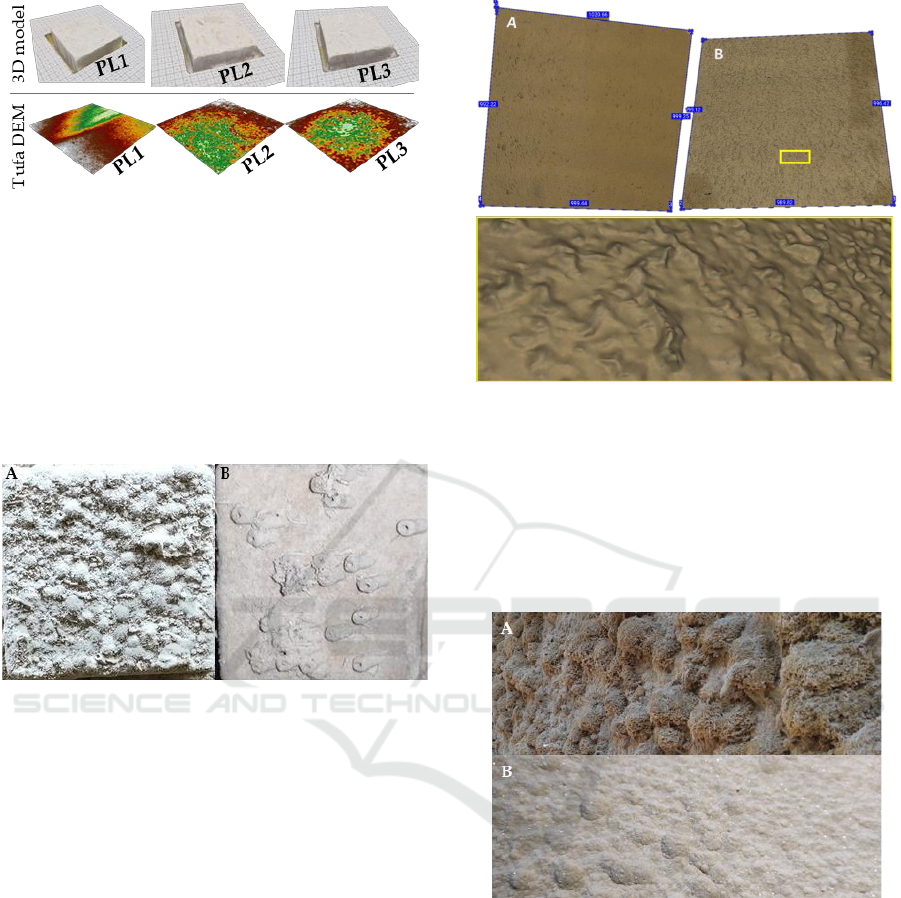
Figure 13: Derived reference 3D models and tufa DEMs on
micro level of research.
A field survey was done one year (October 2021)
after the PLs were mounted and a few interesting
things were spotted. Tufa-forming organisms of
tubular shape were observed on the PL which was
placed in complete darkness (Figure 14B). No
organisms were observed on the other PLs. We
visually estimated that the highest TGR was on the
PL that was most exposed to the light (Figure 14A).
Figure 14: (A) PL with highest increment after one-year;
(B) observed tufa-forming organisms.
4.2 3D Tufa: Meso Level
3D tufa models at meso level of research were created
in Artec Studio 15 Professional. Figure 15. shows
reconstructed models of two scanned surfaces (A and
B).
It will be very interesting to measure the erosion
of tufa in interval scanning periods. Namely, erosion
occurs mainly due to intensive flow due to increased
precipitation, dry periods during summer that leads to
drying and weakening the tufa structure, human
factor, measurement which coincides with the phase
of periphyton loss due to emigration or more
intensive grazing, etc. The PLs and test surfaces at the
micro and meso level of research are located at a
depth of a few meters while the water level and water
flow rate are constant, which is why no significant
erosion rates are expected. Also, it will be interesting
to see is there any difference in the erosion of tufa
located in constant darkness (inside the tunnel) for
two years and tufa exposed to light.
Figure 15: 3D model of two scanned surfaces in tufa tunnel.
One year after the scanning it was observed that the
tufa grew faster on the lateral walls which are more
exposed to the light and rich with moss (Figure 16A).
Also, differences in tufa hardness are obvious. The
tufa that forms in conditions of constant darkness is
much harder (Figure 16B), while the others are softer
and more porous.
Figure 16: (A) Test surface with highest increment; (B)
hard sedimented tufa inside the tunnel.
4.3 3D Tufa: Macro Level
At the macro-level of research, scans were registered
using manual registration mode. The mean horizontal
target error was 0.4 mm, while the mean vertical
target error was 2.0 mm. Registered scans were used
for the creation of dense point cloud (Figure 17). It
covered the entire area of the tufa tunnels' lateral
sides. After the two years of exposure to water TFD
on these lateral sides will be calculated using
CloudCompare software.
GISTAM 2022 - 8th International Conference on Geographical Information Systems Theory, Applications and Management
80
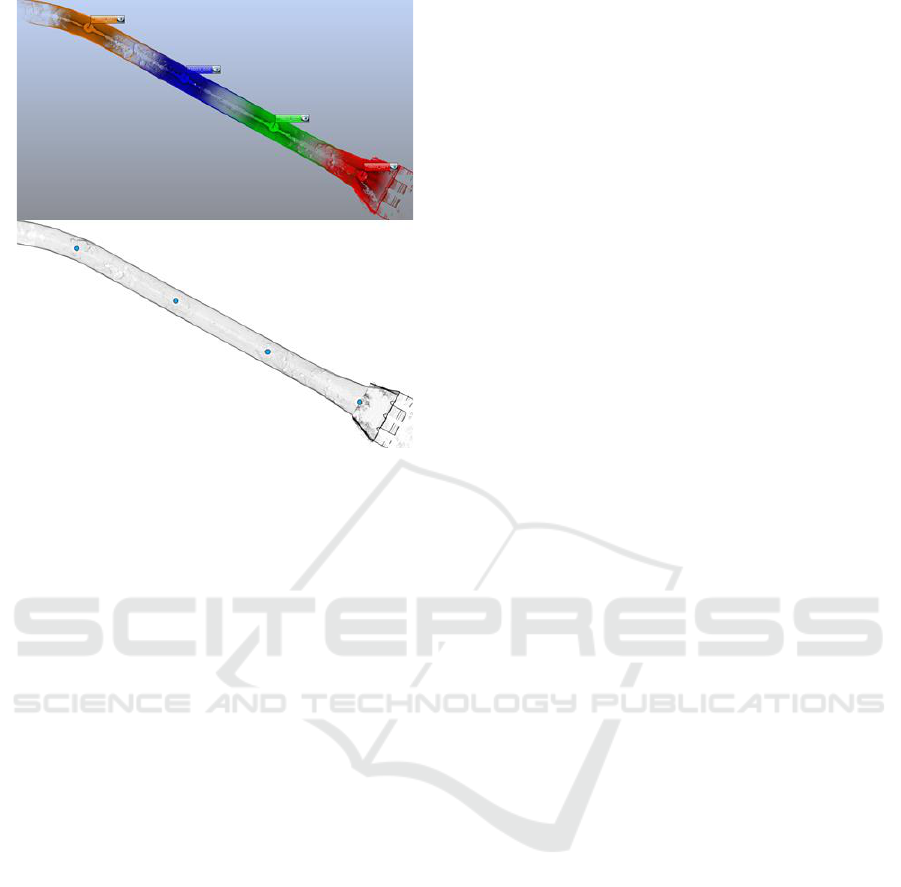
Figure 17: Point cloud of tufa tunnel section with four scan
location.
5 CONCLUSIONS
In this paper, we presented a new methodological
framework for analyzing (TFD) at three levels of
research using state-of-art active and passive sensors.
The 3D models of the first (reference)
measurement are presented fot three levels of
research. Although the next measurements will be
made in a year, interesting occurrences have already
been noticed. Tufa-forming organisms of tubular
shape were observed on the PL which was placed in
complete darkness. Furthermore, tufa grew faster on
the lateral walls which are more exposed to the light
and rich with moss than in the locations within
complete darkness and on smooth surfaces of PLs.
The subject of the next paper will be the
comparison of derived 3D models at all levels of
research and the calculation of the volumetric (mm
3
a
-1
) and linear (mm a
−1
) tufa growth rates. Also, in
future research, we are considering implementing a
hyperspectral camera at the micro and meso level of
research in order to analyze spectral reflection and
detect the plant fragments and macroinvertebrates
accumulated on the tufa surface.
ACKNOWLEDGEMENTS
This research was performed within the project UIP-
2017-05-2694 financially supported by the Croatian
Science Foundation. Authors would like to thank
administration of the NP Krka.
REFERENCES
Arenas, C., Vázquez‐Urbez, M., Auqué, L., Sancho, C.,
Osácar, C.,Pardo, G. (2014): Intrinsic and extrinsic
controls of spatial and temporal variations in modern
fluvial tufa sedimentation: A thirteen - year record from
a semi-arid environment, Sedimentology, 61(1), 90-132.
Arenas, C., Osácar, C., Sancho, C., Vázquez-Urbez, M.,
Auqué, L., Pardo, G. (2010). Seasonal record from
recent fluvial tufa deposits (Monasterio de Piedra, NE
Spain): sedimentological and stable isotope data,
Geological Society, London, Special Publications,
336(1), 119-142.
Auqué, L., Arenas, C., Osácar, C., Pardo, G., Sancho, C.,
Vázquez-Urbez, M. (2014). Current tufa sedimentation
in a changing-slope valley: the River Añamaza (Iberian
Range, NE Spain), Sedimentary Geology, 303, 26-48.
Barešić, J., Faivre, S., Sironić, A., Borković, D., Lovrenčić
Mikelić, I., Drysdale, R.N., Krajcar Bronić, I. (2021):
The potential of tufa as a tool for paleoenvironmental
research-a study of tufa from the Zrmanja river canyon,
Croatia, Geoscience, 11, 376.
Capezzuoli, E., Gandin, A., Pedley, M. (2014): Decoding
tufa and travertine (fresh water carbonates) in the
sedimentary record: the state of the art, Sedimentology,
61(1), 1-21.
Cukrov, N., Surić, M., Fuček, L., Ćosović, V., Korbar, T.,
Juračić, M. (2010). Geology of Krka River estuary, u:
Vodič ekskurzija–Excursion Guide-book (4. hrvatski
geološki kongres), Hrvatski geološki institut.
Bonacci, O., Roje-Bonacci, R., Andrić, I. (2017). Prilog
izučavanju hidrologije Skradinskog buka na rijeci Krki,
Hrvatske vode, 25(99), 27-36.
Domazetović, F., Šiljeg, A., Marić, I. (2020) Guidelines for
optimization of terrestrial laser scanning surveys over
gully erosion affected areas. In: Massimiliano Alvioli,
Ivan Marchesini, Laura Melelli & Peter Guth, eds.,
Proceedings of the Geomorphometry 2020 Conference,
220-223.
Drysdale, R., Gillieson, D. (1997). Micro‐erosion meter
measurements of travertine deposition rates: a case
study from Louie Creek, Northwest Queensland,
Australia. Earth Surface Processes and Landforms: The
Journal of the British Geomorphological Group,
22(11), 1037-1051.
Ford, T. D., Pedley, H. M. (1996). A review of tufa and
travertine deposits of the world, Earth-Science
Reviews, 41(3-4), 117-175.
Holjevac, N., Kuzle, I. (2019). Prvi cjeloviti višefazni
elektroenergetski sustav na svijetu–Krka Šibenik.
Annual of the Croatian Academy of Engineering,
2019(1), 162-174.
James, M. R., Chandler, J. H., Eltner, A., Fraser, C., Miller,
P. E., Mills, J. P., Noble, T., Robson, S., Lane, S. N.
(2019). Guidelines on the use of structure from motion
Multi-Resolution Modeling of the Tufa Formation Dynamic using Close-Range Photogrammetry, Handheld 3D Scanner and Terrestrial
Laser Scanner
81

photogrammetry in geomorphic research. Earth
Surface Processes and Landforms, 44(10), 2081-2084.
Marić, I., Šiljeg, A., Cukrov, N., Roland, V., Domazetović,
F. (2020a). How fast does tufa grow? Very high -
resolution measurement of the tufa growth rate on
artificial substrates by the development of a contactless
image-based modelling device. Earth Surface
Processes and Landforms, 45(10), 2331-2349.
Marić, I., Šiljeg, A., Domazetović, F., Cukrov, N. (2020b).
A framework for using handheld 3D surface scanners
in quantifying the volumetric tufa growth. In:
Massimiliano Alvioli, Ivan Marchesini, Laura Melelli
& Peter Guth, eds., Proceedings of the
Geomorphometry 2020 Conference, 18-21.
Pedley, M. (2000). Ambient temperature freshwater
microbial tufas. In Microbial sediments (pp. 179-186).
Springer, Berlin, Heidelberg.
Šiljeg, A., Marić, I., Cukrov, N., Domazetović, F., Roland,
V. (2020). A Multiscale Framework for Sustainable
Management of Tufa-Forming Watercourses: A Case
Study of National Park “Krka”, Croatia. Water, 12(11),
3096.
URL 1 http://st-gramit.com/projekti_jaruga.html, 6 June,
2021.
Viles, H. A., Goudie, A. S. (1990). Tufas, travertines and
allied carbonate deposits, Progress in Physical
Geography, 14(1), 19-41.
Viles, H., Pentecost, A. (2007). Tufa and travertine, in:
Geochemical Sediments and Landscapes, eds. D. J. Nash,
S. J. McLaren, Blackwell Publishing Ltd., 173-199.
GISTAM 2022 - 8th International Conference on Geographical Information Systems Theory, Applications and Management
82
