
Precision Assessment of Artec Space Spider 3D Handheld
Scanner for Quantifying Tufa Formation Dynamics on Small
Limestone Plates (PLs)
Ivan Marić
a
, Ante Šiljeg
b
and Fran Domazetović
c
University of Zadar, Department of geography, Trg kneza Višeslava 9, 23 000, Zadar, Croatia
Keywords: Artec Space Spider, Precision Assessment, Tufa Formation Dynamics.
Abstract: In this paper precision assessment of the 3D handheld scanner Artec Space Spider was evaluated and critically
observed. Namely, a new application of handheld 3D scanners has been found in quantifying tufa formation
dynamic (TFD). Such measurements should be characterized by a high level of data quality because tufa
usually grows only a few millimeters annually. Therefore, a small limestone plate (PL) used as a substrate on
which TFD will be studied was scanned five times by two independent observers. Interval scans of PL were
processed using Artec Studio 15 Professional. Data processing consisted of five steps. The precision
assessment was determined by statistical analysis of derived sections and colored distance map (CDM).
Results showed that Artec Space Spider generates reliable results considering the characteristics of the
scanned object and it certainly can be used for TFD analysis. Also, results suggested that the application of
Artec Space Spider in the quantification of TFD can be regarded as a better approach in the context of
measurement reliability compared to other direct and indirect methods. The subject of future research will be
the precision and accuracy assessment of various 3D handheld scanners in scanning tufa formed in different
temporal resolutions with various surface complexity.
1 INTRODUCTION
Artec Space Spider is a non-contact active 3D
handheld scanner produced by Artec 3D. This 3D
scanner emits a pattern of structured light (SL) to the
observed object or scene and measures its
deformation (Abdel, 2011). It enables robust high-
quality capture of 3D geometry and can be actively
used throughout several fields (Eiríksson et al., 2016,
pp, 1). Data in this type of scanner is acquired in
relation to the internal coordinate system. Therefore
the position of the scanner must be determined using
specific reference features on the scanned surface
(Abdel, 2011).
Artec Space Spider is an ultra-high-resolution 3D
scanner intended for precisely capturing small objects
and complex details with accuracy up to 0.05 mm
(Artec 3D, 2020) and high resolution (Table 1). Due
to its superior precision, long-term repeatability in
a
https://orcid.org/0000-0002-9723-6778
b
https://orcid.org/0000-0001-6332-174X
c
https://orcid.org/0000-0003-3920-6703
data capture, and automatic temperature stabilization
it has been regarded as an excellent solution for
metrology applications (Motley, 2020). It combines
structured light 3D scanning (blue LED) with an
image-based approach (Reichert et al., 2016).
Table 1: Specifications of the Artec Space Spider.
Specifications
Artec Space Spider
3D point accuracy
1
0.05 mm
3D resolution
2
0.1 mm
3D accuracy over distance
0.05 + 0.3 mm/m
Working distance
0.2 – 0.3 m
Volume capture zone
2 000 cm³
Angular field of view (H*W)
30 × 21°
Texture
Yes
Texture resolution
1.3 mp
3D reconstruction rate
7.5 fps
Data acquistion speed
1 mln points/s
3D light source
Blue LED
2D light source
White 6 LED
Mari
´
c, I., Šiljeg, A. and Domazetovi
´
c, F.
Precision Assessment of Artec Space Spider 3D Handheld Scanner for Quantifying Tufa Formation Dynamics on Small Limestone Plates (PLs).
DOI: 10.5220/0010886900003185
In Proceedings of the 8th International Conference on Geographical Information Systems Theory, Applications and Management (GISTAM 2022), pages 67-74
ISBN: 978-989-758-571-5; ISSN: 2184-500X
Copyright
c
2022 by SCITEPRESS – Science and Technology Publications, Lda. All rights reserved
67

Datasets collected using the 3D handheld
scanners, intended for specific applications, should
meet certain specifications and provide the officially
stated data quality standards (Georgopoulos et al.,
2010, Abdel, 2011). Data quality represents the
ability of a given dataset to satisfy the set objective
(Campbell, Shin 2011). However, there is no general
agreement on which set of dimensions defines the
quality of data (Batini et al 2009, pp 6.). This term
generally covers two primary attributes of accuracy
and precision. It should be noted that not enough
focus has been placed on precision analysis and
quantitative accuracy of SL systems (Eiríksson et al.,
2016, Campanelli et al., 2016).
Precision, or “repeatability” of measurement, can
be defined as the internal accuracy of a device that is
determined through repeated measurements under
equal conditions (Hofer et al., 2005). Accuracy,
which has several definitions (Batini et al 2009, pp 7),
can be defined as the “nearness” of measurement to
an actual or “real” value (Campbell, Shin 2011).
Analyzing the data quality of the 3D handheld (SL)
scanner is a challenging task, which has only seen few
published standards and guidelines (Eiríksson et al.,
2016). Sometimes, data quality specifications given
by device producers should be taken with caution
because these values vary from instrument to
instrument and depend on the user's expertise and
individual calibration (Abdel, 2011). Furthermore, it
is not uncommon that in the official pamphlets of
specific devices measured precision (formal error) is
presented as accuracy (Santos et al., 2000).
Due to the high-resolution digital capture of
scenes or objects at submillimeter levels of accuracy,
and reduced time of data acquisition, Artec Space
Spider and similar scanners have been used in a wide
range of scientific fields and other activities from
reverse engineering processes and product design
(Allegra et al., 2016, Artec 3D, 2020), healthcare
industry (Allegra et al., 2016, Koban et al. 2016,
Modabber et al., 2016, Seminati et al., 2017, Verhulst
et al., 2018, Dessery, Pallari, 2018, Ritschl et al.,
2019, Özsoy et al., 2019, Varga et al., 2019, Artec 3D,
2020, Winkler, Gkantidis, 2020), forensics
(Sivanandan, Liscio, 2017, Buck et al., 2018, Zhang
et al., 2020), video game industry (Artec 3D, 2020),
soil erosion process (Wang et al., 2019), heritage and
cultural preservation (Allegra et al., 2016, Artec 3D,
2020), etc. Recently, a new potential application of
handheld 3D scanners has been found in quantifying
tufa formation dynamic (TFD) (Marić et al., 2020) on
small limestone plates (PLs). However, this research
requires the performance of interval PL scanning
within a specific local coordinate system (LCS) in
order to quantify and analyze spatio-temporal
changes at the specific location of the PL surface
(Marić, et al., 2021). Such measurements should be
characterized by a high level of data quality because
tufa usually grows and erodes, in most cases, only a
few millimeters a year (Marić et al., 2020). Therefore,
the main objective of this paper was to assess the
precision of the Artec Space Spider 3D handheld
scanner in quantifying TFD on small limestone PLs.
The analysis is conducted on an artificial limestone
plate (PL) that lacks tufa formation on its surface.
This was done because (1) in most studies similar
substrates (specific PLs) are used; (2) if you want to
study TFD using a 3D scanner, then it is necessary to
scan an empty PL because it represents the initial
(reference) model; (3) these type of object (without
formed tufa), represents the most difficult case for
scanning because they have very small dimension and
lacks distinctive features and color. Therefore, we
wanted to test the worst possible scenario, in which,
in one year of studying TFD only a tenth of a
millimeter of tufa growth occurs, or tufa growth does
not occur at all.
The precision assessment was done using the two
approaches; (a) colored distance maps and (b) defined
metrics from multiple (n=5) sections of the PLs.
The scope of this research can be interesting to the
researchers who use similar 3D handheld scanners to
model small objects whose properties make them
difficult to scan. However, the results of the paper are
primarily intended for the scientists whose primary
scientific interest is TFD and are considering using
3D handheld scanners and similar PLs design for
monitoring the tufa growth and erosion.
The paper was organized in the following
chapters. First, the Introduction describes in detail the
handheld 3D scanner and its applications. The
possible application in the studying of TFD is
mentioned. In order to determine its applicability in
this type of research, it was decided to determine its
precision given that the 3D point accuracy is stated in
the official specifications. The Material and Method
chapter describes in detail the data processing
workflow which consisted of several steps. In the
Results and discussion, the derived results of
precision from two used approaches are presented.
Then, in the Conclusion, the main findings of this
research were highlighted, and the consideration for
future research is given.
GISTAM 2022 - 8th International Conference on Geographical Information Systems Theory, Applications and Management
68
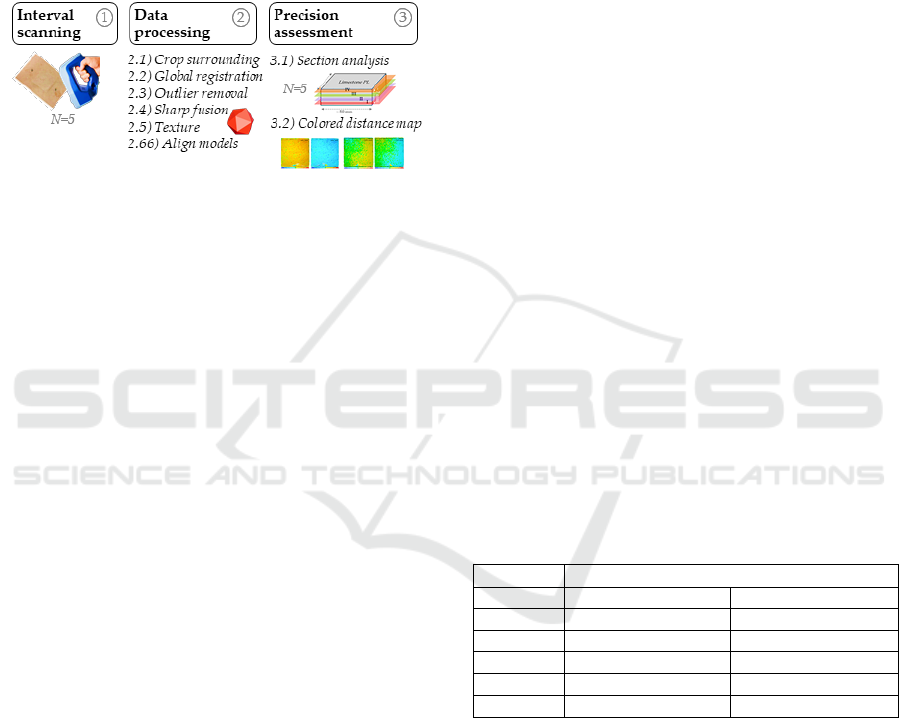
2 MATERIALS AND METHODS
The research methodology consisted of several steps
that included: (1) interval (n=5) scanning of the
selected PL before its immersion in the tufa-forming
watercourse; (2) processing of the acquired scans,
which consisted of several sub-steps that were unified
for all interval scans; and (3) a precision assessment
using two stated approaches (Figure 1).
Figure 1: Simplified methodological framework.
2.1 Scanning Procedure
In order to assess the precision of the Artec Space
Spider interval scanning of a specific limestone PL
(area ≈ 25 cm²) was conducted. This type of object is
the most challenging for scanning when optical 3D
scanners are used. Namely, 3D scanners rely on an
object’s unique geometry and in this case PL lacks
distinctive characteristics such as texture, features,
and color. However, this type of PL is often used in
TFD studies.
Scanning was done in an environment of constant
light exposure. The same PL was five times scanned
with Artec Space Spider by two independent
observers, each on two separate occasions. On the
surface of the PL there was no sedimented tufa
because the data quality assessment needs to be
determined on the smallest scanned surface within the
TFD research (initial model). This refers to the first
measurement, i.e reference state of the PL before it
was mounted in tufa forming watercourses. PL was
set on the created local coordinate system (LCS) and
then measured interval, five times with Artec Space
Spider. The LCS was used because the 3D scanner
axis (X, Y, Z) is relative to the scene being scanned.
Therefore, the LCS eases the adjustment of the 3D
model position onto one of the coordinate planes.
Each scanning took around 10-15 seconds. Distance
adjustment indicator in the Artec Studio 15
Professional was used to determine the ideal scan
distance. True localization was adjusted by either
moving 3D handheld scanners farther away or closer
to get the best possible quality of the scan. The
scanning was performed at a speed of around 6-7
frames per second (fps).
2.2 Data Processing
Scans of interval measured PL were processed using
Artec Studio 15 Professional, an industry-acclaimed
software package for advanced 3D scanning and data
processing. Geometry + Texture scanning mode was
used. Segmentation of the scans did not occur during
scanning. Data processing consisted of five steps.
First, (1) crop surrounding, with rectangular selection
tool was used, to delete unnecessary scanned area
around the PL. Then, using the (2) global registration
(GR) option frame positions across all scans were
optimized preparing them for further processing. It
converts all one-frame surfaces to a single coordinate
system using the information on the mutual position
of each surface pair (URL 1). Prior to the conduction
of the GR, user-defined parameters (key frame ratio -
KFR and feature search radius - FSR) were changed.
KFR was set on 1 and FSR was set on 3 mm. KFR
determines how many surfaces are treated as key
frames. A higher value than 0.7 can significantly slow
down the algorithm. The value of FSR was slightly
lowered in relation to the default value because a
small object with similar features was scanned. In
each scanning frame registration quality was
improved after GR (Table 2). After the GR, the
maximum error values decreased to a good
classification result (URL1).
Table 2: Maximum error values
1
for interval measurements
after the GR.
Scan ID
Artec Space Spider
Before GR
After GR
01
0.1
0.1
02
0.2
0.1
03
0.1
0.1
04
0.2
0.1
05
0.2
0.1
1
Error is the parameter that reflects frame registration quality. For
scans, it shows the maximum value among all the frames. The
larger the value, the less accurate the alignment (URL 1).
After the GR, large outliers and some noise were
deleted with (3) outlier removal tool. Outliers can
introduce additional errors in the model or produce
unwanted fragments. This approach for every surface
point calculates the mean distances between it and a
certain number of neighboring points, as well as the
standard deviation of these distances. If the mean
distances are greater than an interval defined by the
global-distances mean and standard deviation then
the point is recognized as an outlier and deleted. A
Precision Assessment of Artec Space Spider 3D Handheld Scanner for Quantifying Tufa Formation Dynamics on Small Limestone Plates
(PLs)
69
unique model surface was created using a (4) sharp
fusion tool. This creates a polygonal 3D model by
solidifying the processed captured and frames. Mode
sharp fusion was used because it perfectly
reconstructs fine features. Option simplify mesh was
not used because it decreases the number of polygons.
Then (5) texture was projected from the individual
frames onto the fused mesh. Finally (6), each derived
mesh model (n=5) was aligned according to the
created LCS by using the rigid align option and four
markers placed at the same location within LCS.
2.3 Precision Assessment
2.3.1 Section Analysis
Precision assessment of Artec Space Spider was
calculated using two approaches following examples
in literature (Patel et al., 2015, Reichert et al., 2016,
Varga et al., 2019, Seminati et al., 2017, Ozsoy et al.,
2019).
In the first approach, from derived models (n=5)
specific metrics were calculated from multiple (n=5)
sections placed at an interval of 1.5 mm across the PL
height (Z-axis). This is one of the measurement tools
included in Artec Studio. A section is the plane that
splits the model or scans into parts. Once the sections
are created, the panel displays its geometrical data.
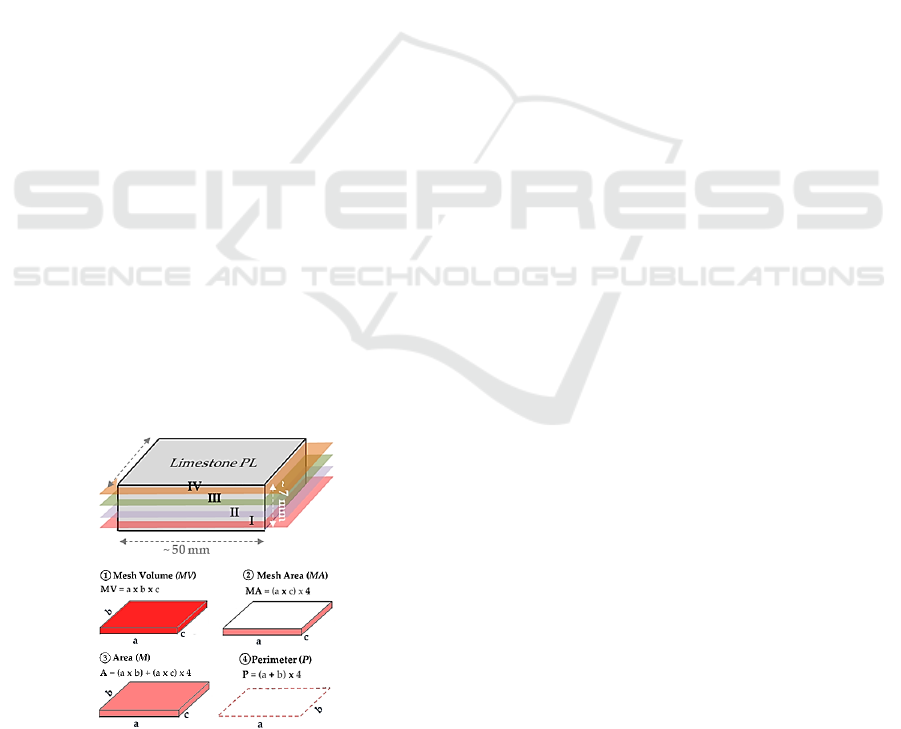
The following metrics were used: MeshVolume
(MV), MeshArea (MA), Area (M), and Perimeter (P)
(Figure 2). These metrics Artec Studio automatically
generates and assigns them the listed acronyms.
These names have not changed. MA is called
MeshArea but it represents the area of the outer edge
of a plate. M (Area) is actually, the surface area of the
plate that includes the top and the outer edges (not the
bottom).
Figure 2: Schematic representation of derived metrics.
First, the average value of defined metrics for
each section was calculated which represented the
most probable (reference) value. Especially, total MV
(sum of MV sections) was calculated for each
measurement. Then, the absolute deviation (AD) and
percent deviation (PD) of the remaining metrics for
each section were derived. Finally, the precision of
Artec Space Spider is expressed as mean absolute
percent deviation (MAPD) for each defined metric.
Furthermore, relative standard deviation (RSD) as a
measure of precision, which quantifies the average
dispersion of a set of observations from an estimate
of the set’s mean value, was calculated. The RSD tells
whether the “regular” SD is small or large when
compared to the mean for the data set.
2.3.2 Colored Distance Maps (CDM)
In the second approach, colored or surfaces distance
maps of interval models were created. These maps
help to determine the variability in the shape and
volume of the surfaces (URL 2). This approach is
often used in quality control where comparison of the
original model with the scanned one is necessary. In
total 20 colored distance maps were made where each
model served as a reference one. For example, first,
model_1 was regarded as reference (model1-model2),
then model_2 was regarded as reference (model2-
model). This process was conducted for a comparison
of five interval models. The Artec Studio calculated
mean absolute distance (MADi), mean absolute
deviation (MADe), mean signed distance (MSD), and
root mean square (RMS) for each comparison. The
RMS error is a frequently used statistic metric in
evaluating the degree of inaccuracy (Campbell, Shin
2011). It shows the variation between the compared
3D surface. Lower RMS value indicates a similar
shape (higher precision), while the higher values
indicate higher disparity (lower precision) in 3D
models (Ozsoy et al., 2019). However, the calculated
RMS error from Artec Studio matches the STDEV
function in Excel. MADi is the average of absolute
deviation values (all deviations become positive).
MSD is an average value of all deviations (+ and -).
MADe represents the excel AVEDEV function which
returns the average of the deviations value from the
mean for a given set of data.
3 RESULTS AND DISSCUSSION
3.1 Section Analysis
Table 3 shows the total MV (mmᶟ) of PL for each
measurement and derived AD and PD. The reference
(mean) MV of scanned PL was 18012.2 mmᶟ. MAPD
GISTAM 2022 - 8th International Conference on Geographical Information Systems Theory, Applications and Management
70
was 0.387 %. The highest AD and PD were recorded
in the fourth measurement and amounted to 88.71
mmᶟ or 0.493%.
Table 3: Total MV for measurements and derived mean AD
and PD.
Measurement
(s1+s2+s3+s4+s5)
Total MV
(mmᶟ)
AD (mmᶟ)
PD (%)
M1
17942.8
69.45
0.3856
M2
17986.2
26.00
0.1443
M3
18097.6
85.38
0.4740
M4
18100.9
88.71
0.4925
M5
17933.6
78.64
0.4366
MEAN
18012.2
69.64
0.3866
This value is acceptable because an empty PL was
scanned which represents the worst-case scenario in
TFD studies, one in which no tufa formed. However,
when precipitation occurs, the PL surface would have
a more recognizable shape, texture, and color making
it easier to scan and register. Also, the MV would be
bigger which would potentially reduce the PD.
Precision assessment of various scanners at scanning
tufa formed in different intervals (3, 12 months) and
with various surface complexity (plant fragments,
macroinvertebrates) will be the subject of future
research. Table 4 shows MAPD derived the
remaining metrics.
Table 4: MAPD for MA, M, and P.
ID
Section
PD for MA
PD for M
PD for P
M1
Plane1
0.105
0.088
0.040
Plane2
0.119
0.115
0.049
Plane3
0.134
0.103
0.032
Plane4
0.149
0.084
0.036
Plane5
0.176
0.055
0.068
M2
Plane1
0.014
0.097
0.045
Plane2
0.019
0.129
0.049
Plane3
0.024
0.133
0.051
Plane4
0.032
0.141
0.076
Plane5
0.059
0.090
0.035
M3
Plane1
0.109
0.088
0.043
Plane2
0.121
0.045
0.022
Plane3
0.134
0.037
0.018
Plane4
0.145
0.024
0.012
Plane5
0.182
0.064
0.031
M4
Plane1
0.217
0.004
0.019
Plane2
0.233
0.037
0.015
Plane3
0.254
0.037
0.017
Plane4
0.280
0.044
0.002
Plane5
0.321
0.121
0.038
M5
Plane1
0.206
0.276
0.107
Plane2
0.216
0.235
0.084
Plane3
0.230
0.235
0.067
Plane4
0.244
0.244
0.087
Plane5
0.268
0.329
0.019
MAPD
0.160
0.114
0.043
As expected, Space Spider in is more unreliable when
generating MV compared to other derived metrics
(Table 5).
Table 5: RSD derived for defined metrics.
Section
MV
MA
M
P
M1_5
Plane1
2.101
0.168
0.159
0.065
Plane2
2.087
0.181
0.149
0.057
Plane3
2.078
0.196
0.147
0.049
Plane4
2.075
0.213
0.149
0.062
Plane5
3.312
0.246
0.186
0.063
mean RSD
2.331
0.201
0.158
0.059
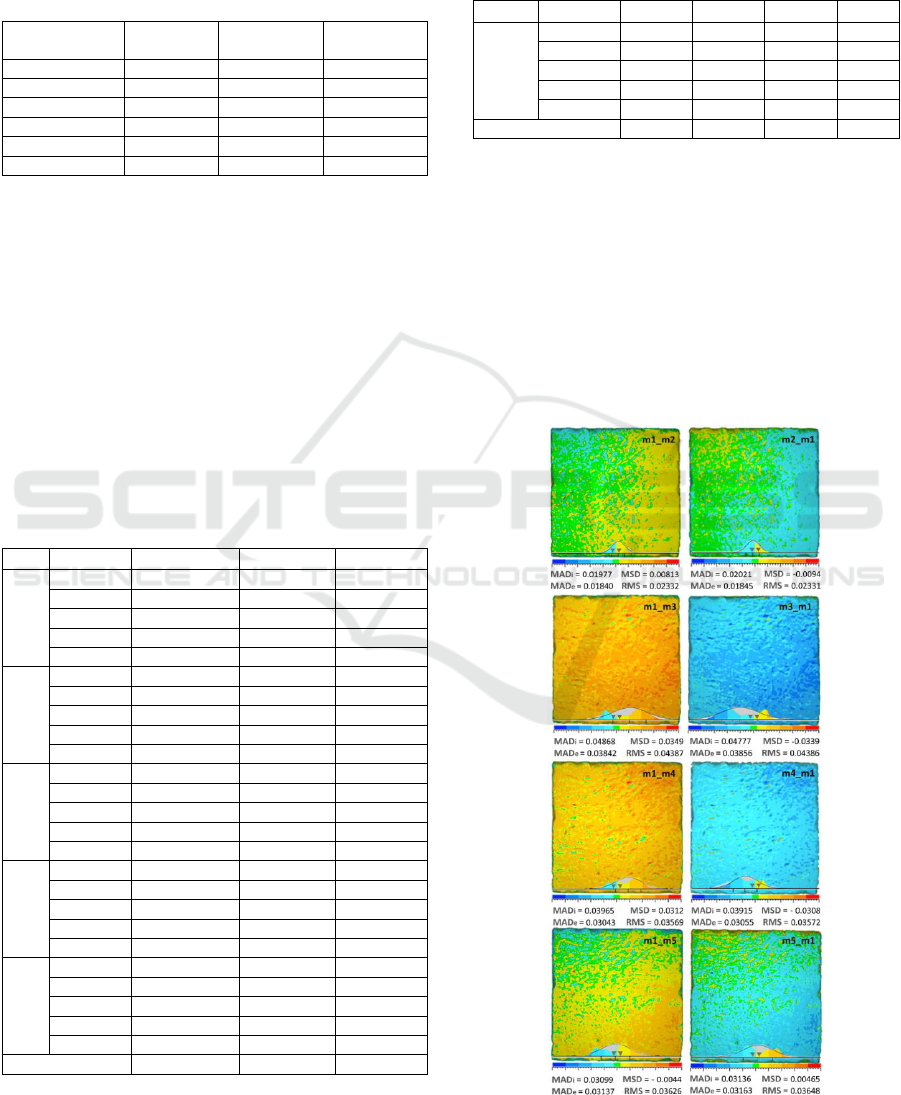
3.2 CDM Results
Green values on the following Figures (3, 4, and 5)
show areas with zero error, red shows error above the
reference surface, and blue below. The average RMS
error for all compared CDMs was 0.030 mm. Average
MADi was 0.0328 mm and average MADe was
0.0248 mm. All derived statistic metrics had a smaller
value of declared manufactured accuracy value. No
specific imprecision patterns were observed in the
respective CDMs.
Figure 3: Derived colored distance map (1).
Precision Assessment of Artec Space Spider 3D Handheld Scanner for Quantifying Tufa Formation Dynamics on Small Limestone Plates
(PLs)
71
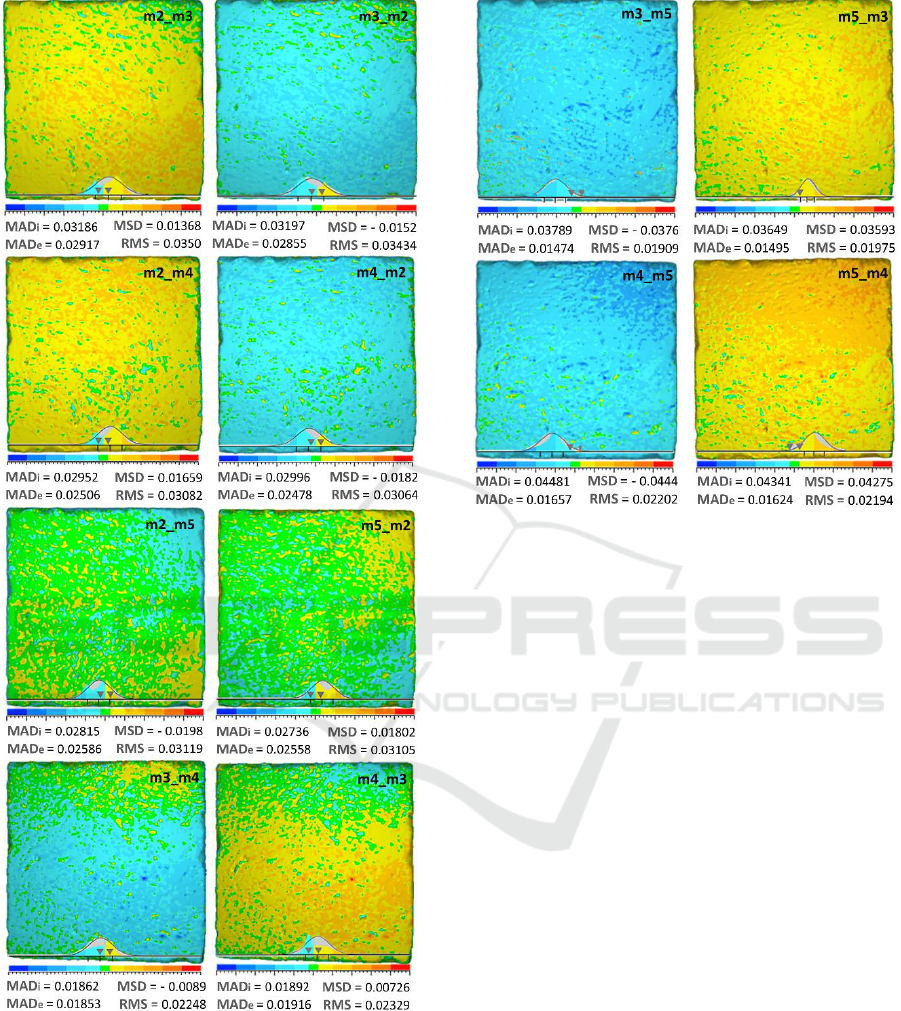
Figure 4: Derived colored distance map (2).
Tufa growth and erosion rates can be expressed as the
height/thickness (mm a
-1
), volume (mm
3
a
-1
), and
mass (g a
-1
) formed at some period of time
(Gradzinski, 2010). In general, when considering the
annual tufa growth rate expressed through height, it is
around a few mm a
-1
, depending on a wide range of
parameters (Vázquez-Urbez et al., 2010, Marić et al.,
2020). So, if the TFD is expressed through a
Figure 5: Derived colored distance map (3).
volumetric approach, on a PL surface of 25 cm², when
4 mm of tufa is formed, the MV of tufa would be 10
000 mmᶟ. Since the determined highest AD for MV
is 88.71 (mmᶟ) this would result in an unreliable
calculation of the tufa MV by 0.8871%.
If the TFD is analyzed using the height (mm a
-1
)
approach, and since all metrics in CDM had a smaller
value (around 0.035 mm) of declared manufactured
accuracy, then this would result in an unreliable
calculation of the tufa height by 0.875 %. However, it
should be noted that the reliability of the
measurement can be better after the formation of tufa
occurs. It might seem contradictory but there is a lot
of complexity when it comes to scanning this type of
object (small, empty PL). In the next interval
measurements, after the volume of the scanned PL
increases, ie the tufa occurs on the PL surface, the
scanning process should be easier.
4 CONCLUSION
The aim of this study was to assess the precision of
Artec Space Spider in scanning the small limestone
PLs used for monitoring TFDs.
Although Space Spider is a high-quality 3D
scanner, its application in TFD measurement may be
limited due to the fact that they do not have a fixed
LCS which makes interval comparison of 3D models
GISTAM 2022 - 8th International Conference on Geographical Information Systems Theory, Applications and Management
72

easier and due to the fact that limestone PLs used for
monitoring TFD does not necessary have distinctive
characteristics (surfaces features). Therefore, the
first, initial scanning of a PL which does not have
formed tufa on its surfaces, can be very difficult.
The first drawback was solved by adding markers,
i.e creating the LCS for model alignment. The results
of the precision assessment showed that Space Spider
generates reliable results considering the
characteristics of the scanned object (empty PL) and
it certainly can be used in TFD analysis. Data
obtained with a Space Spider has high reproducibility
and reliability.
In future research, the comparison of the tufa
growth and erosion results obtained using hand-held
3D scanners and other indirect and direct methods
(Marić, et al., 2020), that can express growth and
eruption rates through volume (mm
3
a
-1
) and height
(mm a
-1
), will be done.
ACKNOWLEDGEMENTS
This work has been supported by Croatian Science
Foundation under the project UIP-2017-05-2694.
REFERENCES
Abdel, M. (2011). 3D Laser Scanners: History, Applications,
And Future. Civil Engineering Department, Faculty of
Engineering, Assiut University, Egypt,
http://iqvolution.ws/storage/app/public/uploads/files/
Inovation-2/Publikacii/3D-Laser-Scanners-History-
Applications-And-Future.pdf, 22 January, 2021.
Allegra, D., Gallo, G., Inzerillo, L., Lombardo, M., Milotta,
F. L. M., Santagati, C., Stanco, F. (2016, October). Low
Cost Handheld 3D Scanning for Architectural Elements
Acquisition. In STAG: Smart Tools and Apps in
computer Graphics, 3-4 October, 2016, Eds. Pintore, G.
and Stanco, F., Genova, Italy, (pp. 127-131).
Artec 3D (2020). Professional 3D scanning solutions, Artec
Studio, https://www.artec3d.cn/files/pdf/Artec3D-
Scanners-Brochure.pdf, 20 January, 2021.
Batini, C., Cappiello, C., Francalanci, C., Maurino, A.
(2009). Methodologies for data quality assessment and
improvement. ACM computing surveys (CSUR), 41(3),
1-52.
Buck, U., Buße, K., Campana, L., Schyma, C. (2018).
Validation and evaluation of measuring methods for the
3D documentation of external injuries in the field of
forensic medicine. International journal of legal
medicine, 132(2), 551-561.
Campanelli, V., Howell, S. M., Hull, M. L. (2016).
Accuracy evaluation of a lower-cost and four higher-
cost laser scanners. Journal of biomechanics, 49(1),
127-131.
Campbell, J. E., Shin, M. (2011). Essentials of geographic
information systems, Textbooks. 2, Liberty University,
https://digitalcommons.liberty.edu/cgi/viewcontent.cgi
?article=1001&context=textbooks, 21 January, 2021.
Dessery, Y., Pallari, J. (2018). Measurements agreement
between low-cost and high-level handheld 3D scanners
to scan the knee for designing a 3D printed knee brace.
PloS one, 13(1), e0190585.
Eiríksson, E. R., Wilm, J., Pedersen, D. B., Aanæs, H.
(2016). Precision and accuracy parameters in structured
light 3-D scanning. The International Archives of
Photogrammetry, Remote Sensing and Spatial
Information Sciences, Volume XL-5/W8, 7-15.
Georgopoulos, A., Ioannidis, C., Valanis, A. (2010).
Assessing the performance of a structured light scanner.
International Archives of Photogrammetry, Remote
Sensing and Spatial Information Sciences, 38(Part 5),
251-255.
Gradziński, M. (2010). Factors controlling growth of
modern tufa: results of a field experiment. Geological
Society, London, Special Publications, 336(1), 143-
191.
Hofer, M., Strauß, G., Koulechov, K., Dietz, A. (2005,
May). Definition of accuracy and precision—
evaluating CAS-systems. In International Congress
Series, Elsevier, Volume 1281, pp. 548-552.
Koban, K., Schenck, T. L., Giunta, E. R. (2016, November).
Using mobile 3D scanning systems for objective
evaluation of form, volume, and symmetry in plastic
surgery: intraoperative scanning and lymphedema
assessment. In Proceedings of the 7th International
Conference on 3D Body Scanning Technologies,
Lugano, Switzerland, 30 November - 1 December, 2016.
Marić, I., Šiljeg, A., Cukrov, N., Roland, V., Domazetović,
F. (2020). How fast does tufa grow? Very high ‐
resolution measurement of the tufa growth rate on
artificial substrates by the development of a contactless
image ‐ based modelling device. Earth Surface
Processes and Landforms, 45(10), 2331-2349.
Marić, I., Šiljeg, A., Domazetović, F., Cukrov, N. (2021).
A framework for using handheld 3D surface scanners
in quantifying the volumetric tufa growth. In
GEOMORPHOMETRY 2020, CNR Edizioni, Eds. M.
Alvioli, I. Marchesini, L. Melelli, P. Guth, Perugia,
Italy, 22-26 June 2020, 18.
Modabber, A., Peters, F., Kniha, K., Goloborodko, E.,
Ghassemi, A., Lethaus, B., ... & Möhlhenrich, S. C.
(2016). Evaluation of the accuracy of a mobile and a
stationary system for three-dimensional facial
scanning. Journal of Cranio-Maxillofacial Surgery,
44(10), 1719-1724.
Motley, P. (2020). Accuracy Testing of the Artec Space
Spider When 3D Scanning Tricky Objects,
GEOMESURE3D BLOCK https://gomeasure3d.com/
blog/testing-accuracy-artec-space-spider-when-3d-
scanning-tricky-objects/, 20 January, 2021.
Özsoy, U., Sekerci, R., Hizay, A., Yildirim, Y., & Uysal, H.
(2019). Assessment of reproducibility and reliability of
Precision Assessment of Artec Space Spider 3D Handheld Scanner for Quantifying Tufa Formation Dynamics on Small Limestone Plates
(PLs)
73

facial ex-pressions using 3D handheld scanner. Journal
of Cranio-Maxillofacial Surgery, 47(6), 895-901.
Patel, A., Islam, S. M. S., Murray, K., Goonewardene, M.
S. (2015). Facial asymmetry assessment in adults using
three-dimensional surface imaging. Progress in
orthodontics, 16(36), 1-9.
Reichert, J., Schellenberg, J., Schubert, P., Wilke, T. (2016).
3D scanning as a highly precise, reproducible, and
minimally invasive method for surface area and volume
measurements of scleractinian corals. Limnology and
Oceanography: Methods, 14(8), 518-526.
Ritschl, L. M., Wolff, K. D., Erben, P., Grill, F. D. (2019).
Simultaneous, radiation-free registration of the
dentoalveolar position and the face by combining 3D
photography with a portable scanner and impression-
taking. Head & face medicine, 15(1), 1-9.
Santos, M. C., Souza, C. B., de Freitas, S. R. (2000). A
practical evaluation of the GPS rapid static method.
Geomatica, 54(4), 425-432.
Seminati, E., Canepa Talamas, D., Young, M., Twiste, M.,
Dhokia, V., Bilzon, J. L. (2017). Validity and reliability
of a novel 3D scanner for assessment of the shape and
volume of amputees’ residual limb models. PLoS One,
12(9), e0184498.
Sivanandan, J., Liscio, E., Eng, P. (2017). Assessing
structured light 3D scanning using Artec Eva for injury
documentation during autopsy. J Assoc Crime Scene
Reconstr, 21, 5-14.
URL 1 http://docs.artec-group.com/as/15/en/process.html
#sec-global-optimization, 25 January, 2021.
URL 2 https://www.artec3d.com/cases/measuring-shifts-
in-facial-soft-tissues, 8 February, 2021
Varga, M., Morrison, S. C., Price, C. (2019, October).
Reliability of Measuring Morphology of the Paediatric
Foot Using the Artec Eva Hand Held Scanner. In
Proceedings of 10th Int Conf and Exh on 3D Body
Scanning and Processing Technologies, Hometrica
Consulting, 21-22 October 2019, Lugano, Switzerland,
pp. 22-23.
Vázquez-Urbez, M., Arenas, C., Sancho, C., Osácar, C.,
Auqué, L., Pardo, G. (2010). Factors controlling
present-day tufa dynamics in the Monasterio de Piedra
Natural Park (Iberian Range, Spain): depositional
environmental settings, sedimentation rates and
hydrochemistry. International Journal of Earth
Sciences, 99(5), 1027-1049.
Verhulst, A., Hol, M., Vreeken, R., Becking, A., Ulrich, D.,
Maal, T. (2018). Three-dimensional imaging of the
face: a com-parison between three different imaging
modalities. Aesthetic surgery journal, 38(6), 579-585.
Wang, P., Jin, X., Li, S., Wang, C., Zhao, H. (2019, April).
Digital Modeling of Slope Micro-geomorphology
Based on Artec Eva 3D Scanning Technology. In IOP
Conference Series: Earth and Environmental Science,
Volume 252 - 4th International Conference on
Environmental Science and Material Application 15–16
December 2018, Xi'an, China, No. 5, p. 052116, IOP
Publishing.
Winkler, J., Gkantidis, N. (2020). Trueness and precision of
intraoral scanners in the maxillary dental arch: An in
vivo analysis. Scientific reports, 10(1), 1-11.
Zhang, W., Kosiorek, D. A., Brodeur, A. N. (2020).
Application of Structured ‐ Light 3 ‐ D Scanning
to the Documentation of Plastic Fingerprint
Impressions: A Quality Comparison with Traditional
Photography. Journal of Forensic Sciences,
65(3), 784-790.
GISTAM 2022 - 8th International Conference on Geographical Information Systems Theory, Applications and Management
74
