
17K-Graffiti: Spatial and Crime Data Assessments in S
˜
ao Paulo City
Bahram Lavi
1
, Eric K. Tokuda
2
, Felipe Moreno-Vera
3
, Luis Gustavo Nonato
4
, Claudio T. Silva
5
and Jorge Poco
1
1
School of Applied Mathematics, Getulio Vargas Foundation, Rio de Janeiro, Brazil
2
Institute of Mathematics and Statistics, University of S
˜
ao Paulo, Brazil
3
Computer Science Department, San Pablo Catholic University, Arequipa, Peru
4
Institute of Mathematics and Computer Sciences, S
˜
ao Carlos, Brazil
5
Computer Science and Engineering, New York University, New York, U.S.A.
Keywords:
Graffiti, Object Detection, Spatial Infrastructure, Crime Analysis, Data Correlation.
Abstract:
Graffiti is an inseparable element of most large cities. It is of critical value to recognize whether it is an artistry
product or a distortion sign. This study develops a larger graffiti dataset containing a variety of graffiti types
and annotated boundary boxes. We use this data to obtain a robust graffiti detection model. Compared with
existing methods on the task, the proposed model achieves superior results. As a case study, the created model
is evaluated on a vast number of street view images to localize graffiti incidence in the city of S
˜
ao Paulo,
Brazil. We also validated our model using the case study data, and, again, the method achieved outstanding
performance. The robustness of the technique enabled further analysis of the geographical distribution of
graffiti. Considering graffiti as a spatial element of the city, we investigated its relation with crime occurrences.
Relatively high correlation values were obtained between graffiti and crimes against pedestrians. Finally, this
work raises many questions, such as the understanding of how these relationships change across the city
according to the types of graffiti.
1 INTRODUCTION
A man got impressed when scratches on a cave called
the attention for the first time — known as “Graffiti”
these days. It is an influential social element that is
applied to manifest or express the culture of a com-
munity. Graffiti can be written and/or drawn with
spray paint, stickers, wheat paste and can be repre-
sented in different forms and types (e.g., tags, gang,
mural, etc.). Although graffiti can express culture,
manifesting the vision of a group of people, its im-
pact on the urban environment and the targeting of
neighborhoods is undeniable.
Through the perspective of the broken window
theory of Kelling and Wilson (Kelling et al., 1982) —
a professor at Harvard and a former policeman —
graffiti has been interpreted as an essential social dis-
ordering factor that can lead to inappropriate behav-
iors. For example, unauthorized graffiti can reject so-
cial bonds. This theory also plays a significant role
in getting police attention to social factors and other
offenses; this idea has been broadly applied in the
United States criminal justice system (Jenkins, 2020).
A study in Groningen, Netherlands, showed that the
presence of tags-type graffiti more than double the
number of littering or stealing (Keizer et al., 2008).
Since late 1994, graffiti has been removed in Paris,
France, focusing mainly on recurrent visual signs of
disruption on the facades, reserving severe punish-
ment for any sort of vandalism in public places (De-
nis and Pontille, 2021). On the other hand, a recent
study showed that the authorized graffiti in Belo Hor-
izonte, Brazil, presented no relation to local crime oc-
currence (Diniz and Stafford, 2021).
It is well-known that there is a strong connection
between a city’s appearance and crime activity (Har-
court, 1998; Sampson and Raudenbush, 2001; Gomes
et al., 2021; Khorshidi et al., 2021). In fact, fac-
tors such as urban area conservation, health, educa-
tion, and mobility have high effects on the rates of
alcoholism, obesity, and the spread of STDs (Naik
et al., 2016). Therefore, graffiti is an essential spa-
tial phenomenon that must be carefully studied and
analyzed (Biljecki and Ito, 2021).
The contribution of this paper can be seen in three
fronts: (i) we introduce a collected, organized, and
968
Lavi, B., Tokuda, E., Moreno-Vera, F., Nonato, L., Silva, C. and Poco, J.
17K-Graffiti: Spatial and Crime Data Assessments in São Paulo City.
DOI: 10.5220/0010883300003124
In Proceedings of the 17th International Joint Conference on Computer Vision, Imaging and Computer Graphics Theory and Applications (VISIGRAPP 2022) - Volume 4: VISAPP, pages
968-975
ISBN: 978-989-758-555-5; ISSN: 2184-4321
Copyright
c
2022 by SCITEPRESS – Science and Technology Publications, Lda. All rights reserved

annotated graffiti dataset to train a robust model able
to identify graffiti from images; (ii) considering graf-
fiti as a spatial element, we run a case study to inves-
tigate the relation between crimes in the city of S
˜
ao
Paulo, Brazil (referred as S
˜
ao Paulo from now on) and
graffiti; and finally (iii) we find a substantial correla-
tion between crime events against pedestrians and the
presence of graffiti in S
˜
ao Paulo.
2 RELATED WORK
We first consider some works about urban percep-
tion and its relation with urban phenomena like crime.
Then we report the existing works and methods on
graffiti detection task.
2.1 Urban Perception Analysis
The research area on urban perception aims at under-
standing the city environment and the behavior of its
inhabitants (Yoshimura et al., 2020). Several studies
with different approaches (e.g., urban planning, ur-
ban designing, social development) have shown that
the city’s visual components influence human per-
ception and might impact the behavior of a popu-
lation. Lynch et al. (Lynch, 1984) report a simi-
lar metamorphosis in the main cities of the USA.
The work compares urban physical factors such as
shape, pattern, and texture of the buildings and urban
planning attributes (distribution of buildings, parks,
supermarkets, police stations, etc.), showing a rela-
tive relationship between the urban factors and the
behavior of inhabitants of specific neighborhoods.
Megler et al. (Megler et al., 2014) combine census
and city data in San Francisco, USA, to investigate
which urban factors significantly correlate with graf-
fiti reports. Then, those factors are used to build a
regression model for predicting the graffiti incidence
in different city neighborhoods.
Schroeder and Anderson (Schroeder and Ander-
son, 1984) investigate the correlation of the city’s vi-
sual components (e.g., graffiti, garbage, trash) and
violations in Chicago, Georgia, and Michigan. The
work by (Arietta et al., 2014) studied the correla-
tion between visual and non-visual-attributes with the
statistic of crimes, house pricing, population den-
sity, graffiti presence, and a perception survey. Some
studies focus on extracting objects from street-view
images to understand the urban perception in some
populations (Ordonez and Berg, 2014; Naik et al.,
2014; Zhang et al., 2018; Moreno-Vera et al., 2021b;
Moreno-Vera et al., 2021a).
Table 1: Number of images and boundary box instances for
Train-and-Test sets. The table also reports the total value
over each column and row.
Boundary box
Set Images Single-boundary Multi-boundary Total
Train 6,956 4,115 9,704 13,819
Test 1,737 1,004 2,008 3,012
Total 8,693 5,119 11,712 16,831
2.2 Existing Graffiti Detection Methods
To the best of our knowledge, there is only a sin-
gle publicly available dataset for graffiti detection.
STORM (Charalampos et al., 2019) specializes in de-
tecting graffiti and was mainly collected in Greece. It
contains only instances with tags-type graffiti. The
dataset is made up of about 1K image samples ac-
quired at street level. Alzate et al. (Alzate et al.,
2021) later extended the STORM dataset by append-
ing three hundred images from Google Street View
(GSV) images, which were annotated for the graf-
fiti detection task. We compare our graffiti detec-
tor with those works in the experimental section.
Tokuda et al. (Tokuda et al., 2019) also performed
graffiti prediction on ground-level images, but on a
larger scale; however, the performance of the predic-
tion was modest (∼ 57% of average precision), not
providing any association with city indicators such as
crime.
3 GRAFFITI DETECTION
In the following section, we first introduce our 17K-
Graffiti dataset and explain its annotation procedure,
aiming its use to train models to identify graffiti from
images. We also discuss the graffiti detection model
considered in this work, assessing its performance.
3.1 Dataset Collection and Annotation
Undoubtedly, Flickr.com is well-known as a rich re-
source of photo-sharing website. It provides an Appli-
cation Programming Interface (API) that allows users
to retrieve and download vast amounts of images sup-
plied by photographs (alongside the meta-data) for
further analyses.
Flickr.com also contains various types and a large
number of graffiti images. We retrieved the graffiti
images through the keyword “graffiti”. In our initial
stage, we recovered 15K photos of graffiti. We ex-
amined the initial pool and removed the duplicates,
which resulted in a final dataset of about 9K im-
ages. The collection is rich and covers different types
17K-Graffiti: Spatial and Crime Data Assessments in São Paulo City
969

Figure 1: Histogram of graffiti instance distribution on our
collection set.
of graffiti (e.g., tags, mural, throw-ups, blockbuster,
stencil, etc.). Then we take another step to manually
annotate the boundary box over each graffiti instance
observed on each image in the dataset. To train a de-
tection model is essential to provide the boundary box
of the region of interest (ROI) — graffiti in this task.
It can offer single- or multi-instance boundary boxes
per image. Each ground truth boundary box repre-
sents two points in a 2D space: top-left coordinate
(x
∗
,y
∗
) and (w
∗
,h
∗
) width and height values, respec-
tively. After the annotation process, the dataset con-
tains nearly 17K graffiti instances (some images in-
clude more than one graffiti). We point out that, since
the pictures have different sizes, we annotated them
with their original dimensions.
We considered a fraction of the dataset for train-
ing (80%), remaining for testing. Table 1 provides
detailed information on the number of graffiti images
and the number of annotated boxes. Note that most of
the photos from the dataset presented multi-instance
graffiti; in which some images contains more than ten
instances. Fig. 1 shows the histogram distribution of
graffiti instances.
3.2 Faster R-CNN
Faster Region-based Convolutional Neural Network
(Faster R-CNN) (Ren et al., 2016) is a seminal ob-
ject detection framework, mainly popular due to its
simplicity and robustness. It is a multi-stage ob-
ject detection model (Zhao et al., 2019) trained with
multi-task loss. Unlike a single-stage object detection
model, like YOLO (Redmon et al., 2016)), in which
the model aims to predict the probability of an ob-
ject’s presence through the conditional class proba-
bility and boundary box regressions for the object that
its center points match within a grid cell. Therefore,
most predicted anchors rely upon the background, and
dramatically only a few ground-truth instances re-
ceive positive prediction probability from the target
ground-truth within the grid cell. Thus, the network
ultimately has to make a trade-off to determine the
most potential candidates to deliver them as the ob-
jects presence, which yields the network to weak per-
Figure 2: Architecture of the Faster R-CNN utilized for our
graffiti detection task.
formance on some queries. In contrast, the Faster R-
CNN overcomes this issue by considering the number
of anchors appearing in the grid cell. The single-stage
detector can also be a prefect match for real-time de-
tection task. However, in this work, we aim to use
a robust detector in order to localize the incidence of
graffiti observed on street level for which the Faster
R-CNN showed its promises on accurate detection.
Given an image I and its corresponding boundary
boxes (x
∗
,y
∗
,w
∗
,h
∗
) as the network’s input, it ulti-
mately returns spatial coordinates of boundary boxes
with its associated classes by performing a boundary
box regression. The network contains an additional
region proposal network (RPN) that seeks the region
of interest (ROI), enabling the network to detect ob-
jects in a wide range of scales and aspect ratios. The
RPN network is trained by minimizing the objective
function as defined in (Girshick, 2015). However, the
boundary box regression followed by the four coordi-
nates is computed as
t
x
= (x − x
a
)/w
a
,t
y
= (y − y
a
)/h
a
,
t
w
= log(w/w
a
),t
h
= log(h/h
a
),
t
∗
x
= (x
∗
− x
a
)/w
a
,t
∗
y
= (y
∗
− y
a
)/h
a
,
t
∗
w
= log(w
∗
/w
a
),t
∗
h
= log(h
∗
/h
a
),
(1)
where (x, y,w, h) and (x
a
,y
a
,w
a
,h
a
) are the coordi-
nates of the predicted boundary box and the anchor
box, respectively. Faster RCNN begins with one of
the standard CNNs (e.g., ResNet (He et al., 2016),
VGG (Simonyan and Zisserman, 2014)) as its back-
bone, which is followed by a Feature Pyramid Net-
work (FPN). The FPN plays as a bottleneck to obtain
multiple feature maps with different scales from the
features generated by the backbone CNN. Both FPN
and RPN then pass through the pooling ROI layer.
Fig. 2 depicts the whole pipeline of Faster R-CNN
considered in this work as our graffiti detector.
3.3 Detection Assessment
Average precision (AP) is a typical metric for mea-
suring the accuracy of an object detector and esti-
VISAPP 2022 - 17th International Conference on Computer Vision Theory and Applications
970

mates the precision for each value of recall at different
ranks. To estimate if the detected box is a true/false
positive, it is essential to calculate the area of overlap
between ground truth and detected boxes, known as
Intersection Over Union (IOU).
AP calculates the area under the precision-recall
curve for each given image, the ground-truth, and
the detected boxes, AP =
R
1
0
p(r)dr where p(r) is the
measured precision at recall rank r. Finally, a mean
average precision (mAP),
1
N
∑
N
i=1
AP
i
, is reported as
the final score of the detector. The mAP is com-
monly reported over different IOU criteria. This eval-
uation metric is the same as in-applied on MS-COCO
dataset (Lin et al., 2014).
4 EXPERIMENTS
This section describes the experimental setup, the
graffiti detection results, and the study focused on
investigating the association between graffiti and
crimes.
4.1 Experimental Setup
The graffiti detection model is built upon the Py-
torch framework (Paszke et al., 2019). We adopted
ResNet50 (He et al., 2016) as the backbone for the
Faster RCNN. Then, we re-scaled each input im-
age to 3 × 224 × 224, representing the image’s num-
ber of channels, width, and height, respectively. We
used a learning rate of 0.001 and fine-tuned the net-
work using the pre-trained weights on the COCO
dataset (Lin et al., 2014). We then iterated the net-
work to learn 27K times. For each iteration, the net-
work was fine-tuned with a randomly-sample batch
of 16 images. We use the momentum of 0.9 and
a weight decay of 0.0005 (Ren et al., 2016) while
training. We performed all the experiments in an
Nvidia Quadro RTX5000 GPU. The organized 17K-
Graffiti dataset, boundary box annotations, model im-
plementation, and pre-trained weights are available in
https://github.com/visual-ds/17K-Graffiti.
4.2 Graffiti Detection Results
We report the performance of our graffiti detector us-
ing mAP (%). We evaluate the model also on the
STORM dataset (Charalampos et al., 2019), compar-
ing it with the work in (Alzate et al., 2021). Table 2
reports the performance of our graffiti detector as
mAP over different criteria on IOU. As expected, the
stricter the IOU criterion (higher value), the smaller
the mAP observed. The table also reports the com-
parison with a few works in the literature. The re-
sults from previous works have been reported just for
IOU of 0.5, in which case our proposed method pre-
sented the best performance, with 85% of mAP. Other
works (Tokuda et al., 2019) have also reported detec-
tion performance values, but they considered different
datasets and thus, their results have not been included
in this comparison.
4.3 Study on Spatial and Crime Data
The ultimate goal of the study presented in this sec-
tion is to determine whether Graffiti correlates with
any sort of crime. In other words, the goal is to an-
alyze if Graffiti impacts the occurrence of crimes in
specific neighborhoods. We evaluate this hypothesis
on a large number of images collected from Google
Street View (GSV), along with criminal records. We
consider S
˜
ao Paulo as the case study of this experi-
ment.
Google Street View Images
Ground-level images provide a valuable resource for
exploring how features vary across regions, such as
the amount of green and buildings (Li et al., 2015;
Torii et al., 2009). In particular, GSV is a service
that provides ground-level images for public access
and with comprehensive spatial coverage. For these
reasons, we have considered their images in our case
study.
GSV maps cover most of the big cities in the
world. In particular, the city of S
˜
ao Paulo is satisfac-
torily mapped by GSV images. This, coupled with the
notorious widespread of graffiti (Iddings et al., 2011)
in S
˜
ao Paulo, makes it an appropriate choice for our
study.
We uniformly sampled over the entire city, in a
grid-like fashion spaced by 102 meters. For each
point, four complementary images have been consid-
ered to cover the full 360
◦
view. In the end, after re-
moving corrupt and third-party-provided images, we
ended up with 275,339 images from the regions of in-
terest.
We evaluated our graffiti detection model in each
image. To safely assert the incidence of graffiti, we
established a hard prediction threshold of 94%, i.e.,
predictions with confidence below this value were not
considered. In the end, we obtained 4,475 individ-
ual instances of graffiti across 4,268 affected images
(1.6% of the total number of images). Although this
corresponds to a small percentage, the density of graf-
fiti is considerably heterogeneous across the city, and
17K-Graffiti: Spatial and Crime Data Assessments in São Paulo City
971
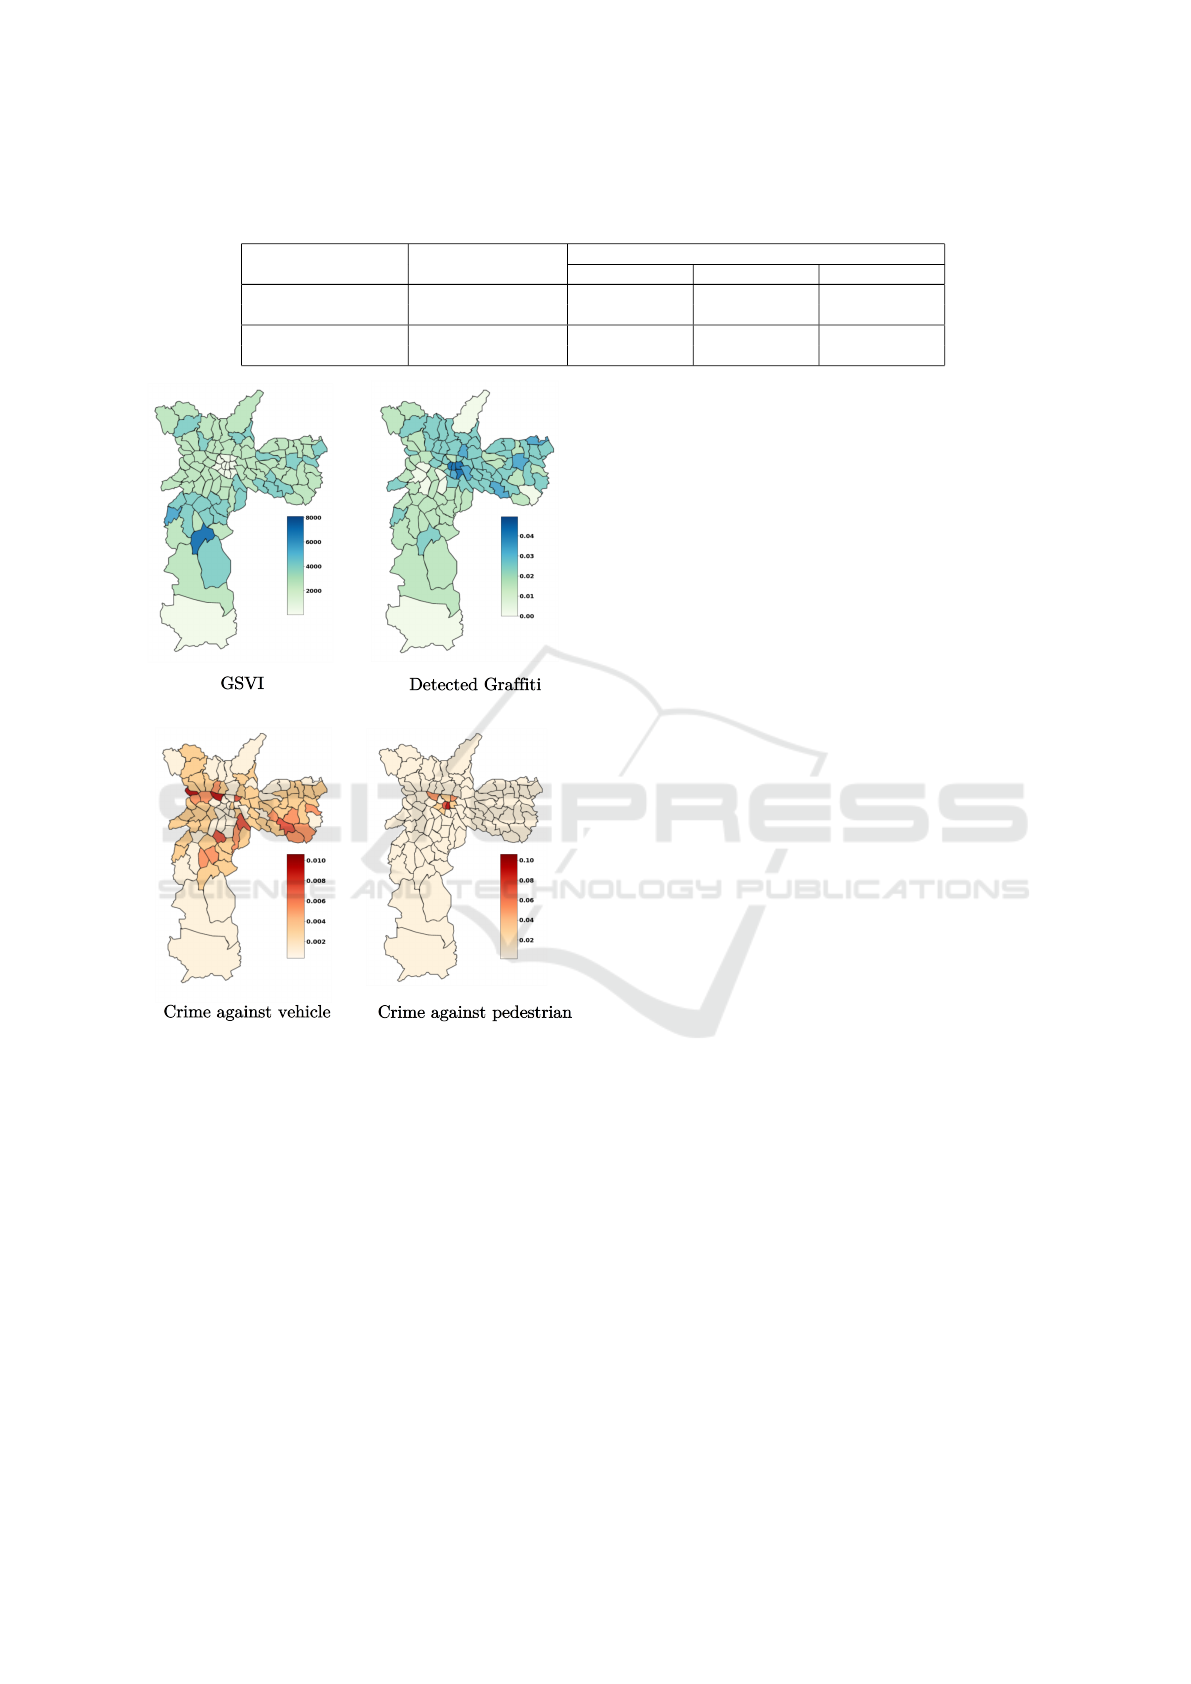
Table 2: Mean average precision on different IOU criteria (in-percentage) over the detected boundaries on the test set of the
STORM dataset.
mAP
Detector dataset @[IOU=0.25] @[IOU=0.50] @[IOU=0.75]
(Alzate et al., 2021)
STORM - 58.30 -
STORM-Extended - 69.14 -
Ours
STORM 83.05 71.60 51.53
17K-Graffiti 89.13 85.20 62.64
Figure 3: (Top): geographical distributions of downloaded
GSV images, and detected Graffiti; (bottom): crime against
vehicle, and crime against pedestrian over 96 districts of
S
˜
ao Paulo. We report the absolute numbers only for the case
of GSV images, while the remaining show the distribution
over the normalized values as described in Sec. 4.3.
there are neighborhoods with a higher incidence of
graffiti (Fig. 3).
Besides the validation results described in the pre-
vious section, to assess the performance of the trained
model in our case-study images, we addition-ally an-
notated 853 images. We evaluated the same detection
model to predict graffiti incidences. A remarkably
high precision value of 94% was achieved, attesting
that most predicted occurrences are graffiti.
In Fig. 4, we show some of the graffiti detected by
the method. The two first rows correspond to correct
predictions and the bottom row to erroneous ones. We
notice that our technique can cope with different graf-
fiti styles, view perspectives, and image illuminations
from the correct prediction.
Crime Records
The police department of S
˜
ao Paulo provides crime
records regarding robbery, leaving out drug-related
felony and sexual assault. Each record contains the
date, time, geographic coordinates where the offense
took place, and the type of crime. The dataset com-
prises crime records from 2006 to 2017, and the rob-
bery records are split into three types: pedestrian,
commercial, and vehicle robberies. In this study,
we consider only two types of crime, vehicle (32K
records) and pedestrian (104K records), from the year
2017 — this is a fair choice since our GSV images
were collected in 2017 as well.
Correlation of Graffiti with Crime
Since the urban factors are independent, it is neces-
sary to normalize data appropriately to catch a ratio-
nal measurement with the data correlation. We treat
the normalization task for each factor independently.
The graffiti data is normalized by dividing it over the
number of GSV images from the same district. On the
other hand, the population is a promising normaliza-
tion factor for crime occurrence. By taking that into
account, we normalized the crime data of each district
by dividing over the district’s population.
We consider the Pearson correlation to analyze the
relationship between Graffiti (X) and each crime type
(Y ). The correlation shows that the quantified param-
eter X
i
is correlated with parameter Y
i
when both in-
dependent parameters are potentially affected by each
other (in this study, for i = 1,...,96 representing each
district of S
˜
ao Paulo). Therefore an increase in one
should be associated with a rise in the other.
Fig. 3 (top-left) shows the geographical distribu-
tion of the images considered in this work aggre-
gated by each of the 96 districts of the city. As one
can observe, the districts have been unevenly sam-
pled, partly due to the different sizes of the neigh-
borhoods and partly due to the rural characteriza-
tion and consequently less coverage by the image
VISAPP 2022 - 17th International Conference on Computer Vision Theory and Applications
972
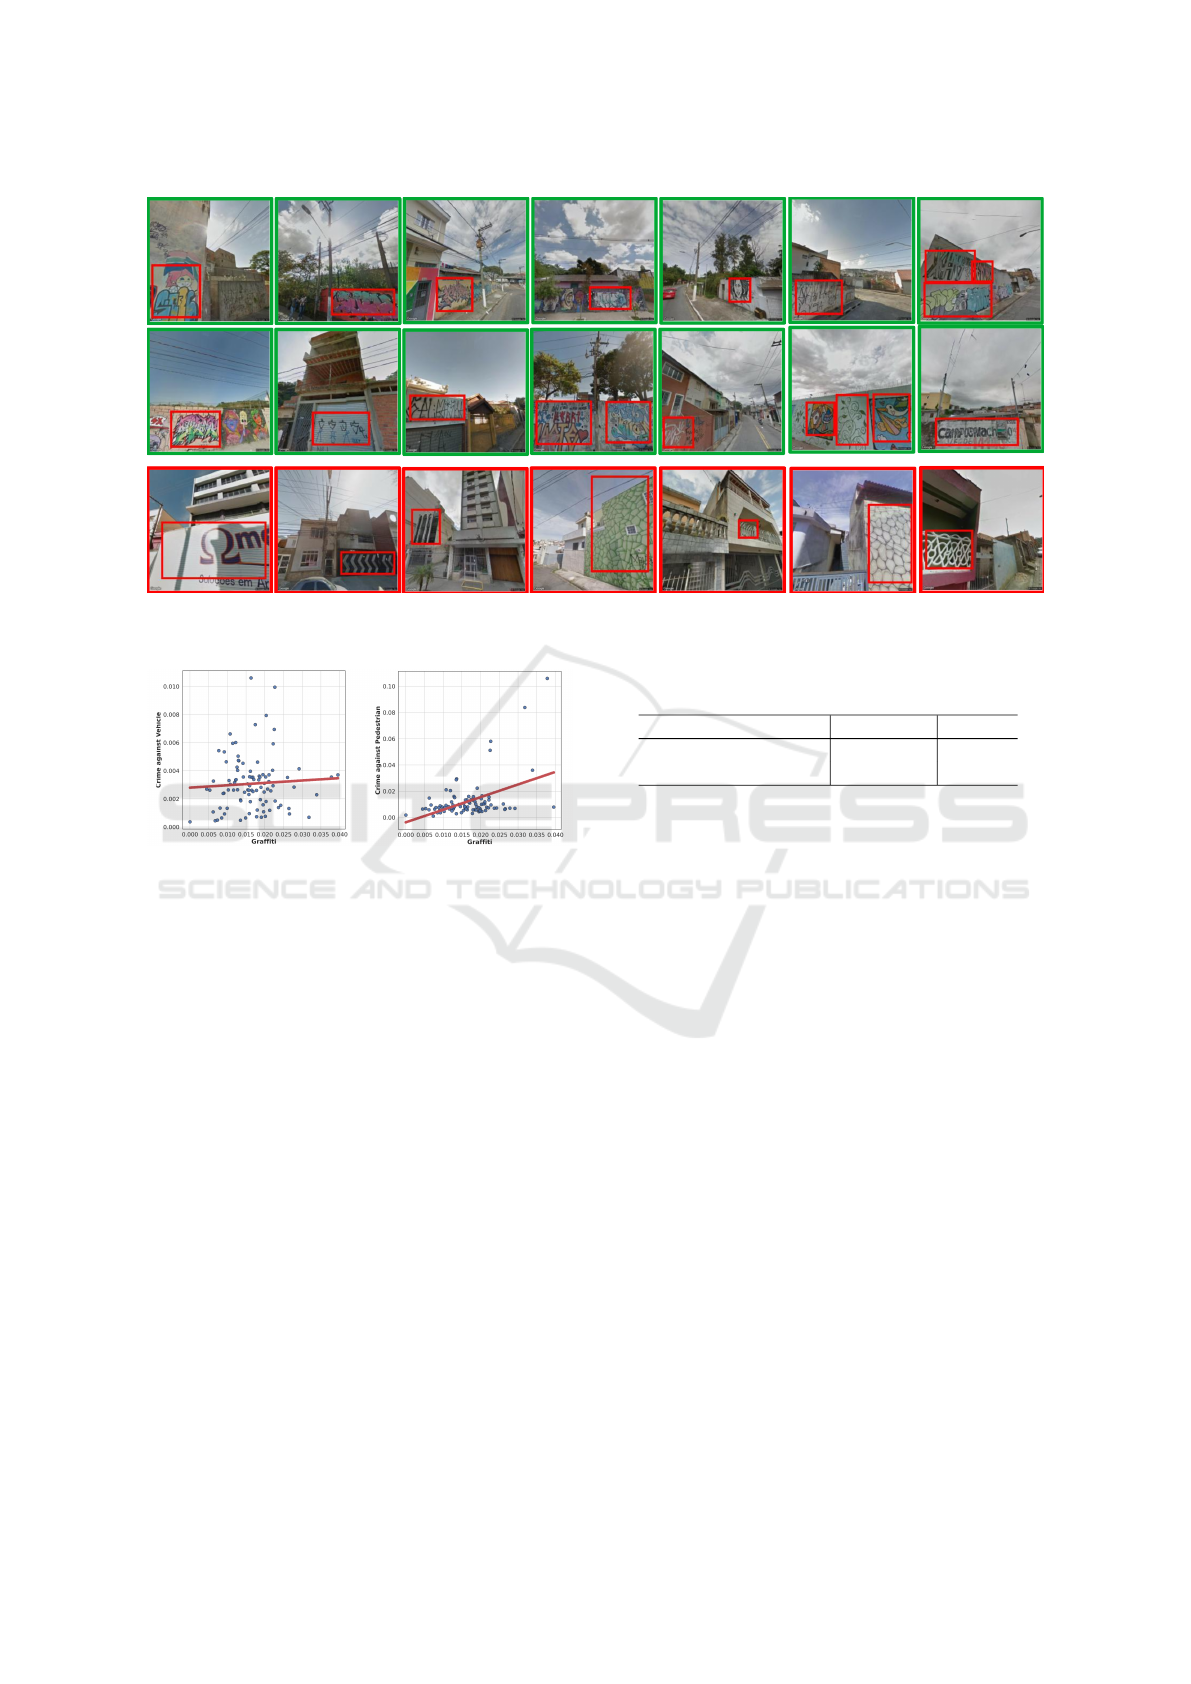
Figure 4: Two first rows: examples of true positive samples, last row: examples of false positive samples. Original images
from Google Street View. For a privacy concern, we discard to report the geo location of the images.
Figure 5: Scatter plot and its fitted regression over the data
points of Graffiti and two-type of crime records. Each point
in the plot represents the data record per district in S
˜
ao
Paulo.
provider in certain regions. Correspondingly, the top-
right map shows the geographical distribution of the
incidence of graffiti. A one-to-one correspondence
with the top-left map is not observed, which shows
the heterogeneity of the incidence of graffiti. Re-
gions with just a few images, such as in the cen-
ter of the top-left map, present a considerable inci-
dence of graffiti (top-right map). Conversely, regions
with a large number of images do not present much
graffiti. The criminality indices are shown in the
bottom row in Fig. 3, namely vehicle (bottom-right)
and pedestrian(bottom-left) robbery. Comparing both
crime maps, we see a clear difference in the distribu-
tion of the two types of crimes.
Fig. 5 shows scatter plots of the normalized fre-
quency of graffiti versus the normalized frequency of
crimes for every 96 districts. We can see the number
of crimes against vehicles on the left, and on the right,
the number of crimes against pedestrians. Whereas
we can not observe a correlation between graffiti and
vehicles’ robbery (6% in Table 3), we can observe
Table 3: This table reports the r value of Pearson correlation
on Graffiti against two-type of crime in S
˜
ao Paulo.
Spatial infrastructure Crime r value
Graffiti vs.
Vehicle 0.06
Pedestrian 0.44
a 44% (Table 3) between graffiti and pedestrian rob-
bery. It is an exciting result because one could expect
that the eventual relationship between crime and graf-
fiti would be agnostic to the crime type. However, this
result corroborates with Fig. 3, which visually shows
an agreement between pedestrian robbery and graf-
fiti. We hypothesize that such a weak relationship be-
tween the distribution of crimes against vehicles and
the presence of graffiti is related to the fact that cars
are less vulnerable to the prevalent crimes in regions
with an abundant presence of graffiti. The same fac-
tors that favor graffiti, for example, the lack of illumi-
nation and low rates of police patrolling, might prefer
the occurrences of crimes against pedestrians.
5 LIMITATION AND FUTURE
WORK
A limitation arose that the developed detector was
treated as a binary classification problem – aiming to
detect any graffiti incidence for a given image. It thus
limited us to study and analyze the effect of differ-
ent graffiti types and their relationship with crimes.
On the other hand, the influence of other urban indi-
cators (such as incidence of street light) along with
crime data records concerning over different time-
17K-Graffiti: Spatial and Crime Data Assessments in São Paulo City
973

period could assist us in enriching a potential discus-
sion overall in this study.
As future work, we recognize two discrete direc-
tion to extend the work on the hand. First, since our
graffiti data collection contains variant graffiti types,
one can strengthen the current detector into a multi-
class graffiti detection, enabling it to detect different
kinds of graffiti instances. It will allow us to exam-
ine more in-depth the presence of variant graffiti types
and crimes. Secondly, we investigate other spatial in-
frastructure data (e.g., population, health rate, educa-
tion) to broadly analyze each factor and its possible
relation with crimes.
6 CONCLUSIONS
This paper presents a 17K-Graffiti dataset specialized
for the task of graffiti detection. The dataset com-
prises a rich pool of graffiti instances that were ade-
quate to train a robust object detection model, namely
Faster R-CNN. We compared the obtained detection
model with existing graffiti detection approaches and
obtained a significant gain in performance. The model
was also evaluated on many GSV images of S
˜
ao Paulo
and an exceptional performance was observed. We
manually assessed a sample of the predictions and
identified possible causes for the false predictions.
Finally, we considered graffiti as spatial infras-
tructure data and analyzed its effect with the criminal
records data provided by the Police department of S
˜
ao
Paulo. In particular, two types of offenses have been
considered: against vehicles and pedestrians. While
the results revealed no apparent association with the
former, a relatively high correlation across neighbor-
hoods was observed for the latter. We hypothesized
the causes of such effects, mainly related to the fac-
tors that favor graffiti production.
ACKNOWLEDGEMENTS
This work was supported by Getulio Vargas Foun-
dation; NSF awards CNS-1229185, CCF-1533564,
CNS-1544753, CNS-1730396, CNS-1828576,
CNS-1626098; FAPESP grants 2019/01077-3,
2015/22308-2, and 2013/07375-0; CNPq-Brazil
grants #303552/2017-4 and #312483/2018-0; Cien-
ciActiva of the National Council for Science, Tech-
nology and Technological Innovation (CONCYTEC-
PERU) with grant 234-2015-FONDECYT; and
CAPES. Any opinions, findings, conclusions, or
recommendations expressed in this material are those
of the authors and do not necessarily reflect the views
of the CAPES, CNPq, FAPESP, or FGV.
REFERENCES
Alzate, J. R., Tabares, M. S., and Vallejo, P. (2021). Graf-
fiti and government in smart cities: a deep learning
approach applied to medell
´
ın city, colombia. In Inter-
national Conference on Data Science, E-learning and
Information Systems 2021, pages 160–165.
Arietta, S. M., Efros, A. A., Ramamoorthi, R., and
Agrawala, M. (2014). City forensics: Using visual
elements to predict non-visual city attributes. IEEE
transactions on visualization and computer graphics,
20(12):2624–2633.
Biljecki, F. and Ito, K. (2021). Street view imagery in urban
analytics and gis: A review. Landscape and Urban
Planning, 215:104217.
Charalampos, P., Panagiotis, K., Lazaros, T., and Alexan-
dros, T. (2019). Storm graffiti/tagging detection
dataset.
Denis, J. and Pontille, D. (2021). Maintenance epistemol-
ogy and public order: Removing graffiti in paris. So-
cial Studies of Science, 51(2):233–258.
Diniz, A. M. A. and Stafford, M. C. (2021). Graf-
fiti and crime in belo horizonte, brazil: The broken
promises of broken windows theory. Applied Geogra-
phy, 131:102459.
Girshick, R. (2015). Fast r-cnn. In Proceedings of the IEEE
international conference on computer vision, pages
1440–1448.
Gomes, H. S., Farrington, D. P., Defoe, I. N., and Maia,
ˆ
A.
(2021). Field experiments on dishonesty and stealing:
what have we learned in the last 40 years? Journal of
Experimental Criminology, pages 1–31.
Harcourt, B. E. (1998). Reflecting on the subject: A critique
of the social influence conception of deterrence, the
broken windows theory, and order-maintenance polic-
ing new york style. Mich. L. Rev., 97:291.
He, K., Zhang, X., Ren, S., and Sun, J. (2016). Deep resid-
ual learning for image recognition. In Proceedings of
the IEEE conference on computer vision and pattern
recognition, pages 770–778.
Iddings, A. C. D., McCafferty, S. G., and Da Silva, M. L. T.
(2011). Conscientizac¸
˜
ao through graffiti literacies in
the streets of a s
˜
ao paulo neighborhood: An ecosocial
semiotic perspective. Reading Research Quarterly,
46(1):5–21.
Jenkins, M. J. (2020). Fixing broken neighborhoods: How
police can ensure neighborhood safety and commu-
nity well-being. Advances in Social Science, Educa-
tion and Humanities Research, 420:7–13.
Keizer, K., Lindenberg, S., and Steg, L. (2008). The spread-
ing of disorder. Science, 322(5908):1681–1685.
Kelling, G. L., Wilson, J. Q., et al. (1982). Broken windows.
Atlantic monthly, 249(3):29–38.
VISAPP 2022 - 17th International Conference on Computer Vision Theory and Applications
974

Khorshidi, S., Carter, J., Mohler, G., and Tita, G. (2021).
Explaining crime diversity with google street view.
Journal of Quantitative Criminology, 37(2):361–391.
Li, X., Zhang, C., Li, W., Ricard, R., Meng, Q., and Zhang,
W. (2015). Assessing street-level urban greenery us-
ing google street view and a modified green view in-
dex. Urban Forestry & Urban Greening, 14(3):675–
685.
Lin, T.-Y., Maire, M., Belongie, S., Hays, J., Perona, P.,
Ramanan, D., Doll
´
ar, P., and Zitnick, C. L. (2014).
Microsoft coco: Common objects in context. In Euro-
pean conference on computer vision, pages 740–755.
Springer.
Lynch, K. (1984). Reconsidering the image of the city. In
Cities of the Mind, pages 151–161. Springer.
Megler, V., Banis, D., and Chang, H. (2014). Spatial anal-
ysis of graffiti in san francisco. Applied Geography,
54:63–73.
Moreno-Vera, F., Lavi, B., and Poco, J. (2021a). Quantify-
ing urban safety perception on street view images. In
2021 IEEE/WIC/ACM International Joint Conference
on Web Intelligence and Intelligent Agent Technology
(WI-IAT). IEEE.
Moreno-Vera, F., Lavi, B., and Poco, J. (2021b). Urban per-
ception: Can we understand why a street is safe? In
Mexican International Conference on Artificial Intel-
ligence, pages 277–288. Springer.
Naik, N., Philipoom, J., Raskar, R., and Hidalgo, C. (2014).
StreetScore: predicting the perceived safety of one
million streetscapes. 2014 IEEE Conference on Com-
puter Vision and Pattern Recognition Workshops.
Naik, N., Raskar, R., and Hidalgo, C. A. (2016). Cities are
physical too: Using computer vision to measure the
quality and impact of urban appearance. American
Economic Review, 106(5):128–32.
Ordonez, V. and Berg, T. L. (2014). Learning high-level
judgments of urban perception. European Conference
on Computer Vision (ECCV).
Paszke, A., Gross, S., Massa, F., Lerer, A., Bradbury, J.,
Chanan, G., Killeen, T., Lin, Z., Gimelshein, N.,
Antiga, L., et al. (2019). Pytorch: An imperative style,
high-performance deep learning library. Advances
in neural information processing systems, 32:8026–
8037.
Redmon, J., Divvala, S., Girshick, R., and Farhadi, A.
(2016). You only look once: Unified, real-time object
detection. In Proceedings of the IEEE conference on
computer vision and pattern recognition, pages 779–
788.
Ren, S., He, K., Girshick, R., and Sun, J. (2016). Faster
r-cnn: towards real-time object detection with region
proposal networks. IEEE transactions on pattern
analysis and machine intelligence, 39(6):1137–1149.
Sampson, R. J. and Raudenbush, S. W. (2001). Disorder in
urban neighborhoods: Does it lead to crime. US De-
partment of Justice, Office of Justice Programs, Na-
tional Institute of . . . .
Schroeder, H. W. and Anderson, L. M. (1984). Perception
of personal safety in urban recreation sites. Journal of
leisure research, 16(2):178–194.
Simonyan, K. and Zisserman, A. (2014). Very deep con-
volutional networks for large-scale image recognition.
arXiv preprint arXiv:1409.1556.
Tokuda, E. K., Cesar, R. M., and Silva, C. T. (2019). Quan-
tifying the presence of graffiti in urban environments.
In 2019 IEEE International Conference on Big Data
and Smart Computing (BigComp), pages 1–4. IEEE.
Torii, A., Havlena, M., and Pajdla, T. (2009). From google
street view to 3d city models. In IEEE 12th Inter-
national Conference on Computer Vision workshops,
pages 2188–2195. IEEE.
Yoshimura, Y., He, S., Hack, G., Nagakura, T., and Ratti, C.
(2020). Quantifying memories: Mapping urban per-
ception. Mobile Networks and Applications, 25:1275–
1286.
Zhang, F., Zhou, B., Liu, L., Liu, Y., Fung, H. H., Lin, H.,
and Ratti, C. (2018). Measuring human perceptions
of a large-scale urban region using machine learning.
Landscape and Urban Planning, 180:148–160.
Zhao, Z.-Q., Zheng, P., Xu, S.-t., and Wu, X. (2019). Ob-
ject detection with deep learning: A review. IEEE
transactions on neural networks and learning systems,
30(11):3212–3232.
17K-Graffiti: Spatial and Crime Data Assessments in São Paulo City
975
