
Remote PPG Imaging by a Consumer-grade Camera under Rest and
Elevation-invoked Physiological Stress Reveals Mayer Waves and
Venous Outflow
Timothy Burton
1
, Gennadi Saiko
2a
and Alexandre Douplik
2,3 b
1
Department of Biomedical Engineering, Ryerson University, Toronto, Canada
2
Department of Physics, Ryerson University, Toronto, Canada
3
iBest, Keenan Research Centre of the LKS Knowledge Institute, St. Michael Hospital, Toronto, Canada
Keywords: Photoplethysmography, Microvasculature, Hemodynamics, Contactless, Remote, Bioimaging.
Abstract: Introduction: The photoplethysmographic (PPG) signal contains information about microvascular
hemodynamics, including endothelial-related metabolic, neurogenic, myogenic, respiratory, and cardiac
activities. The present goal is to explore the utility of a consumer-grade smartphone camera as a tool to
study such activities. Traditional PPG is conducted using a contact method, but the resultant contact
pressure can affect venous flow distribution and distort perfusion examination. This motivates us to develop
a remote PPG method (rPPG) to study such activities. Methods: We used an imaging setup composed of a
stand-mounted consumer grade camera (iPhone 8) with on-board LED illumination. The camera acquired
1920x1080 video data at 60 frames per second (fps); 90 second videos were captured for a hand in rest and
elevated positions. Spatial averaging was performed to extract rPPG, which was filtered using continuous
wavelet transform to analyse frequency ranges of interest. Results: The data demonstrated a plurality of
observed patterns, which differed between rest and elevation positions. In addition to cardiac and respiratory
activities, we noticed another two distinct low frequency patterns: oscillations that we conclude are likely
Mayer waves, and monotonic reflection increase (gravitational venous outflow). In some cases, these two
patterns are combined. Conclusions: rPPG demonstrated potential for venous compartment examinations.
a
https://orcid.org/ 0000-0002-5697-7609
b
https://orcid.org/ 0000-0001-9948-9472
1 INTRODUCTION
Photoplethysmography, or PPG, works by
measuring the changes in absorption of light through
tissue. The origin of the PPG signal is still a topic of
active debate, but the generally accepted origins,
which may also be correlated/overlapping, include
changes in blood volume within the tissue, position
and geometry of red blood cells, and mechanical
motion of capillaries (Kyriacou & Allen, 2021). In a
typical scenario, PPG measurements are collected at
a single wavelength, usually within the infrared
range (700-900 nm), at which hemoglobin absorbs
light at a reduced level. If the tissue oxygenation is
required, then two wavelengths (typically in red and
infrared ranges of spectrum) are used (Wukitsch et
al, 1988).
A conventional contact PPG signal can be
captured using one of two acquisition modes:
transmission or reflection. In transmission (most
used clinically), a light emitter and receiver are
positioned on either side of tissue (such as finger),
and the attenuated light is captured by the receiver
after transiting through the tissue. In contrast, in
reflection-mode PPG, the light emitter and receiver
are both situated on the same side of the tissue.
Emitted light interacts with the tissue, some of
which is backscattered and captured by the detector.
Popularity of this contact modality is increasing in
consumer applications, and can now be found in
multiple smart watches and other wearable devices.
In the most common scenario for the contact
PPG, pulse oxymetry, a wealth of physiological
information can be extracted from this single-point
measurement. In addition to the tissue oxygenation
Burton, T., Saiko, G. and Douplik, A.
Remote PPG Imaging by a Consumer-grade Camera under Rest and Elevation-invoked Physiological Stress Reveals Mayer Waves and Venous Outflow.
DOI: 10.5220/0010883100003123
In Proceedings of the 15th International Joint Conference on Biomedical Engineering Systems and Technologies (BIOSTEC 2022) - Volume 2: BIOIMAGING, pages 153-159
ISBN: 978-989-758-552-4; ISSN: 2184-4305
Copyright
c
2022 by SCITEPRESS – Science and Technology Publications, Lda. All rights reserved
153

(Nitzan & Engelberg, 2009), several other
physiological parameters can be extracted, including
heart rate (Temko, 2017), heart rate variability (Lin
et al., 2014), as well as respiratory rate (Daimiwa et
al., 2014). From this information, other parameters,
including blood pressure (Kurylyak et al., 2013), can
be inferred. However, the analysis of PPG signals
can be challenging, due to characteristics of
biological signals in general. For example, non-
stationarity, which is the time dependence of
statistical properties such as standard deviation and
mean in the signal, necessitates careful selection of
signal processing technique to accurately quantify
signal properties (Usui & Toda, 1991).
Remote PPG (rPPG) is an adaptation of
transmission mode PPG in which a camera is used to
capture the backscattered light from the tissue.The
primary advantage of remote PPG over contact PPG
lies in its contactless nature, rendering it suitable for
applications with sensitive tissue (such as wounds,
burns, neurological conditions, etc.) in addition to
addressing other limitations of contact PPG. For
instance, the contactless property means that it does
not rely on robust skin-to-sensor contact, which is
necessary for a strong PPG signal acquired using the
contact method. Maintaining high fidelity skin to
sensor contact is also made more difficult by the
sensor being mechanically fixed to the skin,
requiring external pressure (e.g., spring-loaded
finger clip) that can have a significant effect on PPG
signal quality and reproducibility. Further, contact
PPG has high sensitivity to motion artifacts, and
therefore requires the patient to stay very still.
In the most typical acquisition scenario, rPPG is
used to capture a single PPG signal over a whole
tissue area, such as the palm (Zheng et al., 2008) or
face (Zheng et al., 2009). However, the utility of
rPPG goes beyond tissue oxygenation. For example,
several PPG devices placed on the skin can be used
to extract pulse wave velocity (PWV), which
demonstrates a significant clinical value (e.g.
baPWV (Katakami et al., 2014)).
With a large enough field of view, the same data
can be collected using video rPPG, which registers
rPPG signals for segments of the field of view (in
contrast to a single signal from the entire field of
view). Several recently proposed imaging modalities
take advantage of the multi-pixel nature of rPPG and
aim to extract additional physiological information
from spatially resolved rPPG signals. For example,
(Saiko et al., 2021) used a high frame rate camera to
analyze pulse wave velocity in peripheral blood
vessels. Similarly, (Burton et al., 2021) used
spatially
resolved PPG signal to extract information
about tissue perfusion.
However, as we go beyond typical PPG utility,
complexity rises. The hemodynamics of the
microcirculation are extremely complex, with
multiple autoregulatory systems at play.
The predominant signal source in the PPG is the
cardiac pulsation caused by the ejection of blood
from the left ventricle during cardiac systole, which
affects the origins previously described. Heart rate
for normal subjects at rest varies from 60-100 beats
per minute (bpm) (John Hopkins Medicine, 2021).
Conservatively extending the lower bound to 50pm
to consider lower resting heart rates that can occur in
certain people, such as athletes (Doyen et al., 2019),
then the corresponding frequency range is 0.83-
1.67Hz. As previously mentioned, respiration can
also be extracted from PPG signals. The normal
respiration rate for a healthy subject is 12 to 20
breaths per minute (Cleveland Clinic, 2021),
corresponding to a frequency range of 0.20Hz-
0.33Hz.
The amplitude of PPG signals is known to be
low, which is attributed to a significant depth from
the originating tissue to the surface of the skin,
which photons must travel to register on the detector
(Moço et al., 2018). In particular, (Moço et al.,
2018) simulated photon propagation in a multi-
layered turbid media, configured to represent the
optical properties of six layers of skin in the palm or
finger pad, and found that the depth origin of the
PPG signal was from approximately 1.5-2mm under
the surface of the skin. This low amplitude signal
further contains oscillations in 0.01-0.02Hz, 0.02-
0.06Hz, 0.06-0.15Hz ranges corresponding to
endothelial related metabolic, neurogenic, and
myogenic activities, respectively (Li, 2006).
Finally, a lesser discussed signal which may be
present in the PPG are Mayer waves, which are
oscillations in blood pressure that typically occur at
a frequency of 0.1Hz (Julien, 2006). The mechanism
for Mayer waves is subject to active debate, but
recent findings advocate that the oscillations are
produced by a sympathetic baroreceptor response to
hemodynamic disturbances (Julien, 2006). Further,
Mayer waves have been demonstrated to have
clinical utility in prediction of hypertension. In a
longitudinal study, Mayer waves were extracted
from electrocardiograms (ECG) and their
characteristic frequency quantified. Five years after
ECG acquisition, investigators followed up with
subjects and observed that lower frequency Mayer
waves corresponded to an increased risk of primary
hypertension (Takalo et al., 1999). A related
mechanism for blood pressure regulation is the
myogenic vascular response (MVR), which is a non-
BIOIMAGING 2022 - 9th International Conference on Bioimaging
154

sympathetic vascular contraction in response to a
localized increase in blood pressure (Estañol et al.,
2016). As mentioned previously, MVR presents at a
similar frequency range to Mayer waves (0.06-
0.15Hz), presenting difficulty in distinguishing
between these two mechanisms.
In summary, rPPG can embed a variety of
signals. The aim of this project is to understand the
utility of consumer-grade cameras as a remote PPG
tool for microvascular hemodynamics investigations.
For these purposes, we designed a test where PPG
signals are captured with hands placed on a table
(baseline) and hands elevated (elevation stress). In
the first case (baseline), we expect that the hand will
be in physiological equilibrium. Thus, the normal
physiological autoregulation systems will be at play.
In the second test, we captured video of the hand
raised from the sitting position, immediately after
that raise. In this case, we expect that the system will
be out of equilibrium (elevation stress), and some
transient changes will occur. As a result, we
collected pilot rPPG data under rest and elevation
stress from a group of healthy subjects.
2 METHODS
2.1 Imaging Setup
In the present work, we used an imaging setup
composed of a stand-mounted consumer grade
camera (iPhone 8). Illumination was provided by the
on-board LED. The camera was configured to
acquire 1920x1080 video data at 60 frames per
second (fps), with auto-exposure and auto-focus
locked to disable automated adjustments during
acquisition. In the rest scenario, subjects were
seated, and hand placed on a table. The acquisition
was repeated for each hand. The camera was
positioned about 10cm above the subject’s hand, and
video captured for 90 seconds. In the elevation stress
scenario, the subject was seated with the chair
positioned perpendicular next to a wall. For the right
hand, the right side of the body was next to the wall,
and opposite for the left hand. The subject then
reached the hand as high as possible and placed it on
the wall. Data was then acquired for 90 seconds,
then repeated for the next hand. Some acquisitions
were also performed while subjects were holding
their breath to investigate the effect of respiration.
2.2 Data Processing
A region of interest (ROI) was manually chosen in
each video to exclude any non-anatomical features
in the video (i.e., the wall or table). Pixels outside of
the ROI were removed from the analysis, and every
second pixel (both row-wise and column-wise) were
removed for memory purposes (post-removal still
provided desired spatial resolution). To calculate the
rPPG, the pixel values were averaged across the ROI
for each frame, creating 60Hz time series for each of
the three colour channels (red, green and blue)
spanning the 90 seconds of acquisition. Filtering
with continuous wavelet transform (MATLAB
functions cwt and icwt) was performed from 0.075-
0.125Hz to isolate signal components that
correspond to Mayer waves and MVR, from 0.83-
1.67Hz for cardiac pulsations, and 0.20-0.33Hz for
respiration. As previously discussed, biological
signals such as PPG are typically non-stationary,
meaning that signal statistics such as mean and
standard deviation vary over time. Therefore, to
accurately capture amplitude at a specific frequency
while minimizing time sensitivity (since some
frequency content may only be transient and
therefore not of interest), an envelope methodology
was used. An envelope traces the extremes of a
signal, as defined by specific criteria (Johnson,
Sethares & Klein 2011); in this case, moving
minimum and maximum, for the lower and upper
envelopes, defined by the lower range of the
frequency band of interest. Once the envelopes are
evaluated, then the point-wise difference between
the upper and lower envelopes define the
instantaneous amplitude at any given time point.
Evaluating the median amplitude across the signal
reduces sensitivity to any transient changes in the
amplitude. This method was implemented using the
k-point moving maximum (MATLAB function
movmax) and k-point moving minimum (MATLAB
function movmin). k was configured to be
proportional to the lower bound of the filtering range
with the relationship (1/frequency)*fps. Therefore,
k=800 in the case of the Mayer wave / MVR signal,
k=72 for the cardiac signal and k=300 for
respiration.
2.3 Subjects
As an initial pilot investigation, data was collected
as described from 6 healthy subjects (5 male, with 1
over the age of 30, and 1 female under the age of 30)
under approval from the Ryerson University REB.
Remote PPG Imaging by a Consumer-grade Camera under Rest and Elevation-invoked Physiological Stress Reveals Mayer Waves and
Venous Outflow
155
The videos were captured on both hands, with hands
placed on a table (baseline) and hands elevated
(elevation stress) for a total of 24 videos. 2
additional videos were captured to assess impact on
the signal of breath holding.
3 RESULTS
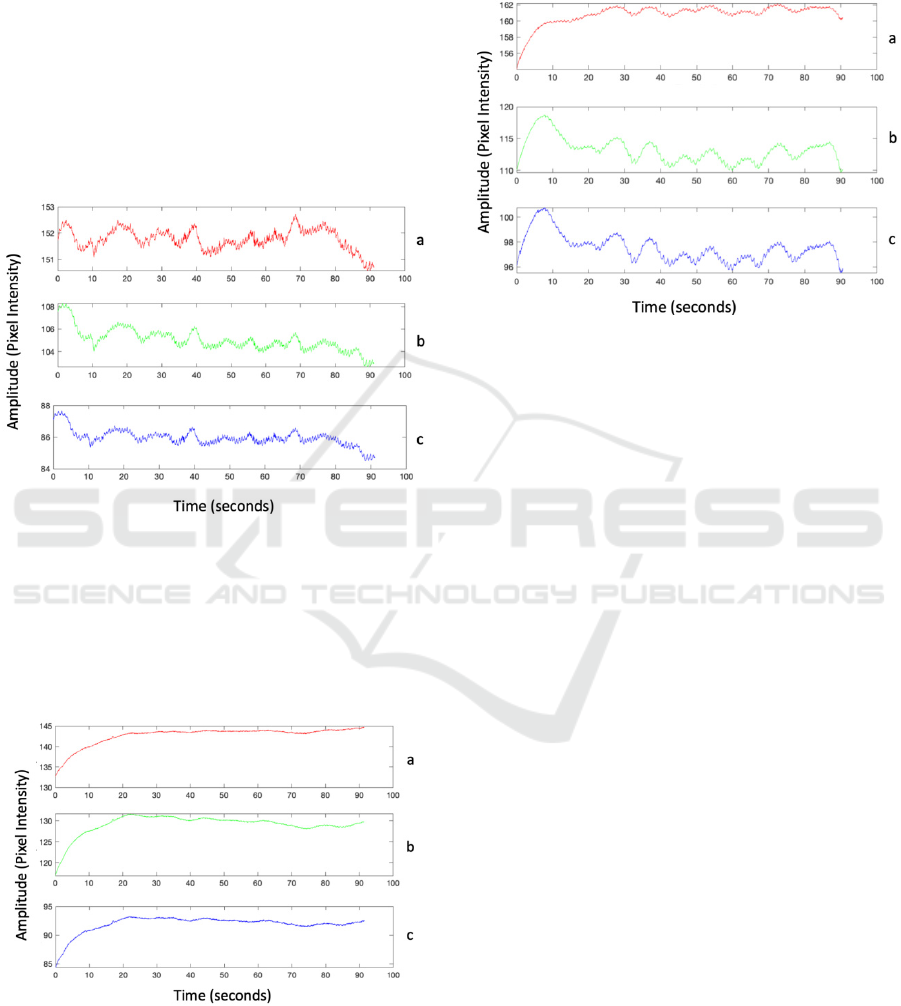
In the elevation stress signals, 3 of the 6 subjects
exhibited clear visually recognizable low-frequency
waves (see Figure 1).
Figure 1: An example of low frequency waves observed in
the raised hand position. Each subplot represents raw data
collected by red (a), green (b), and blue channels (c),
respectively.
In the elevation stress signals, 4 of the 6 subjects
exhibited a signal baseline change, specifically an
increasing amplitude (Figure 2).
Figure 2: An example of a monotonic reflection increase
observed in the raised hand position. Each subplot
represents raw data collected by red (a), green (b), and
blue channels (c), respectively.
2 subjects exhibited both low frequency waves and
monotonic reflection increase in their elevation
stress signals and are included in previous counts
(Figure 3).
Figure 3: An example of a hybrid behavior (a monotonic
reflection increases plus low frequency oscillations)
observed in the raised hand position. Each subplot
represents raw data collected by red (a), green (b), and
blue channels (c), respectively.
3 subjects exhibited baseline signals without any
distinguishing characteristics, as was expected
during physiological equilibrium. However, in the
remaining three subjects, an unknown high-
amplitude signal dominated the rPPG, which could
either be of either physiologic or external origin.
Due to the unknown providence of this signal, these
abnormal signals were excluded from the upcoming
analyses.
One possible explanation for the observed low
frequency waves is respiration. As previously
described, the expected respiration frequency is
0.20Hz-0.33Hz. While the frequency of these waves
appears to be lower frequency than this range, we
wanted to exclude their effect explicitly. For this
purpose, 2 subjects performed 30-second breath
holding in the elevated stress position. The low
frequency waves did not appear to be affected by
breath holding, leading us to exclude respiration in
favour of Mayer/MVR mechanism.
Figure 4 shows the variation in rPPG amplitudes
for respiration, Mayer/MVR and cardiac pulsations,
both at rest (3 subjects, each with 2 signals) and
elevation (6 subjects, each with 2 signals), across the
RGB channels. As would be expected, the green
colour channel generated the highest-amplitude
signals in the majority of cases, since it is most
sensitive to changes in oxygenated haemoglobin
concentration as compared to red and blue channels.
BIOIMAGING 2022 - 9th International Conference on Bioimaging
156
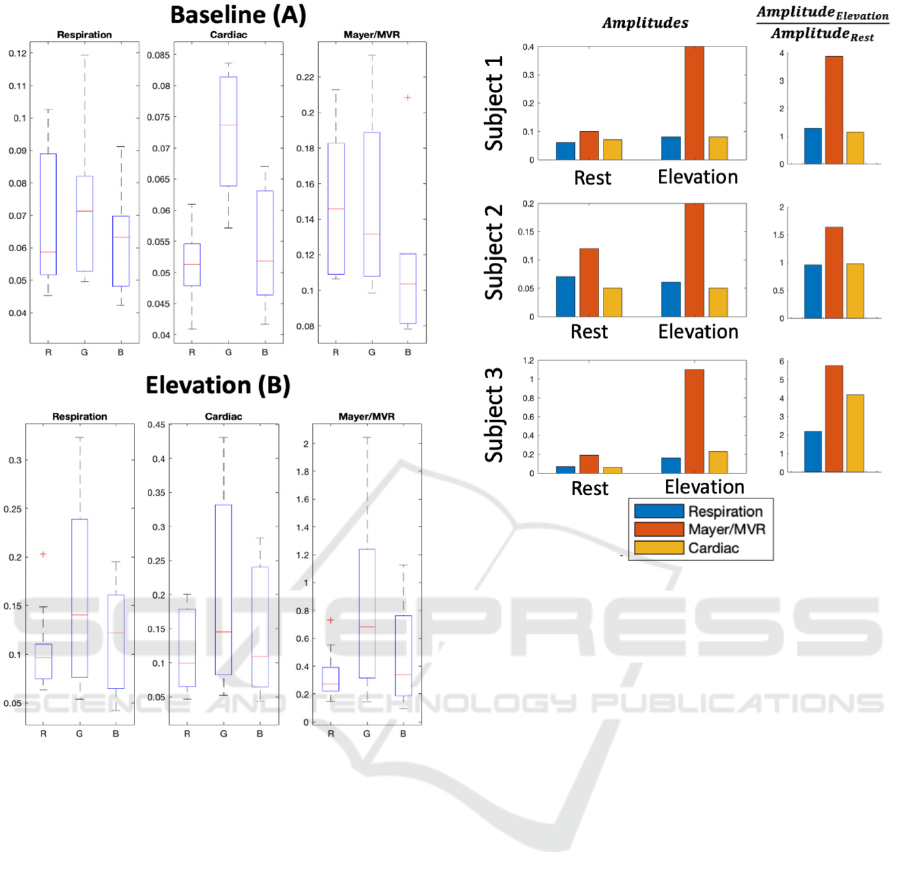
Figure 4: rPPG amplitudes of respiration, Mayer/MVR
and cardiac pulsations at rest (3 subjects, each with 2
signals) and elevation (6 subjects, each with 2 signals).
The median is represented by the red line, and the 25th
and 75th percentiles by the bottom and top of the box,
respectively. The whiskers extend to the furthest non-
outlying points (75th percentile + 1.5 x interquartile range
and 25th percentile - 1.5 x interquartile range), and the +
symbol represents outliers.
This observation corresponds with previously
published results (Verkruysse, 2008), serving as a
confirmation of the validity of the approach used
herein.
Figure 5 extends this analysis by directly
comparing the signal amplitudes across the rest and
elevation conditions (N=3, excluding the subjects
with abnormal baseline signals). The ranges
corresponding to cardiac, respiration and
Mayer/MVR all increase in amplitude during
elevation as compared to rest, with Mayer/MVR
exhibiting the largest increase.
Figure 5: Comparison of rPPG amplitudes at frequencies
corresponding to respiration, Mayer waves and cardiac
pulsations at rest and elevation across three subjects.
Amplitudes are shown on the left, and ratios comparing
elevation to rest on the right.
4 DISCUSSION
Here, we present an initial pilot investigation of the
microvasculature hemodynamics captured by a
smartphone camera. Data was collected as described
from six healthy subjects.
The collected data demonstrate the plurality of
observed patterns. In particular, in addition to
cardiac and respiratory activities two distinct
patterns; low frequency oscillations (Figure 1) and
monotonic reflection increase (Figure 2) are clearly
noticeable. In some cases, both these patterns are
combined (Figure 3).
We hypothesize that the low frequency
oscillations can be attributed to Mayer waves. While
Mayer waves share the same frequency range as
myogenic activities (0.06-0.15Hz), their origins are
different. Mayer waves are the sympathetic activity
with baroreflex activation. MVR is local and
independent of the sympathetic nervous
vasoconstriction. The elevation scenario performed
here is similar to a simulation performed by
Remote PPG Imaging by a Consumer-grade Camera under Rest and Elevation-invoked Physiological Stress Reveals Mayer Waves and
Venous Outflow
157

(Hammer & Saul, 2005), which found that a
reduction in blood volume (such as that which
occurs due to limb elevation) can perturb the
baroreflex (normally stable), and lead to the blood
pressure oscillations known as Mayer waves.
Therefore, we believe that it is more likely that the
observed low frequency waves are Mayer rather than
MVR, and the amplitude increase during elevation
stress represents a sympathetic response to the
reduction in blood volume. The increase in cardiac
amplitude during elevation stress further confirms
the effectiveness of the stressor, since it matches
previously published results (Hickey, 2015).
Speaking of the monotonic reflection increase
(Figure 2) mechanism, we hypothesize that it is
connected with gravitational venous outflow from
the raised hand. A decreasing concentration of
venous blood leads to decreased light absorption and
therefore increased light reflection and captured
signal intensity. It is particularly visible in the red
channel Figure 3). In this wavelength range, the
absorption of deoxyhemoglobin dominates over that
of oxyhemoglobin. Thus, we expect that this signal
is indicative of gravitational venous outflow.
It is typically assumed that the volume of
bloodheld in the venous compartment stays
relatively constant, leaving the major portion of the
PPG signal coming from the arterial side. However,
our experiments confirm the notion that in some
cases venous blood redistribution can be significant
and contribute to the PPG signal. It was also
observed in experiments with the occluded body
parts (see, for example, (Burton et al., 2021)), where
the oxyhemoglobin can be gradually converted into
deoxyhemoglobin; thus, increasing absorption and
decreasing the reflectance in the red range of
spectrum.
It also should be noted that blood redistribution
effects can be significant and may take up to 30
seconds, even in simple experiments. Thus, a
reasonable equilibration time should be properly
incorporated while planning experiments.
It should be noted that the current study involved
a very small number of subjects. Given the multitude
of observed patterns, these results are very
preliminary. Much broader studies are required to
come to meaningful conclusions, which will be the
focus of our future work. Further, including a
conventional contact PPG sensor on the non-
elevated hand will be considered in the future, as a
reference signal. Extension of our methodology to
imaging PPG, where maps visualize characteristics
of local PPGs across an area of tissue
(Kyriacou &
Allen,
2021), may also be beneficial to explore the
observed effects.
5 CONCLUSIONS
Remote PPG is a versatile tool, which can be used in
hemodynamic analysis.
PPGs can not only capture changes in arterial
blood, as previously asserted, but can also capture
changes in venous blood volume. As venous outflow
from tissue occurs, such as due to gravity when the
tissue is elevated, the volume of venous
(deoxygenated) blood is getting lower. Thus, the
absorption of the tissue decreases, resulting in more
reflection and therefore higher intensity registered
by rPPG. This result was clearly observed in several
volunteers (venous outflow pattern).
Such as skin pressure induced by the contact
PPG can affect venous flow distribution, the
noncontact nature of rPPG makes it an ideal tool for
venous compartment investigations.
ACKNOWLEDGEMENTS
The authors thank all the members of the Ryerson
photonics group for their support. The authors
acknowledge funding from NSERC Alliance
(Douplik & Saiko), NSERC Personal Discovery
(Douplik), NSERC RTI (Douplik), and Ryerson
Healthy Fund (Douplik).
REFERENCES
Burton T., Saiko G., Douplik A. Feasibility Study of
Remote Contactless Perfusion Imaging with
Consumer-Grade Mobile Camera. Submitted to Adv.
Exp. Med. Biol.
Cleveland Clinic. 2021. Vital Signs. [online] Available at:
https://my.clevelandclinic.org/health/articles/10881-
vital-sign. Accessed 22 October 2021.
Daimiwa N., Sundhararajan M., Shriram R. Respiratory
rate, heart rate and continuous measurement of BP
using PPG. 2014 International Conference on
Communication and Signal Processing. IEEE, 2014.
Doyen B., Matelot D., Carré F. Asymptomatic bradycardia
amongst endurance athletes. The Physician and sports
medicine (2019) 47(3): 249-252.
Estañol B., Rivera A., Memije R., Fossion R., Gómez F.,
et al. From supine to standing: in vivo segregation of
myogenic and baroreceptor vasoconstriction in
humans, Physiological Reports (2016); 4(24), e13053.
DOI:10.14814/phy2.13053
Hammer PE., Saul JP. Resonance in a mathematical model
of a baroflex control: arterial blood pressure waves
accompanying postural stress. Am J Physiol- Regul,
BIOIMAGING 2022 - 9th International Conference on Bioimaging
158

Integrative and Comparat Physiol (2005) 288: R1637-
R1648
Hickey M., Phillips J., Kyriacou P. The effect of vascular
changes on the photoplethysmographic signal at
different hand elevations. Physiolog Measur (2015)
36(3): 425.
Kurylyak Y., Lamonaca F., Grimaldi D. A Neural
Network-based method for continuous blood pressure
estimation from a PPG signal. 2013 IEEE Intern
instrumentation and measurement technology
conference (I2MTC). IEEE, 2013.
Kyriacou P., Allen J. Photoplethysmography: Technology,
Signal Analysis and Applications. Academic Press,
2021
John Hopkins Medicine. 2021. Vital Signs. [online]
Available at: https://www.hopkinsmedicine.org/health/
conditions-and-diseases/vital-signs-body-temperature-
pulse-rate-respiration-rate-blood-pressure. Accessed
22 October 2021.
Johnson C., Sethares W., Klein A. Software receiver
design: build your own digital communication system
in five easy steps. Cambridge University Press, 2011.
Julien C. The enigma of Mayer waves: facts and models.
Cardiovascular research (2006) 70(1):12-21.
Katakami N., Osonoi T., Takahara M. et al.. Clinical
utility of brachial-ankle pulse wave velocity in the
prediction of cardiovascular events in diabetic
patients. Cardiovasc. Diabetol. (2014) 13, 128.
Lin, W., et al. Comparison of heart rate variability from
PPG with that from ECG. The international
conference on health informatics. Springer, Cham,
2014.
Moço A., Andreia V., Stuijk S., de Haan G. New insights
into the origin of remote PPG signals in visible light
and infrared. Scientific Reports (2018) 8(1): 1-15.
Nitzan M., Engelberg S. Three-wavelength technique for
the measurement of oxygen saturation in arterial blood
and in venous blood. J Biomed Opt (2009) 14(2):
024046.
Saiko G., Dervenis M., Douplik A. On the Feasibility of
Pulse Wave Velocity Imaging for Remote Assessment
of Physiological Functions. Adv Exp Med Biol.
(2021)1269:393-397. doi: 10.1007/978-3-030-48238-
1_62. PMID: 33966248
Temko, A. Accurate heart rate monitoring during physical
exercises using PPG. IEEE Transactions on
Biomedical Engineering (2017) 64(9): 2016-2024.
Li Z., Leung J., Tam E., Mak A. Wavelet analysis of skin
blood oscillations in persons with spinal cord injury
and able-bodied subjects. Arch Phys Med Rehabil
(2006) 87:1207-12
Takalo R., et al. Circadian profile of low-frequency
oscillations in blood pressure and heart rate in
hypertension. Am J Hypertension (1999) 12(9): 874-
881.
Usui S., Toda N. An overview of biological signal
processing: non-linear and non-stationary aspects.
Frontiers of Medical and Biological Engineering: the
International Journal of the Japan Society of Medical
Electronics and Biological Engineering (1991)
3(2):125-129.
VerkruysseW., Lars S., Nelson J. Remote
plethysmographic imaging using ambient light. Optics
express (2008) 16(26): 21434-21445.
WukitschM., et al. Pulse oximetry: analysis of theory,
technology, and practice. J clinical monitoring (1988)
4(4): 290-301.
Zheng J., et al. Remote simultaneous dual wavelength
imaging photoplethysmography: a further step towards
3-D mapping of skin blood microcirculation.
Multimodal Biomedical Imaging III. (2008) Vol. 6850.
International Society for Optics and Photonics.
Zheng J., et al. A remote approach to measure blood
perfusion from the human face. Advanced Biomedical
and Clinical Diagnostic Systems (2009) VII. Vol.
7169. International Society for Optics and Photonics.
Remote PPG Imaging by a Consumer-grade Camera under Rest and Elevation-invoked Physiological Stress Reveals Mayer Waves and
Venous Outflow
159
