
An Approach for Parameters Evaluation in Layered Structural
Materials based on DFT Analysis of Ultrasonic Signals
Aleksandrs Sisojevs
1a
, Alexey Tatarinov
2b
, Mihails Kovalovs
1c
, Olga Krutikova
1d
and Anastasija Chaplinska
2
1
Riga Technical University, 1 Kalku Str. Riga, Latvia
2
Institute of Electronics and Computer Science, 14 Dzerbenes Str., Riga, Latvia
anastasija.caplinska@edu.rtu.lv
Keywords: Pattern Recognition, DFT, Ultrasonic Testing, Bone, Concrete.
Abstract: An adequate assessment of the condition of versatile structural materials of different origin, from hard
biological tissues (cortical bone) to objects of engineering infrastructure facilities (concrete), may encounter
difficulties due to their complex and multilayer structure. Traditional ultrasonic testing based on the
measurement of single parameters do not allow separating the complex influences of acting factors. Thus, the
diagnosis of osteoporosis is complicated by the adverse influence of the thickness of the layer of soft tissue
covering bone, when assessing the porosity of the bone. In the evaluation of deterioration processes in
concrete, it is important to discriminate the depth of the deteriorated surface layer of concrete and the degree
of the material degradation in this layer. The evaluation approach implementing the methods of pattern
recognition has been proposed. The initial data set comprised ultrasonic signals obtained at different
frequencies in specimens with different values of the parametrs according to a planned grid of the parameters
of ineterest. The signals were obtained by surface profiling of the specimens by a pair of emitting and
receiving transducers. In this study, an approach to evaluate parameters of interest using pattern recognition
methods applied to ultrasonic signals processed by the Digital Fourier Transform was verified. The estimation
model was based on the statistical analysis of the magnitude of the spectrum of the original ultrasonic signals.
Decision rules were created based on the testing of a number of specimens forming the training set and
calculation of the statistical criteria. Comparative testing of examination specimens demonstrated the
adequacy of the proposed method as a potentially universal approach for evaluation of different kind of objects.
1 INTRODUCTION
An adequate assessment of the condition of versatile
structural materials of different origin may encounter
difficulties due to their complex and multilayer
structure, where different factors interfere. Ultrasonic
testing has established itself as a sensitive tool for
characterization of materials’ properties and
conditions in a broad range of the materials from hard
biological tissues (cortical bone) to objects of
engineering infrastructure facilities (concrete)
(Kundu, 2003). Nevertheless, traditional approaches
based on the measurement of single parameters such
a
https://orcid.org/0000-0002-2267-4220
b
https://orcid.org/0000-0002-5787-2040
c
https://orcid.org/0000-0001-9432-1240
d
https://orcid.org/0000-0001-8474-491X
as ultrasound velocity, although it is an
acknowledged indicator of the material strength, do
not allow separating the complex influences of acting
factors. This prompts the development of new
diagnostic approaches and the use of more
sophisticated data processing, in particular, using
artificial intelligence methods.
Ultrasonic techniques based on measuring the
parameters of elastic waves is a perspective modality
to assess bone conditions in respect of osteoporosis
(Laugier, 2008). Axial bone ultrasonometers use to
measure ultrasound velocity in the compact bone of
long bones, such as the tibia and forearm bones.
Sisojevs, A., Tatarinov, A., Kovalovs, M., Krutikova, O. and Chaplinska, A.
An Approach for Parameters Evaluation in Layered Structural Materials based on DFT Analysis of Ultrasonic Signals.
DOI: 10.5220/0010878400003122
In Proceedings of the 11th International Conference on Pattern Recognition Applications and Methods (ICPRAM 2022), pages 307-314
ISBN: 978-989-758-549-4; ISSN: 2184-4313
Copyright
c
2022 by SCITEPRESS – Science and Technology Publications, Lda. All rights reserved
307

Although it demonstrated the sensitivity to
osteoporosis and mineralization disorders, its clinical
use is compromised by the inability to discern
multiple factors influencing the bone condition by
this single input. New approaches are focused on the
analysis of guided waves propagation at several
frequencies that provides extensive information about
the bone structure and properties (Tatarinov, 2014).
However, discrimination of the factors of interest
such as cortical porosity and thickness of the cortical
layer against the background of the influence of the
surrounding soft tissues requires advanced data
processing.
Concrete is the most widely used building
material being the basis of industrial and civil
buildings and objects of infrastructure. Industrialized
countries face the problem of ageing infrastructures
that were built mostly in the second half of the 20th
century and face deterioration due to environmental
and inner factors (Breugel, 2017). Therefore, it is
necessary of the adequate quality control and
monitoring of the condition. Since the ingress of
corrosive species and the harmful influence of water
on the porous structure of concretes, especially
combined with the action of frost, is initiated at the
concrete surface, it is important to know how deep the
deterioration processes are expanded into the depth of
the concrete bulk. Ultrasound pulse velocity (UPV)
has proved itself as an adequate indicator of strength
for a certain class of cementation materials such as
hardening and mature concretes, cements and etc.,
where the elastic modulus and strength changed
proportionally (Komlos
̆
, 1996). However,
traditionally used UPV, a single parameter measured
at a certain frequency cannot represent the
deterioration as a volumetric process, where changes
occur gradually from the surface towards inner layers
on an unknown depth. The idea of using ultrasonic
surface waves at different frequencies has been put
forward to assess the condition of the surface layer of
concrete by depth is based on the known dependence
of the penetration depth of Rayleigh waves its
wavelength, inversely proportional to the frequency
(Victorov, 1967).
The purpose of this study was to propose within
certain limits a universal approach for evaluation at
least two independent parameters of an examined
object, the values of which are a-priori unknown. To
solve this task, the data from a set of similar objects
where the values of these parameters are a priori
known is used. The very formulation of the problem
suggests the need to use pattern recognition methods,
but unlike the classical classification problem, in this
case there is no need to determine the belonging of
the object under study to any known class. In this case,
it is necessary to determine only the values of two
parameters of the investigated object.
The raw data were presented by sets of ultrasonic
signal acquired stepwise by surface profiling of the
object in the pitch-catch mode. The discrete Fourier
transform (DFT), one of the recognized methods of
signal analysis, transforming the signals from time to
frequency domains was used (Stone, 2021). A set of
statistical parameters was extracted from the set of
magnitude signals, thus forming a set of features
describing the object. Extracting statistical
parameters from each object in the set, decision rules
are created to be the instrument for the evaluation of
parameters of interest in the examined objects.
To show the universality of the approach, its
performance was tested in two different materials,
which had different parameters of interest and
belonged to different areas. The first class of objects
was bone tissue in respect of osteoporosis, the
problem related to medical diagnostics. The
osteoporosis condition was modelled by tissue
mimicking phantoms. The second class of objects
was concrete with gradually deteriorated surface
layer, both by the material quality and by expansion
of deterioration in depth, the problem of technical
diagnostics in construction and maintenance of
infrastructure.
2 PROPOSED APPROACH
The proposed approach for evaluation for object
parameters in two experiments is based on the
principles of pattern recognition. The evaluation
method consists of two parts: creating a set of
decision rules using the data for a training set of
specimens and validation the set of decision rules by
substitution the data for an examination specimen to
make sure that the proposed approach is correct.
2.1 Ultrasonic Testing
Acquisition of ultrasonic signals was carried out by
the surface profiling of specimens by a pair of
emitting and receiving ultrasonic transducers. To vary
the wavelength and thus the penetration depth of
ultrasonic surface wave into the object, the testing
was repeatedly done at two ultrasonic frequencies:
100 and 450 kHz I bone phantoms and 50 and 100
kHz in concrete specimens. The excitation signals
were two-period sine tone-bursts. The signals were
recorded by moving the receiver from 20 to 120 mm
ICPRAM 2022 - 11th International Conference on Pattern Recognition Applications and Methods
308

far from the emitter with a step of 5 mm by the
specimen’s surface.
Two series of objects of interest were investigated:
a) Bone phantoms modelling osteoporosis, where 3
grades of bone condition were simulated by thin
polymer plates with gradually varied inner
porosity of 0, 10 and 25%. The specimens were
covered by natural soft tissues of thicknesses 0, 2
and 5 mm. The parameters of interest in the
evaluation were the bone condition on the scale
“norm-osteoporosis” and the thickness of the soft
layer. Thus, the grid in the training set of
specimens included 3 grades of bone condition
and 3 grades of soft tissue thickness, totally 9
objects.
b) Deteriorated surface of concrete, where 7 grades
of depths of deterioration from 0 to 40 mm and 4
grades of the material quality in the weak surface
layer (cement-to-sand ratios 1:3; 1:4; 1:7 and
1:12) were provided in a series of concrete
specimens. The grid of the training series
contained 21 object.
2.2 Creation of Decision Rules
Step 1: For one specimen with a priori known
thickness of the "weak" concrete layer, three signals
were recorded at frequencies of 50, 100 and 200 kHz.
The result was three discrete signals 𝑠
(
𝑡
)
.
Step 2: Each of the discrete signals 𝑠
(
𝑡
)
( 𝑡∈
[
𝑡_𝑚𝑖𝑛;𝑡_𝑚𝑎𝑥
]
) is converted by discrete Fourier
transform (DFT) into the spectral signal 𝑀
(
𝜔
)
, (𝜔∈
[
𝜔_𝑚𝑖𝑛;𝜔_𝑚𝑎𝑥
]
) describing the magnitude
spectrum:
𝑀
(
𝜔
)
=
𝑅𝑒
(
𝜔
)
+𝐼𝑚
(
𝜔
)
where:
𝑅𝑒
(
𝜔
)
=𝑠
(
𝑡
)
∙𝑐𝑜𝑠
2𝜋∙𝑡∙𝜔
𝑡
−𝑡_𝑚𝑖𝑛
_
_
and
𝐼𝑚
(
𝜔
)
=𝑠
(
𝑡
)
∙𝑠𝑖𝑛
2𝜋∙𝑡∙𝜔
𝑡
−𝑡_𝑚𝑖𝑛
_
_
In further processing, the considered interval 𝜔
satisfied the following conditions:
𝑀
(
𝜔
)
≥𝜀1∙𝑚𝑎𝑥
𝑀
(
𝜔
)
and
𝜔≤0,5∙
(
𝜔_𝑚𝑎𝑥− 𝜔_𝑚𝑖𝑛
)
Step 3: In the selected interval ω, the values of three
functions were calculated:
𝐹_𝑚𝑎𝑥
(
𝜔
)
=𝑚𝑎𝑥
𝑀
(
𝜔
)
;
𝐹
(
)
=𝑎𝑣𝑒𝑟𝑎𝑔𝑒
𝑀
(
𝜔
)
and
𝐹_𝑚𝑖𝑛
(
𝜔
)
=𝑚𝑖𝑛
𝑀
(
𝜔
)
Step 4: Statistical tests were performed in the interval
ω selected in Step 3.
Criterion #1: the number of 𝜔 values that fulfill
the condition:
𝐹
(
)
≥𝑎𝑣𝑒𝑟𝑎𝑔𝑒𝐹_𝑚𝑎𝑥
(
𝜔
)
,(𝑐𝑟#1);
Criterion #2: the ratio between the maximal
values of the functions 𝐹_𝑚𝑖𝑛
(
𝜔
)
and 𝐹_𝑚𝑎𝑥
(
𝜔
)
:
𝑐𝑟#2=
𝑚𝑎𝑥𝐹_𝑚𝑖𝑛
(
𝜔
)
𝑚𝑎𝑥𝐹_𝑚𝑎𝑥
(
𝜔
)
Criterion #3: the ratio of the maximum derivative
value for the function 𝐹_𝑚𝑎𝑥
(
𝜔
)
to the maximal
value for the function 𝐹_𝑚𝑎𝑥
(
𝜔
)
:
𝑐𝑟#3=
𝑚𝑎𝑥
|
𝑑𝐹_𝑚𝑎𝑥
(
𝜔
)|
𝑚𝑎𝑥𝐹_𝑚𝑎𝑥
(
𝜔
)
where:
𝑑𝐹_𝑚𝑎𝑥
(
𝜔
)
=𝐹_𝑚𝑎𝑥
(
𝜔
)
−𝐹_𝑚𝑎𝑥
(
𝜔−1
)
.
Criterion #4: the ratio of the maximum
derivative of function 𝐹_𝑎𝑣𝑟
(
𝜔
)
to the maximal
value for the function 𝐹_𝑚𝑎𝑥
(
𝜔
)
:
𝑐𝑟#4=
𝑚𝑎𝑥
|
𝑑𝐹_𝑎𝑣𝑟
(
𝜔
)|
𝑚𝑎𝑥𝐹_𝑚𝑎𝑥
(
𝜔
)
where:
𝑑𝐹_𝑎𝑣𝑟
(
𝜔
)
=𝐹_𝑎𝑣𝑟
(
𝜔
)
−𝐹_𝑎𝑣𝑟
(
𝜔−1
)
.
Criterion #5: the ratio of the maximum
derivative of function 𝐹_𝑚𝑖𝑛
(
𝜔
)
to the maximal
value for the function 𝐹_𝑚𝑎𝑥
(
𝜔
)
:
𝑐𝑟#5=
𝑚𝑎𝑥
|
𝑑𝐹_𝑚𝑖𝑛
(
𝜔
)|
𝑚𝑎𝑥𝐹_𝑚𝑎𝑥
(
𝜔
)
where:
𝑑𝐹_𝑚𝑖𝑛
(
𝜔
)
=𝐹_𝑚𝑖𝑛
(
𝜔
)
−𝐹_𝑚𝑖𝑛
(
𝜔−1
)
.
Critera #6, #7 and #8: approximation of function
𝐹_𝑚𝑎𝑥
(
𝜔
)
by quadric polynomial:
𝐹
(
𝜔
)
=𝑐𝑟#6∙𝜔
+𝑐𝑟#7∙𝜔+𝑐𝑟#8, where
polynomial coefficients can be found using the
method of least squares:
An Approach for Parameters Evaluation in Layered Structural Materials based on DFT Analysis of Ultrasonic Signals
309
𝑐𝑟#6
𝑐𝑟#7
𝑐𝑟#8
=
[
𝑊
]
∙
⎝
⎜
⎜
⎜
⎛
𝜔
∙𝐹_𝑚𝑎𝑥
(
𝜔
)
𝜔
∙𝐹_𝑚𝑎𝑥
(
𝜔
)
𝐹_𝑚𝑎𝑥
(
𝜔
)
⎠
⎟
⎟
⎟
⎞
where:
[
𝑊
]
=
⎝
⎜
⎜
⎜
⎛
𝜔
𝜔
𝜔
𝜔
𝜔
𝜔
𝜔
𝜔
𝜔
−𝜔
⎠
⎟
⎟
⎟
⎞
Criterion #9: the ratio between the maximal
values of functions 𝐹_𝑎𝑣𝑟
(
𝜔
)
and 𝐹_𝑚𝑎𝑥
(
𝜔
)
:
𝑐𝑟#9=
𝑚𝑎𝑥𝐹_𝑎𝑣𝑟
(
𝜔
)
𝑚𝑎𝑥𝐹_𝑚𝑎𝑥
(
𝜔
)
Criteria #10 - #13: the integral criteria defined as
the ratios of the areas bounding functions 𝐹_𝑚𝑖𝑛
(
𝜔
)
,
𝐹_𝑎𝑣𝑟
(
𝜔
)
and 𝐹
(
)
. The criteria were calculated
as follows:
𝑐𝑟#10=
; 𝑐𝑟#11=
;
𝑐𝑟#12=
; 𝑐𝑟#13=
where:
𝑆
=
1
𝑚𝑎𝑥
𝐹_𝑚𝑎𝑥
(
𝜔
)
∙𝐹_𝑚𝑖𝑛
(
𝜔
)
_
_
𝑆
=
1
𝑚𝑎𝑥
𝐹_𝑚𝑎𝑥
(
𝜔
)
∙𝐹_𝑎𝑣𝑟
(
𝜔
)
_
_
𝑆
=
1
𝑚𝑎𝑥
𝐹_𝑚𝑎𝑥
(
𝜔
)
∙𝐹_𝑚𝑎𝑥
(
𝜔
)
_
_
2.3 Use of Decision Rules
The approach to assess the parameters of object using
decision rules consisted of the following steps.
Step 1: For the examination specimen, which is a test
for the decision rules, steps 1-4 from the section
“Creation of decision rules” (3.1.) were repeated.
Step 2: The values set of parameters was divided into
a certain number of intervals. In each interval of
parameters, each i-th statistical criterion of the control
specimen 𝑐𝑟#𝑥[𝑖] was compared with the
corresponding i-th decision rule 𝑅𝑢𝑙𝑒[𝑖] within the
accuracy range ±∆:
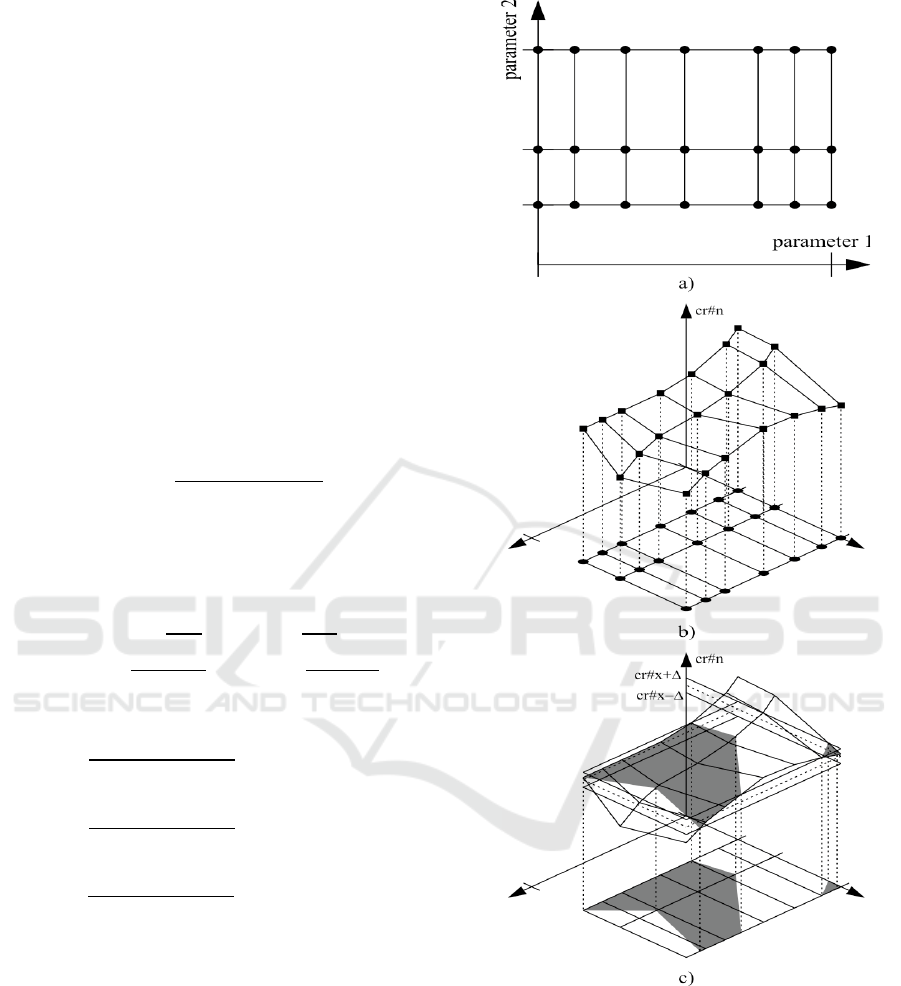
Figure 1: a) Topology of initial data, b) decision rule for
selected criterion c) use of decision rule for a recognition
case.
𝑐𝑟#𝑥[𝑖]− ∆≤𝑅𝑢𝑙𝑒[𝑖]≤𝑐𝑟#𝑥[𝑖] + ∆
=
𝑡𝑟𝑢𝑒 𝑠_𝑐𝑟[𝑖]=1
𝑓𝑎𝑙𝑠𝑒 𝑠_𝑐𝑟[𝑖]=0
where:
∆=0,5 ∙ 𝜀2 ∙ 𝑚𝑎𝑥
(
𝑅𝑢𝑙𝑒
[
𝑖
]
)
−𝑚𝑖𝑛
(
𝑅𝑢𝑙𝑒
[
𝑖
]
)
𝜀2 – the relative error of value 𝑐𝑟#𝑥[𝑖];
ICPRAM 2022 - 11th International Conference on Pattern Recognition Applications and Methods
310
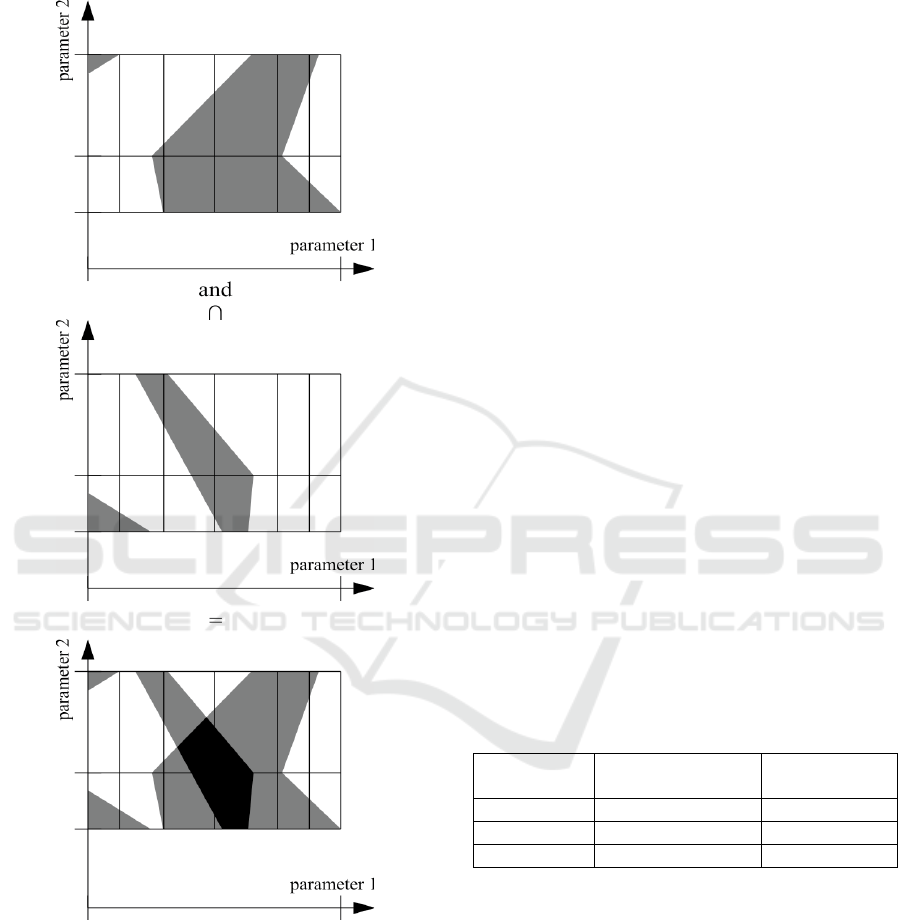
𝑠_𝑐𝑟 – the number of intersections in the interval.
Fig.2 illustrates the use of the decision rule sum for
two criterion.
Figure 2: Illustration of finding the area of a probable
solution using the superposition of two decision rules.
Step 3: At each interval, the number of intersections
of the set of statistical criteria with the corresponding
decision rules was computed as
𝑠𝑢𝑚=𝑠_𝑐𝑟[𝑖]
The interval, where the number of the intersections
𝑠𝑢𝑚 is maximal, gives the final estimate of the
factors of interest of parameters for the control
specimen.
3 RESULTS
The validation of the proposed approach comprised
two types of experiments:
1) assessment of the state of the bone phantom by the
parameters of interest: the degree of inner porosity
(the parameter of the main diagnostic interest) and
the thickness of the soft tissue layer (a side factor).
2) assessment of concrete condition by the
parameters of interest: the thickness of “weak”
concrete layer or the depth of the deterioration and
the quality of “weak” concrete in terms of its
composition. Both parameters are diagnostically
important in this case.
In each of the experiments, the datasets in each object
were obtained at two ultrasonic frequencies:
• 100 kHz and 450 kHz in bone phantoms;
• 50 kHz and 100 kHz in concrete specimens.
3.1 Evaluation of Bone Phantom’s
Parameters
Based on the obtained 13 decision rules, a test was
made on 3 samples with the values of osteoporosis
grade and soft tissues thickness, which were not
presented in the training set (Table1).
Table 1: Parameters of test bone phantoms.
Object Osteoporosis
grade
Soft tissue
thickness, mm
X 1 3
Y 2 4
Z 5 1
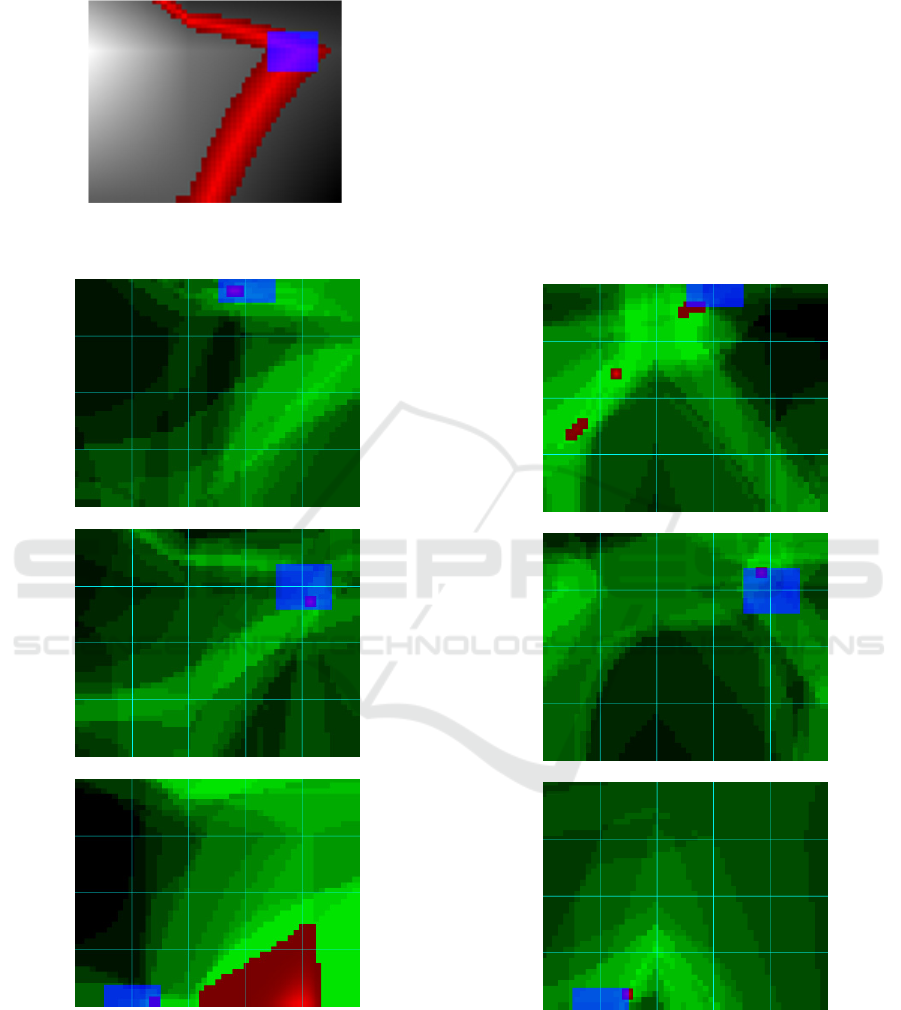
An example is given in Figure 3, where the area of
possible solutions is shown in red, the correct answer
is shown in a blue rectangle.
Experiment #1.
In the first experiment, a frequency of 100 kHz and
bilinear interpolation in the decision rules were
chosen. The values of ε2 s for all objects of the
examination sample were chosen experimentally
0.03. Regions of probable solutions for 3 examination
objects in the test series are given in Figure 4 and
correspond to the highest concentration of
An Approach for Parameters Evaluation in Layered Structural Materials based on DFT Analysis of Ultrasonic Signals
311
intersections of all decision rules. The known values
of parameters are shown by blue rectangles.
Figure 3: Region of interest for cr#5, Y object and bilinear
interpolation.
X
Y
Z
Figure 4: Results of Experiment#1 for 3 test cases (X, Y, Z
in Table 1). The abscissa shows the values of the thickness
of the layer of soft tissues in ascending order from left to
right, along the ordinate the values of porosity are plotted
in ascending order from top to bottom.
As it is seen in Figure 4, objects X and Y are
classified quite accurately. Object Z has large extra
regions at the top and right bottom corner of the field
that may misinterpret the evaluation.
Experiment #2.
In the second experiment, a frequency of 450 kHz and
bilinear interpolation in the decision rules were
chosen. Regions of probable solutions for 3
examination objects in the test series known values of
parameters compared to known values of parameters
(blue rectangles) are shown by blue rectangles are
given in Figure 5. The highest concentration of
intersections of all decision rules allow accurate the
classification
of the test objects. However, in this
X
Y
Z
Figure 5: Results of Experiment#2 for 3 test cases (X, Y, Z
in Table 1) The abscissa shows the values of the thickness
of the layer of soft tissues in ascending order from left to
right, along the ordinate the values of porosity are plotted
in ascending order from top to bottom.
ICPRAM 2022 - 11th International Conference on Pattern Recognition Applications and Methods
312
experiment as well, there are extra intersections that
do not correspond to the right solutions in all objects.
The results of Experiment#1 and Experiment#2
obtained at different frequencies mostly coincide.
Meanwhile, the areas of false intersections of
decision rules are located differently. The
combination of data of the both experiments allow to
find the correct solution with the best coincidence and
to reject false intersections that are not confirmed by
the results obtained at another ultrasonic frequency.
3.2 Evaluation of Concrete Parameters
Experimental verification of the proposed method
included several practical experiments. The initial
data contained a set of signals in 7x3=21 specimens
with thickness of the “weak” concrete 0, 3, 5, 12, 20,
25, 30, 35, 40 mm and quality of concrete (ratio
“cement/sand”) 1/12, 1/7 and 1/4. The data for each
specimen was composed of 3 discrete signals
obtained at ultrasonic frequencies 50, 100 and 200
kHz, consequently.
This set of specimens was divided into the training
and examination sets. The total number of specimens
in the training set was 21. The examination set
included 3 specimens of thicknesses of the “weak”
concrete layer 3 and 25 mm and different grades of
the cement/sand ration. The error values in all
experiments were selected ε
1
=0,08 and ε
2
=0,05.
Experiment #3.
In the 3rd experiment, a specimen with a “weak”
concrete layer thickness of 3 mm and ratio
“cement/sand” of 1/7, scanning frequency 50 kHz
was selected as an examination one.
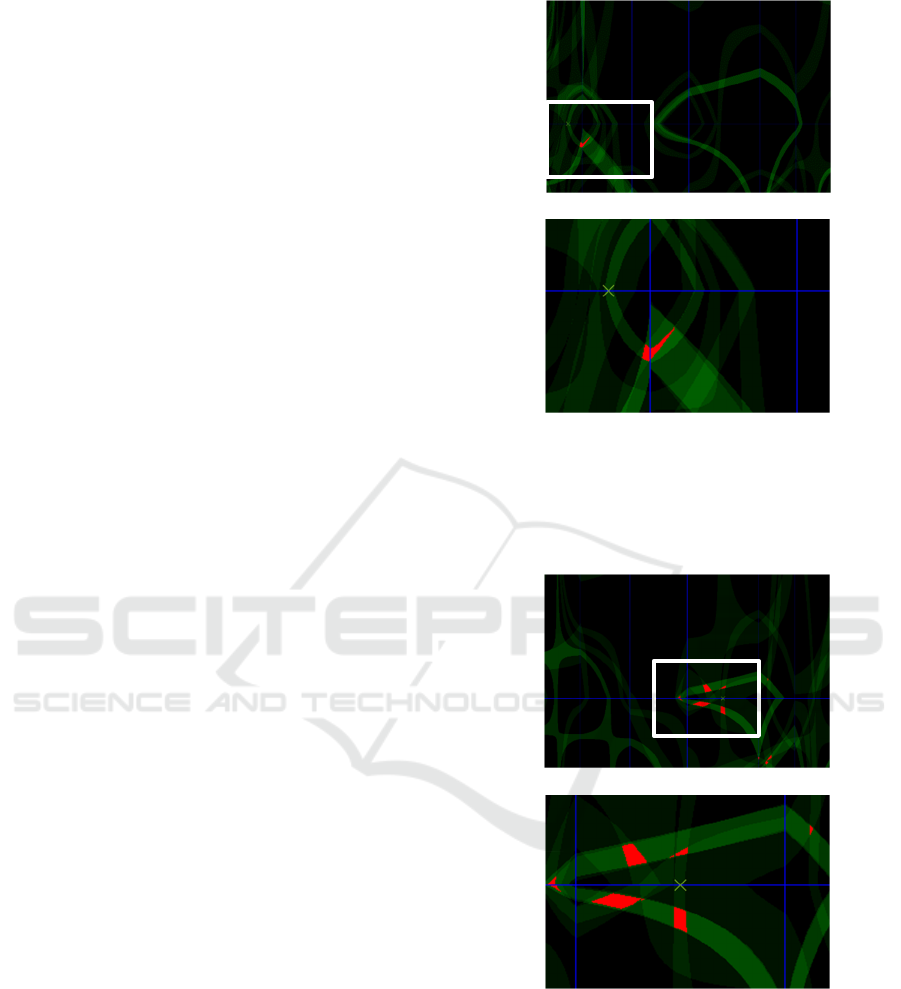
The results of final evaluation for the examination
specimen and an illustration of computation of the
segment of interest by using all 13 decision rules for
frequency 50 kHz are shown in Figure 6. The taken
result shows that proposed approach gives the
evaluation with an approximately error of 1 mm by
thickness and approximately 0.1 by the ratio
“cement/sand”.
Experiment #4.
In the 4th experiment, a specimen with a “weak”
concrete layer thickness of 25 mm and ratio
“cement/sand” of 1/7, scanning frequency 50 kHz
was selected as an examination one.
The results of final evaluation using 13 decision
rules for frequency 50 kHz are shown in Figure 7. The
proposed approach gave the specimen evaluation
with approximately error 5 mm by the thickness and
approximately 0.1 by the ratio “cement/sand”.
a)
b
)
Figure 6: Results of Experiment#3, a) original, b) enlarged
fragment. The abscissa shows the values of the thickness of
the “weak” concrete layer in ascending order from left to
right, along the ordinate the values cement/sand ratio are
plotted in ascending order from top to bottom.
a)
b
)
Figure 7: The result of final evaluation for test specimen
(thickness = 25 mm, ratio = 1/7), a) original, b) enlarged
fragment. The abscissa shows the values of the thickness of
the “weak” concrete layer in ascending order from left to
right, along the ordinate the values cement/sand ratio are
plotted in ascending order from top to bottom.
Experiment #5
In the next experiment, two specimens with a “weak”
concrete layer thickness of 3 mm and ratios
An Approach for Parameters Evaluation in Layered Structural Materials based on DFT Analysis of Ultrasonic Signals
313

“cement/sand” of 1/7 and 1/4 were evaluated using
the data obtained at ultrasonic frequency 100 kHz.
The results of final evaluation are shown in Figure 8.
In specimen 1/7 (Figure 8a), an approximately
equivalent evaluation was obtained comparing with
the same evaluation in Experiment#3 at 50kHz
despite the fact that pattern lines of the decision rules
intersections at 50 and 100 kHz had completely
different patterns. The specimen with the ratio 1/4
(Figure 8b) had at least two distant solutions, where
only one was adequate within the accuracy tolerance.
This emphasizes the need to improve algorithms and,
in particular, to introduce various influence weights
for informative rules.
a)
b
)
Figure 8: The result of final evaluation for test specimen
(thickness = 3 mm,), a) ratio = 1/7, b) ratio = 1/4. The
abscissa shows the values of the thickness of the “weak”
concrete layer in ascending order from left to right, along
the ordinate the values cement/sand ratio are plotted in
ascending order from top to bottom.
4 CONCLUSIONS
Despite the small number of initial experimental data,
the proposed approach based on DFT analysis of sets
of ultrasonic signals demonstrated an adequate
estimate of the parameters of interest in different
classes of materials and different diagnostic tasks.
The method proposes a perspective for the
implementation both in biomedical area, particularly,
for the diagnosis of the state of bone tissue, and in
technical expertise for testing the quality of surface
layers of structural materials (concrete) and assessing
the degree of their degradation. The approach was
principally verified in bone phantoms modelling the
osteoporosis condition and in concrete specimens
with the gradually degraded surface layer. The
parameters of interest were determined with a
satisfactory accuracy within a reasonable tolerance. A
complex use of ultrasonic signals in the surface
transmission at different frequencies can help finding
the only correct solution and avoidance of false ones.
Improvement of the reliability and accuracy of the
proposed approach can be achieved by: a) increase of
the number of specimens in the training group and the
number of measurements in the initial data sets;
development a mathematical method for evaluation
of the reliability of each statistical criterion and
decision rule and development of additional statistical
criteria.
ACKNOWLEDGEMENTS
The study was supported by the project LZP-2020/2-
0033 “Recognition of the stage of deterioration of
surface layers of concrete using spectroscopy of
acoustic surface waves” funded by the Latvian
Council of Science.
REFERENCES
Kundu. T. et al. (2003) Ultrasonic Non-destructive
Evaluation. Engineering and Biological Material
Characterization. CRC Press, Boca Raton, 848 p.
Laugier P. (2008) Instrumentation for in vivo ultrasonic
characterization of bone strength. IEEE transactions on
ultrasonics, ferroelectrics, and frequency control.
55(6):1179-96.
Tatarinov A, Egorov V, Sarvazyan A, Sarvazyan N. (2014)
Multi-frequency axial transmission bone
ultrasonometer. Ultrasonics, 54(5): pp. 1162-1169.
Breugel K. (2017) Societal burden and engineering
challenges of ageing infrastructure. Procedia
Engineering 171 53 – 63.
Komlos
̆
K., Popovics S., Nürnbergerová T., Babál B.,
Popovicsc J.S. (1996) Ultrasonic pulse velocity test of
concrete properties as specified in various standards.
Cement and Concrete Composites, vol. 18, pp. 357-364.
Victorov, I.A. (1967) Rayleigh and Lamb waves. Physical
theory and applications. Plenum Press, New York.
Stone J.V. (2021) The Fourier Transform: A Tutorial
Introduction, Sebtel Press, Annotated edition, 103 p.
ICPRAM 2022 - 11th International Conference on Pattern Recognition Applications and Methods
314
