
Fair-Net: A Network Architecture for Reducing Performance Disparity
between Identifiable Sub-populations
Arghya Datta
1 a
and S. Joshua Swamidass
2 b
1
Department of Computer Science and Engineering, Washington University in Saint Louis, Saint Louis, U.S.A.
2
Department of Pathology and Immunology, Washington University School of Medicine in Saint Louis, Saint Louis, U.S.A.
Keywords:
Fairness, Classification, Deep Learning, Neural Networks.
Abstract:
In real world datasets, particular groups are under-represented, much rarer than others, and machine learn-
ing classifiers will often preform worse on under-represented populations. This problem is aggravated across
many domains where datasets are class imbalanced, with a minority class far rarer than the majority class.
Naive approaches to handle under-representation and class imbalance include training sub-population specific
classifiers that handle class imbalance or training a global classifier that overlooks sub-population disparities
and aims to achieve high overall accuracy by handling class imbalance. In this study, we find that these ap-
proaches are vulnerable in class imbalanced datasets with minority sub-populations. We introduced Fair-Net,
a branched multitask neural network architecture that improves both classification accuracy and probability
calibration across identifiable sub-populations in class imbalanced datasets. Fair-Nets is a straightforward
extension to the output layer and error function of a network, so can be incorporated in far more complex
architectures. Empirical studies with three real world benchmark datasets demonstrate that Fair-Net improves
classification and calibration performance, substantially reducing performance disparity between gender and
racial sub-populations.
1 INTRODUCTION
Machine learning systems are widely used in a vari-
ety of tasks such as computer vision (LeCun et al.,
2010), natural language processing (Mikolov et al.,
2013), graphs (Matlock et al., 2019) as well as iden-
tifying causes and interventions for diseases (Datta
et al., 2020; Barnette et al., 2020; Datta et al., 2021a).
Decision-making systems, based on neural network
architectures, are widely used in many critical tasks
such as criminal justice (Zavr
ˇ
snik, 2021), granting
loans (Turiel and Aste, 2020), skin cancer detec-
tion (Esteva et al., 2017) and face recognition (Mer-
ler et al., 2019). However, there have been grow-
ing concerns regarding the performance disparities
of these decision making systems across many sensi-
tive domains where there are under-represented sub-
populations in the underlying training dataset or ap-
plication domain.
Under-representation is when samples from a par-
ticular sub-population such as those based on gender
or race are rare. Under these circumstances, clas-
a
https://orcid.org/0000-0003-3543-3829
b
https://orcid.org/0000-0003-2191-0778
sifiers tend to exhibit disparate performance, with
greater accuracy on the majority sub-populations than
the minority sub-populations. A previous case study
by Buolamwini et al. (Buolamwini and Gebru, 2018)
known as ”Gender Shades” highlighted noticeable
performance disparities in facial recognition systems
between male and female sub-populations for classifi-
cation tasks. Even though these classification systems
achieved more than 90% global classification accu-
racy for gender detection, classification accuracy was
much higher in light skinned individuals than dark-
skinned ones.
Numerous studies have been conducted that
highlight the problem of under-representation in
datasets (Kearns et al., 2019; Kim et al., 2019; Hardt
et al., 2016; Verma and Rubin, 2018). The prob-
lem of under-representation is even more challeng-
ing in presence of class imbalance. Class imbal-
ance occurs when samples from one class are far
more rare than the other. Classifiers are usually bi-
ased towards the majority class, thereby performing
poorly on the minority class. Since machine learn-
ing classifiers are commonly used in decision-making
systems, they should simultaneously be accurate as
Datta, A. and Swamidass, S.
Fair-Net: A Network Architecture for Reducing Performance Disparity between Identifiable Sub-populations.
DOI: 10.5220/0010877400003116
In Proceedings of the 14th International Conference on Agents and Artificial Intelligence (ICAART 2022) - Volume 3, pages 645-654
ISBN: 978-989-758-547-0; ISSN: 2184-433X
Copyright
c
2022 by SCITEPRESS – Science and Technology Publications, Lda. All rights reserved
645

well as produce well calibrated probabilities. Pre-
dictions from a binary classifier are said to be well-
calibrated if the outcomes predicted to occur with a
probability p occur p fraction of the time. Since clas-
sifiers minimize error on training, it is often a com-
mon practise to assign high costs on misclassifications
on the minority class so as to maximize the classi-
fication performance on the minority class but over-
looking the calibration performance. Common para-
metric and non-parametric approaches such as Platt
scaling (Platt, 1999), isotonic regression (Zadrozny
and Elkan, 2002) and Bayesian binning into quan-
tiles (BBQ) (Pakdaman Naeini et al., 2015) are often
used to post-process classifiers’ outputs for probabil-
ity calibration. However, previous research (Huang
et al., 2020) has shown that the common paramet-
ric and non-parametric calibration techniques are of-
ten unstable on class imbalanced datasets. Even
though, a classifier is trained and post-processed to
maximize classification and calibration accuracy for
class imbalanced datasets, there may still be signifi-
cant performance drops across under-represented sub-
populations present in the dataset population.
Little work has been done to develop neural net-
work architecture that jointly learns classification
and calibration in under-represented sub-populations
while handling the skewed distribution of the mi-
nority and majority samples in class imbalanced
datasets. Recently, the Cal-Net neural network ar-
chitecture (Datta et al., 2021b) demonstrated simul-
taneous improvement in classification and calibra-
tion performance on class imbalanced datasets. Here,
we aim to build on this architecture to improve pre-
dictive performance across multiple sub-populations
with Fair-Net: a neural network architecture that si-
multaneously optimizes classification and calibration
performances across identifiable sub-populations in
the dataset population. Empirically, we find that Fair-
Net achieves the best classification and calibration
performances across diverse sub-populations of inter-
est.
2 RELATED WORK
Prior research works and methodologies that have
been proposed to handle class imbalance and proba-
bility calibration while improving classification per-
formance across under-represented sub-populations
in datasets.
Previous research studies have proposed paramet-
ric and non-parametric post-processing probability
calibration techniques such as Platt scaling (Platt,
1999), isotonic regression (Zadrozny and Elkan,
2002), histogram binning (Zadrozny and Elkan, 2001)
and bayesian binning into quantiles (BBQ) (Pak-
daman Naeini et al., 2015). The post-processing cali-
bration techniques utilize a holdout validation dataset
for re-scaling the base classifiers’ outputs to improve
calibration performance thereby reducing the effec-
tive number of sampling for training the base classi-
fier. In datasets where the number of samples is low,
this may often lead to under-trained classifiers.
Class imbalance is a widespread challenge in ma-
chine learning and previous studies have proposed
several strategies to mitigate this problem. Sam-
pling is a common approach to mitigate class im-
balance. Common sampling strategies include over-
sampling (Ling and Li, 1998), where samples from
the minority class is re-sampled randomly to elimi-
nate the skewness from the data distribution. Sim-
ilarly, under-sampling (Kubat and Matwin, 1997)
eliminates samples from the majority class randomly
to match the distribution of the minority class. Meth-
ods such as synthetic minority over-sampling tech-
nique (SMOTE) (Chawla et al., 2002) has been pro-
posed that removes the skewness from the imbal-
anced data distributions by generating synthetic mi-
nority class samples. Cost-sensitive learning (Domin-
gos, 1999; Elkan, 2001) and sample weighting(Ting,
1998) are commonly used to assign high weights to
samples from the minority class by modifying the ob-
jective function. Even though sampling strategies are
widely used for managing class imbalance, there are
well-known pitfalls such as overfitting (Holte et al.,
1989) due to over-sampling as well as information
loss (Tang et al., 2009) and inducing bias in calibra-
tion due to under-sampling (Dal Pozzolo et al., 2015).
A naive approach to address challenges in pre-
dictive modeling across sub-populations of interest
in a dataset is to train a separate classifier on each
sub-population of interest while simultaneously us-
ing previously proposed strategies to handle class im-
balance. We have included this approach as a base-
line in our study. We find that this approach per-
forms poorly in minority sub-populations where only
a small number of samples are available to train
sub-population specific classifiers. To overcome this
shortcoming, branched neural network architectures
can be used where each branch is trained on different
sub-populations so as to improve the predictive per-
formance for that specific sub-population. In our ab-
lation studies, we have showed that this approach does
not simultaneously achieve the best classification and
calibration performances in minority sub-populations
in class imbalanced datasets. Previous research stud-
ies have proposed methodologies (Kearns et al., 2019;
Kim et al., 2019) to improve classification accuracy
ICAART 2022 - 14th International Conference on Agents and Artificial Intelligence
646
across sub-populations as well as various definitions
of fairness such as equalized odds and equal opportu-
nity (Hardt et al., 2016), demographic parity (Verma
and Rubin, 2018) etc. Our definition of fairness is dif-
ferent from parity based notions (Hardt et al., 2016;
Verma and Rubin, 2018). Instead, we increase fair-
ness by reducing disparity in classification and cali-
bration performance across sub-populations. Dispar-
ity is defined as the variance of performance across
identifiable sub-populations of interest in class imbal-
anced datasets.
3 MATERIALS & METHODS
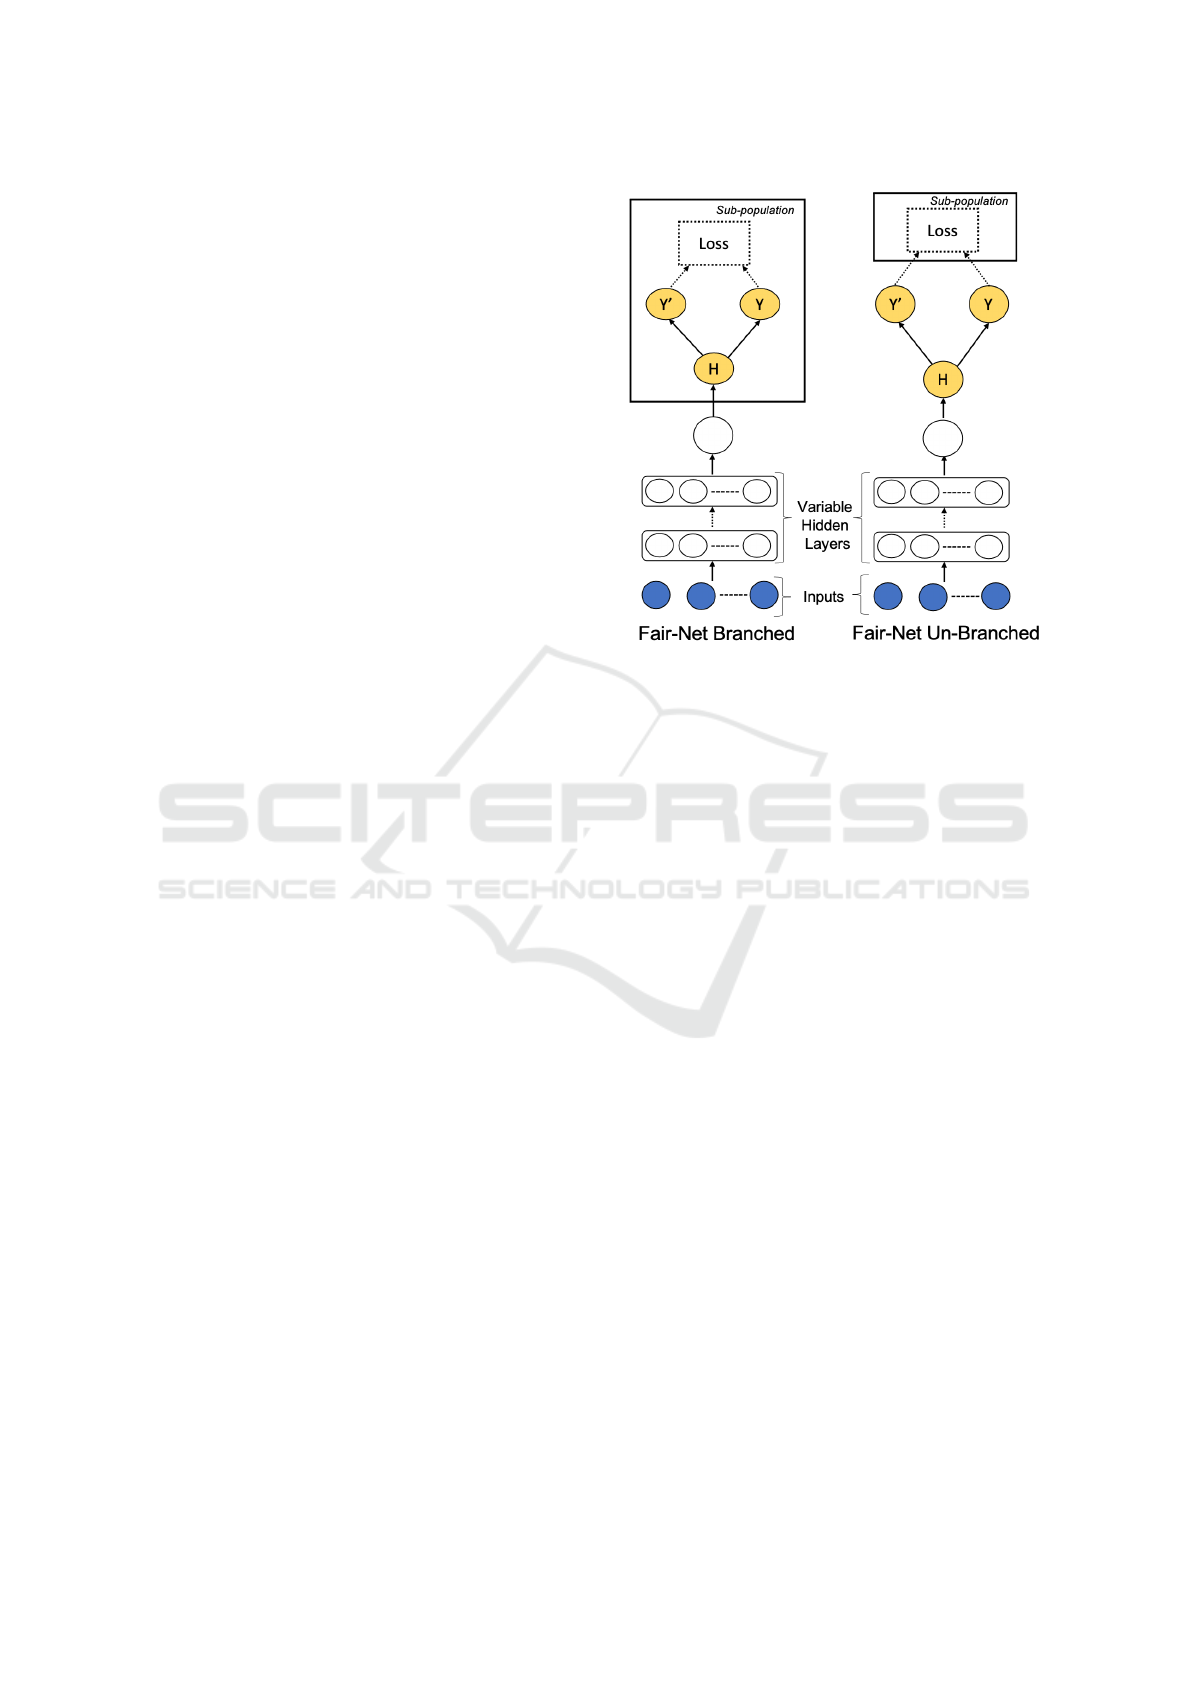
3.1 The Fair-Net Architecture
The Fair-Net architecture expands the Cal-Net archi-
tecture, which aimed to improve calibration on imbal-
anced datasets (Datta et al., 2021b). Like the Cal-Net
architecture, the Fair-Net architecture transforms the
binary classification problem into a multi-task prob-
lem using two outputs (Figure 1). The primary out-
put (Y ) is tuned to produce well-scaled probabilities,
whereas the secondary output (Y
0
) is utilized only dur-
ing the training phase to maximize the classification
performance by upweighting samples from the minor-
ity class to be equally prevalent as samples from the
majority class.
Mirroring Cal-Net , the primary (Y ) and secondary
(Y
0
) outputs in Fair-Nets, computed using logistic ac-
tivation functions, are computed from a hidden layer
(H) with a single node. This structure ensures that
the neural network architecture enforces a monotonic
relationship between the primary and the secondary
outputs. Both the outputs are monotonic functions of
a single number H so they are monotonic transforma-
tions of each other.
We have introduced two broad variants of Fair-
Nets: “Fair-Net Branched” and “Fair-Net Un-
Branched”. In the first variant, ”Fair-Net Branched”
trains a different “branch” consisting of a primary out-
put (Y ) and a secondary output (Y
0
), computed using a
single hidden node H, for each sub-population of in-
terest. The primary output (Y ) in a “branch” is tuned
to produce well-calibrated probabilities, whereas the
secondary output (Y
0
) is tuned to maximize classi-
fication performance by upweighting samples from
the minority class in the sub-population to be equally
prevalent as samples from the majority class for that
sub-population. This modification requires six train-
able parameters in total, with three weights and three
biases for each sub-population of interest. Thus, each
branch is tuned to maximize the classification and cal-
Figure 1: Different variants of Fair-Nets. Fair-Net Branched
trains a different branch for each sub-population, whereas
Fair-Net Un-Branched computes the total loss by summing
over losses for each sub-population of interest.
ibration performances for each sub-population of in-
terest at the cost of more trainable parameters.
In the second variant, “Fair-Net Un-Branched,” a
single “branch” consisting of a primary output (Y )
and a secondary output (Y
0
), computed from a single
hidden node H, is tuned to maximize the classifica-
tion and calibration performance across all the sub-
populations of interest. Unlike the variant “Fair-Net
Branched”, the variant “Fair-Net Un-Branched” does
not result in additional trainable parameters for each
sub-population of interest.
3.2 Loss Components
All the variants of Fair-Nets make use of the same loss
components used by Cal-Net (Datta et al., 2021b).
The primary output, Y = {y
g,i
}, indexed by in-
stance, i, in sub-population, g, for both “Fair-Net
Branched” and “Fair-Net Un-Branched” utilize a lo-
gistic activation function. The loss component for
each sub-population, g, are computed based on this
output and the target class labels T = {t
g,i
}.
The first loss component, L
X,g
, is the binary cross
entropy error between Y and T for sub-population
g. The instances in the majority class for each sub-
population contribute more to the loss in class imbal-
anced datasets.
The second loss component, L
B,g
, computes the
balanced cross-entropy loss for each sub-population,
g, between T and Y
0
. Instances from the minor-
Fair-Net: A Network Architecture for Reducing Performance Disparity between Identifiable Sub-populations
647

ity class for each sub-population is upweighted to be
equally prevalent as samples from the majority class
for that sub-population. In all the variants of Fair-
Nets, the majority (negatives) class samples in sub-
population g are weighted as N
g
/2n
g
and the minor-
ity (positives) class samples are weighted as N
g
/2p
g
where N
g
is the number of samples in sub-population
g and p
g
and n
g
are the number of samples in the
minority (positives) and majority (negatives) classes,
respectively. This weighting scheme ensures that
for each sub-population g, the minority and majority
classes are weighed equally.
The total loss function (L) for Fair-Net Branched
and Fair-Net Un-Branched is computed as,
L =
∑
g∈G
λ
g
· [L
X,g
+ L
B,g
], (1)
where G is the set of all sub-populations of interest
and λ
g
is a hyper-parameter that can be tuned to assign
higher mis-classification costs for sub-population g.
In all our experiments, λ
g
= 1 for all sub-populations.
We also use the histogram loss from Cal-Net
(Datta et al., 2021b) on the primary output Y for gen-
erating well scaled-probabilities. In a well-calibrated
probabilistic model for binary classification tasks, the
proportion of positive examples in each bin of a reli-
ability diagram should match the average of the pre-
dictions for the bin, which is usually close to the mid-
point of the bin. Hence, the histogram loss, L
H,g
for
each sub-population g is computed as the RMSE be-
tween the proportion positives and the midpoints of
the bin.
The total loss function (L) for Fair-Net Branched
[histogram loss] and Fair-Net Un-Branched [his-
togram loss] is computed as,
L =
∑
g∈G
λ
g
· [L
X,g
+ L
B,g
+ λ
H,g
L
H,g
] (2)
where L
H,g
is the histogram loss for sub-population
g and λ
H,g
is a hyper-parameter that can be used to
tune L
H,g
. Other formulations of the histogram loss
may be effective, but exploring them is left for future
work. Empirical analyses show that all the loss com-
ponents are necessary to optimize classification and
calibration across under-represented sub-populations
in class imbalanced scenarios.
3.3 Datasets
For our experiments, we used three datasets namely
(Table 1): (1) Propublica COMPAS dataset (Kirch-
ner and Angwin, 2017) (2) UCI credit card default
dataset (Yeh and hui Lien, 2009) and (3) UCI adult
census dataset (Kohavi, 1996).
• Propublica COMPAS dataset: We used a smaller
subset of the propublica COMPAS dataset (Kirch-
ner and Angwin, 2017) consisting of 6172 in-
stances with 5 features. A binary target variable
indicated if an individual would re-offend within
the next two years. We used the gender variable to
consider two sub-populations namely: Female (F)
and Not Female (NF). The imbalance ratios of the
target variable in F and NF sub-populations were
1.8 and 1.08 respectively.
• UCI credit card default dataset: The credit card
default dataset (Yeh and hui Lien, 2009) from
UCI (Dua and Graff, 2020) repository consists
of 30,000 instances with 23 features. The bi-
nary target variable indicated whether an individ-
ual would incur a default payment or not. We have
considered two sub-populations based on gender
namely: Male (M) and Female(F). The imbalance
ratios for the target variable for M and F sub-
populations are 3.14 and 3.81 respectively.
• UCI Adult Census dataset: The adult census
dataset (Kohavi, 1996) from UCI (Dua and Graff,
2020) repository consists of 48,842 instances with
14 features and a binary target variable that indi-
cated if an individual earned more than $50, 000
or not. After removing samples with missing val-
ues, 45,222 samples were used for the analyses.
We have considered 8 sub-populations based on
gender and race namely: Male (M), Female (F),
Black (B), White (W), Black Male (BM), Black
Female (BF), White Male (WM) and White Fe-
male (WF).
3.4 Training and Evaluation Protocol
We evaluated the variants of Fair-Nets and baseline
models for probability calibration performance and
classification accuracy using a stratified train, valida-
tion and test split. For each dataset, we kept a strat-
ified split of the dataset as a test set(20 − 25% of the
dataset) such that the percentages of sub-populations
and the imbalance ratios for each sub-population are
preserved across train, validation and test sets. Since
most of these datasets have a low number of samples
for the minority sub-populations, this strategy ensured
that sufficient minority samples are present in all the
splits. For our experiments, we trained the variants of
Fair-Nets with a single hidden layer of 5 units with
exponential linear unit (ELU) activation and L2 regu-
larization.
ICAART 2022 - 14th International Conference on Agents and Artificial Intelligence
648

3.5 Baselines
As a baseline for comparison with different variants
of Fair-Nets, we trained neural network (NN) archi-
tectures with one ELU activated hidden layer consist-
ing of 10 hidden units. We used balanced cross en-
tropy loss to train these neural network architectures
such that the samples from the minority class are up-
weighted to be equally prevalent as samples from the
majority class. Balanced cross entropy loss usually
improves the classification performance in class im-
balanced datasets (Johnson and Khoshgoftaar, 2019).
Also, we trained neural network architectures us-
ing the same architecture (one hidden layer with 10
ELU activated hidden units) for each sub-population
of interest using balanced cross-entropy losses. Fi-
nally, we trained Cal-Net architectures with one hid-
den layer consisting of 5 hidden units with ELU acti-
vation. For our case studies, all the variants of Fair-
Nets usually had less number of trainable parame-
ters than the baseline NN [balanced xent] and sub-
population specific baselines.
3.6 Assessment Metrics
We evaluate the predictive performance of Fair-
Nets and the associated baselines on different sub-
populations by reporting the maximum F-measure
and area under the receiver operating characteris-
tic (ROC AUC). Previous research work (Davis and
Goadrich, 2006) has shown that ROC AUC is often
unreliable in class imbalanced datasets. On the con-
trary, F-measure is a commonly used metric to sum-
marize classification performance in class imbalanced
datasets. We highlight the imbalance ratio (IR), calcu-
lated as
n
0
n
1
, where n
1
is the number of minority (posi-
tives) samples and n
0
is the number of majority (nega-
tives) samples across different sub-populations of in-
terest in the datasets. In order to summarize the cal-
ibration performance of Fair-Nets and the associated
baselines, we have reported the expected calibration
error (ECE) (Pakdaman Naeini et al., 2015; K
¨
uppers
et al., 2020) and utilized reliability diagrams (DeG-
root and Fienberg, 1983). A classifier that achieves
higher F-measure and higher AUROC along with
lower ECE across different sub-populations of inter-
est is preferred.
Table 1: Class Imbalance statistics for real world datasets.
Dataset Size % +ve IR
COMPAS 6172 45.5 1.2
Credit default 30000 22.12 3.52
Census income 45222 24.78 3
4 RESULTS & DISCUSSION
4.1 Propublica COMPAS Dataset
Fair-Net variants outperformed the baselines on the
Propublica COMPAS dataset in classification and cal-
ibration performances both on the overall population
as well as on the different sub-populations of inter-
est (Figure 2). For the F sub-population, the IR for
the target variable was 1.8 , which was higher than
that of the overall sub-population. Fair-Net variants
outperformed the baselines on the F sub-population
in predictive performance by achieving the highest
F-measure while simultaneously achieving the low-
est ECE, thereby improving the calibration perfor-
mance. Both the variants of Fair-Net Branched out-
performed the variants of Fair-Net Un-Branched in
classification performance owing to a greater num-
ber of available trainable parameters. For both Fair-
Nets Branched and Fair-Nets Un-Branched variants,
the inclusion of the histogram loss helped in improv-
ing calibration performance by reducing ECE. This
highlights the potential benefit of incorporating his-
togram loss to further improve the calibration perfor-
mance across sub-populations. Sub-population spe-
cific baseline models, trained exclusively for each
sub-population of interest, usually exhibited poor pre-
dictive performance due to the availability of a lower
number of samples in the training dataset. As empir-
ically shown, all the variants of Fair-Nets improved
predictive performance in the under-represented F
sub-population with a high IR than the overall pop-
ulation.
4.2 UCI Credit Card Default Dataset
All the variants of Fair-Nets outperformed the base-
lines in classification and calibration performance on
the overall population while simultaneously improv-
ing predictive performances across M and F sub-
populations (Figure 2). We observed similar trends
in this case study as well where both the variants of
Fair-Net Branched outperformed the variants of Fair-
Net Un-Branched at the cost of more trainable param-
eters. Both the variants of Fair-Nets with histogram
loss outperformed the corresponding variants without
histogram loss in calibration performance by achiev-
ing lower ECE scores. All the variants of Fair-Nets
improved the predictive performance in the under-
represented M sub-population in the dataset.
Fair-Net: A Network Architecture for Reducing Performance Disparity between Identifiable Sub-populations
649
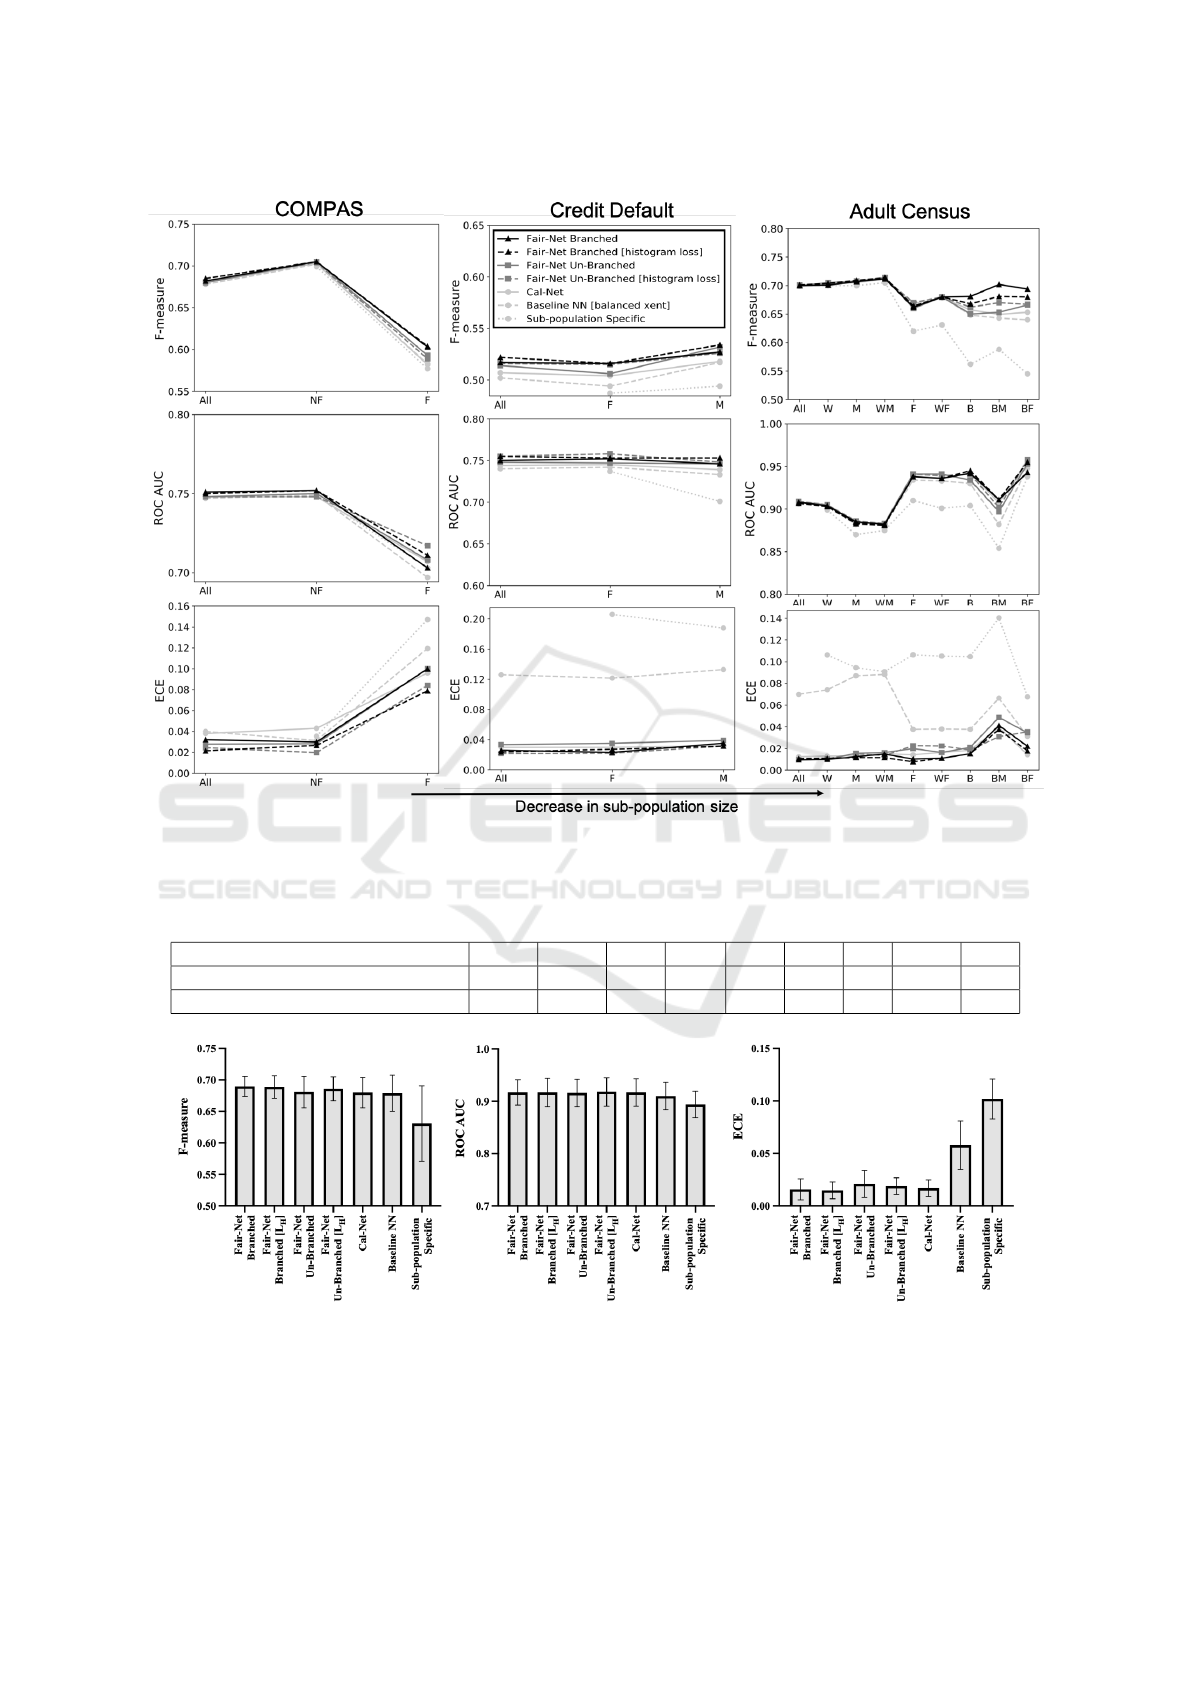
Figure 2: On the benchmark datasets, variants of Fair-Net achieved the best predictive performance in terms of F-measure,
ROC-AUC and ECE across different sub-populations of interest.
Table 2: Comparing performance of Fair-Net with published results in the literature such as Multi-accuracy (Kim et al., 2019)
on similar, but not identical, test dataset.
all W M WM F WF B BM BF
Fair-Net Branched 16.29 17.09 20.1 21.7 7.67 7.95 9.5 13.25 3.83
Multi-Accuracy (Kim et al., 2019) 14.7 15 18.3 18.3 7.2 7.3 9.4 13.9 4.5
Figure 3: Variants of Fair-Net achieved the best predictive performance (high F-measure and ROC AUC alongside low ECE)
with lowest variance across identifiable sub-populations of interest for the adult census dataset (Kohavi, 1996). L
H
refers to
the histogram loss.
ICAART 2022 - 14th International Conference on Agents and Artificial Intelligence
650

4.3 UCI Adult Census Dataset
Similar to the prior two case studies, variants of
Fair-Nets achieved the best classification and calibra-
tion performance across different sub-populations in
the adult census dataset (Kohavi, 1996). Eight sub-
populations were considered in this case study: Male
(M), Female (F), Black (B), White (W), Black Male
(BM), Black Female (BF), White Male (WM) and
White Female (WF). Out of all these sub-populations,
B, BM and BF sub-populations were the most under-
represented, accounting for less than 10% of the over-
all population. Furthermore, the IR values across B,
BM and BF sub-populations are 6.8, 4.26 and 14.7
respectively. Empirical results (Figure 2) showed
that the variants of Fair-Nets outperformed the base-
lines across all the eight sub-populations as well
as on the overall population in classification and
calibration performances. Moreover, the improve-
ments in classification performance for the variants
of Fair-Nets were noticeable in the B, BM and BF
subpopulations, where, all the variants of Fair-Nets
outperformed the baselines by achieving higher F-
measure and ROC AUC and lower ECE. The base-
line neural network, trained using balanced cross en-
tropy loss for the overall population, achieved sim-
ilar classification performance to Fair-Nets in the
majority sub-populations but incurred drops in F-
measure in the under-represented sub-populations
such as B, BM and BF. The sub-population spe-
cific baseline models, trained exclusively on differ-
ent sub-populations, performed poorly in the under-
represented sub-populations with high class imbal-
ances owing to a shortage in training samples. On
the contrary, branched variants of Fair-Net achieved
significantly higher predictive performance by adding
six trainable parameters (three weight variables and
three bias variables) for each sub-population of inter-
est, whereas the un-branched variants of Fair-Nets did
not add any additional trainable parameters for differ-
ent sub-populations of interest. The branched vari-
ants of Fair-Net outperformed the un-branched vari-
ants in predictive performance due to the availabil-
ity of more trainable parameters in the neural net-
work architecture. Furthermore, the average classifi-
cation and calibration performances of Fair-Net vari-
ants across different sub-populations are higher than
the baselines with low standard deviation (Figure 3).
This suggests that Fair-Nets do not incur any sub-
stantial performance drops in under-represented sub-
populations with high class imbalance ratios. Fi-
nally, the classification error (%) across different sub-
populations for the Fair-Net variants are compara-
ble with prior published work by Kim et al. (Kim
et al., 2019). We observed that Fair-Net Branched
achieved lower classification error (Table 2), suggest-
ing that Fair-Nets achieve the best predictive accu-
racy in the under-represented sub-populations for the
adult census dataset. However, we note that clas-
sification error(%) is a poor metric in class imbal-
anced sub-populations since a classifier with low clas-
sification error (%) may not achieve high F-measure
and performs substantially worse in class imbalanced
datasets (Luque et al., 2019).
4.4 Ablation Analyses
Ablation analyses demonstrated the importance of
different components in the Fair-Net’s architecture.
We trained multi-task neural network architectures
that resembled variants of Fair-Net Branched by re-
moving (1) the primary output Y and (2) the sec-
ondary output Y
0
from each of the sub-population
heads in Fair-Net’s architecture to evaluate whether
the classification and calibration performances are af-
fected. For the ablation analyses, we focused on the
adult census dataset (Kohavi, 1996) since it contains
sub-populations with a diverse range of samples and
imbalance ratios.
4.4.1 With and without Primary Output Y for
Each Sub-population
We trained a modified architecture without the pri-
mary output Y from every sub-population network
head. Thus, the Fair-Net architecture was reduced to
a branched neural network architecture, where each
branch was trained on a different sub-population us-
ing a balanced cross-entropy loss. The balanced
cross-entropy loss upweighted minority class samples
to be equally prevalent as samples from the majority
class for each sub-population. Empirical results (Fig-
ure 4) showed that this modified architecture incurred
a drop in classification performance across minority
sub-populations such B, BM and BF. Moreover, we
observed that this architecture had poor calibration
performance (Figure 4) when compared to a standard
Fair-Net architecture with a primary output Y for each
sub-population. Post-processing this modified archi-
tecture’s outputs using parametric and non-parametric
calibration techniques may improve the calibration
performance. The standard Fair-Net Branched archi-
tecture continued to achieve the best overall classi-
fication and calibration performances across all the
sub-populations of interest.
Fair-Net: A Network Architecture for Reducing Performance Disparity between Identifiable Sub-populations
651
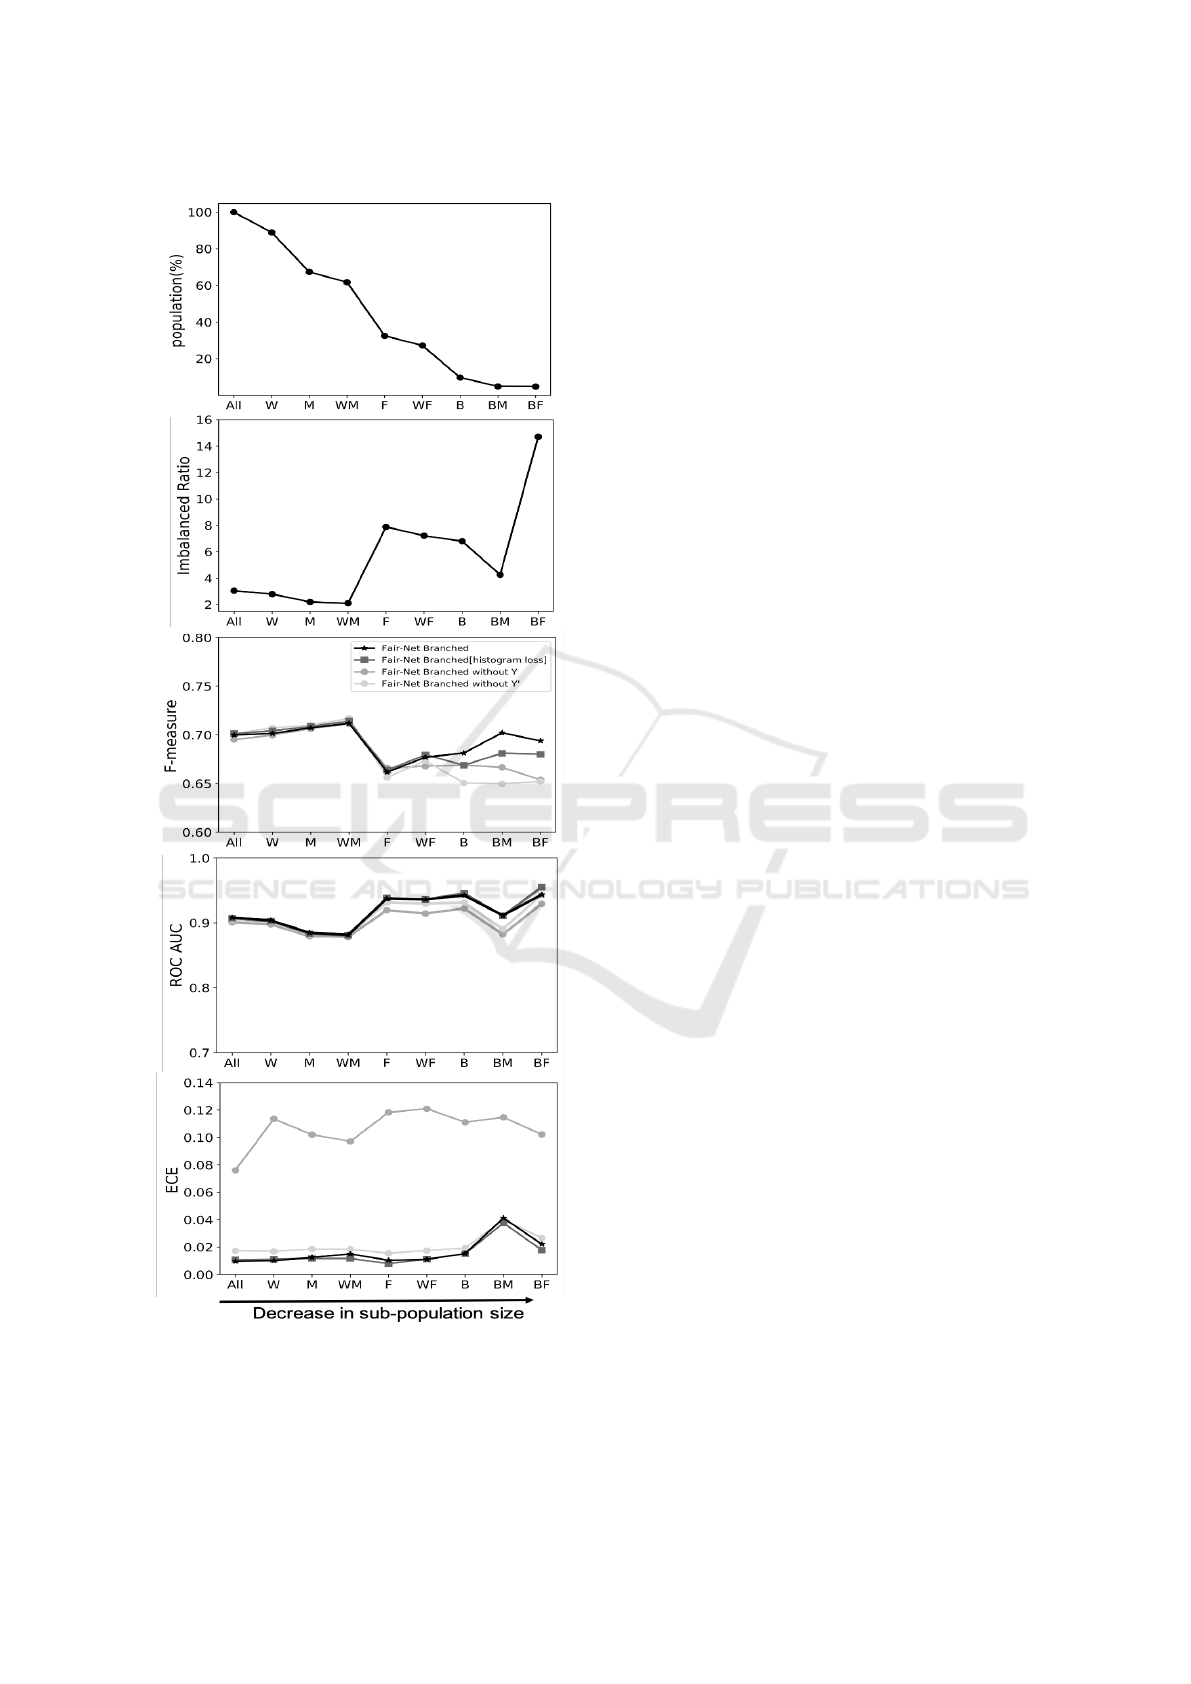
Figure 4: Ablation analyses demonstrating different com-
ponents of Fair-Net are essential to improve classification
and calibration performances for the adult census income
dataset (Kohavi, 1996).
4.4.2 With and without Secondary Output Y
0
for
Each Sub-population
We trained a modified architecture after eliminat-
ing the secondary output Y
0
from each of the sub-
population branches. This essentially reduced the
Fair-Net architecture to a branched neural network ar-
chitecture, where a separate network head was trained
for each sub-population using non-weighted cross-
entropy loss. Hence, samples from both the majority
(negatives) and the minority (positives) classes were
weighted equally. The multi-task architecture with-
out the secondary output Y
0
for each sub-population
produced well calibrated probabilities. However, it
achieved the lowest classification performance across
all the under-represented sub-populations. In the stan-
dard Fair-Net architecture, the secondary output Y
0
was trained using a balanced cross-entropy loss so
that samples from the minority class were upweighted
to be equally prevalent as samples from the majority
class belonging to the same sub-population thereby
improving classification performance. We hypothe-
sized that this modified architecture without the sec-
ondary output Y
0
would be comparatively weaker
than the standard Fair-Net architecture in classifica-
tion performance.
Empirically, we observed that there were drops in
classification performance of this modified architec-
ture across B, BM and BF sub-populations in terms
of F-measure and ROC-AUC (Figure 4). As evident
from the distribution of these sub-populations in the
dataset, B, BM and BF had very few samples with
a high class imbalance ratio when compared to other
sub-populations. Hence, we concluded that the sec-
ondary output Y
0
is necessary to improve the classi-
fication performance across minority sub-populations
with high class imbalance ratios. Both the variants of
Fair-Net Branched continued to achieve the best clas-
sification and calibration performances across all the
sub-populations of interest.
4.4.3 With and without Histogram Loss (L
H
)
We introduced two variants of Fair-Nets that used the
histogram loss (Datta et al., 2021b). Our case studies
across COMPAS data, credit card default dataset and
adult census dataset showed that the variants of Fair-
Nets trained using histogram loss often outperformed
the corresponding variants of Fair-Nets without the
histogram loss by achieving lower ECE scores. This
suggests that optimizing on the histogram loss may
result in improved calibration performance. There
may be other formulations for the histogram loss and
fully exploring options is left for future studies.
ICAART 2022 - 14th International Conference on Agents and Artificial Intelligence
652

4.5 Study Limitations & Future
Directions
The proposed modeling framework requires that all
sub-populations are identifiable from the outset. We
explicitly identify each sub-populations in training
the model, summing over the losses for each sub-
population. Hence, our modeling framework needs
access to the features that were used to identify these
sub-populations of interest. In our study, the sec-
ondary output Y
0
equally weighs the minority and
the majority samples for each sub-population. How-
ever, upweighting the minority samples using a higher
weight may yield better results in class imbalanced
scenarios. In general, neural network architectures
may often exhibit poor predictive performance and
generalization due to unavailability in training data
for under-represented sub-populations (Cui et al.,
2015). As a result, variants of Fair-Net may exhibit
degraded performance in the absence of enough train-
ing data. In our case studies, we weighted each sub-
population of interest equally by setting λ
g
as 1 for
all g ∈ G. However, upweighting under-represented
or minority sub-populations may result in improved
predictive performance in these subpopulations and
exploring options is left for future work. Exploiting
multi-task architectures may prove to be an effective
way to improve predictive performance across these
sub-populations, as evident in our study.
5 CONCLUSION
In this work, we have introduced Fair-Net, a class
of neural network architectures that simultaneously
improved classification and calibration performances
across diverse sub-populations of interest in class im-
balanced datasets. Empirically, we showed that the
variants of Fair-Net outperformed commonly used
neural network architectures by achieving higher F-
measure, ROC-AUC and low ECE across differ-
ent sub-populations of interest in three real world
datasets: UCI Credit card default dataset, UCI Adult
census dataset and Propublica COMPAS datasets.
Due to its simplicity, Fair-Nets can readily be incor-
porated in complex network architectures as the final
layer to improve predictive performance across sub-
populations of interest.
ACKNOWLEDGEMENT
This research was supported by the National Library
of Medicine of the National Institutes of Health under
award numbers R01LM012222 and R01LM012482
and the National Institute of General Medical Sci-
ences under award number R01GM140635.
REFERENCES
Barnette, D. A., Schleiff, M. A., Datta, A., Flynn, N.,
Swamidass, S. J., and Miller, G. P. (2020). Meloxi-
cam methyl group determines enzyme specificity for
thiazole bioactivation compared to sudoxicam. Toxi-
col. Lett.
Buolamwini, J. and Gebru, T. (2018). Gender shades: In-
tersectional accuracy disparities in commercial gender
classification. In Friedler, S. A. and Wilson, C., edi-
tors, Proceedings of the 1st Conference on Fairness,
Accountability and Transparency, volume 81 of Pro-
ceedings of Machine Learning Research, pages 77–
91, New York, NY, USA. PMLR.
Chawla, N. V., Bowyer, K. W., Hall, L. O., and Kegelmeyer,
W. P. (2002). Smote: Synthetic minority over-
sampling technique. J. Artif. Int. Res., 16(1):321–357.
Cui, X., Goel, V., and Kingsbury, B. (2015). Data aug-
mentation for deep neural network acoustic modeling.
IEEE/ACM Transactions on Audio, Speech, and Lan-
guage Processing, 23(9):1469–1477.
Dal Pozzolo, A., Caelen, O., and Bontempi, G. (2015).
When is undersampling effective in unbalanced clas-
sification tasks? In Appice, A., Rodrigues, P. P., San-
tos Costa, V., Soares, C., Gama, J., and Jorge, A., ed-
itors, Machine Learning and Knowledge Discovery in
Databases, pages 200–215, Cham. Springer Interna-
tional Publishing.
Datta, A., Flynn, N. R., Barnette, D. A., Woeltje, K. F.,
Miller, G. P., and Swamidass, S. J. (2021a). Ma-
chine learning liver-injuring drug interactions with
non-steroidal anti-inflammatory drugs (nsaids) from
a retrospective electronic health record (ehr) cohort.
PLOS Computational Biology, 17(7):1–24.
Datta, A., Flynn, N. R., and Swamidass, S. J. (2021b).
Cal-net: Jointly learning classification and calibration
on imbalanced binary classification tasks. In 2021
International Joint Conference on Neural Networks
(IJCNN), pages 1–8.
Datta, A., Matlock, M. K., Dang, N. L., Moulin, T., Woeltje,
K. F., Yanik, E. L., and Swamidass, S. J. (2020).
”black box” to ”conversational” machine learning:
Ondansetron reduces risk of hospital-acquired venous
thromboembolism. IEEE Journal of Biomedical and
Health Informatics, pages 1–1.
Davis, J. and Goadrich, M. (2006). The relationship be-
tween precision-recall and roc curves. In Proceed-
ings of the 23rd International Conference on Machine
Learning, ICML ’06, page 233–240, New York, NY,
USA. Association for Computing Machinery.
DeGroot, M. H. and Fienberg, S. E. (1983). The com-
parison and evaluation of forecasters. Journal of the
Royal Statistical Society. Series D (The Statistician),
32(1/2):12–22.
Domingos, P. (1999). Metacost: A general method for
making classifiers cost-sensitive. In Proceedings of
the Fifth ACM SIGKDD International Conference on
Fair-Net: A Network Architecture for Reducing Performance Disparity between Identifiable Sub-populations
653

Knowledge Discovery and Data Mining, KDD ’99,
page 155–164, New York, NY, USA. Association for
Computing Machinery.
Dua, D. and Graff, C. (2020). UCI machine learning repos-
itory.
Elkan, C. (2001). The foundations of cost-sensitive learn-
ing. In In Proceedings of the Seventeenth Inter-
national Joint Conference on Artificial Intelligence,
pages 973–978.
Esteva, A., Kuprel, B., Novoa, R. A., Ko, J., Swetter, S. M.,
Blau, H. M., and Thrun, S. (2017). Dermatologist-
level classification of skin cancer with deep neural net-
works. Nature, 542(7639):115–118.
Hardt, M., Price, E., and Srebro, N. (2016). Equality of op-
portunity in supervised learning. In Proceedings of the
30th International Conference on Neural Information
Processing Systems, NIPS’16, page 3323–3331, Red
Hook, NY, USA. Curran Associates Inc.
Holte, R. C., Acker, L. E., and Porter, B. W. (1989). Con-
cept learning and the problem of small disjuncts. In
Proceedings of the 11th International Joint Confer-
ence on Artificial Intelligence - Volume 1, IJCAI’89,
page 813–818, San Francisco, CA, USA. Morgan
Kaufmann Publishers Inc.
Huang, L., Zhao, J., Zhu, B., Chen, H., and Broucke,
S. V. (2020). An experimental investigation of cali-
bration techniques for imbalanced data. IEEE Access,
8:127343–127352.
Johnson, J. M. and Khoshgoftaar, T. M. (2019). Survey on
deep learning with class imbalance. Journal of Big
Data, 6(1):27.
Kearns, M., Neel, S., Roth, A., and Wu, Z. (2019). An
empirical study of rich subgroup fairness for machine
learning. Proceedings of the Conference on Fairness,
Accountability, and Transparency.
Kim, M. P., Ghorbani, A., and Zou, J. Y. (2019). Multiaccu-
racy: Black-box post-processing for fairness in classi-
fication. In Conitzer, V., Hadfield, G. K., and Vallor,
S., editors, Proceedings of the 2019 AAAI/ACM Con-
ference on AI, Ethics, and Society, AIES 2019, Hon-
olulu, HI, USA, January 27-28, 2019, pages 247–254.
ACM.
Kirchner, J. L. S. M. L. and Angwin, J. (2017). Compas
dataset.
Kohavi, R. (1996). Scaling up the accuracy of naive-bayes
classifiers: a decision-tree hybrid. Proceedings of the
Second International Conference on Knowledge Dis-
covery and Data Mining.
K
¨
uppers, F., Kronenberger, J., Shantia, A., and Haselhoff,
A. (2020). Multivariate confidence calibration for ob-
ject detection. In The IEEE/CVF Conference on Com-
puter Vision and Pattern Recognition (CVPR) Work-
shops.
Kubat, M. and Matwin, S. (1997). Addressing the curse
of imbalanced training sets: One-sided selection. In
ICML.
LeCun, Y., Kavukcuoglu, K., and Farabet, C. (2010). Con-
volutional networks and applications in vision. In
2010 IEEE International Symposium on Circuits and
Systems (ISCAS), pages 253–256.
Ling, C. X. and Li, C. (1998). Data mining for direct
marketing: Problems and solutions. In Proceedings
of the Fourth International Conference on Knowledge
Discovery and Data Mining, KDD’98, page 73–79.
AAAI Press.
Luque, A., Carrasco, A., Mart
´
ın, A., and de las Heras, A.
(2019). The impact of class imbalance in classifica-
tion performance metrics based on the binary confu-
sion matrix. Pattern Recognition, 91:216–231.
Matlock, M. K., Datta, A., Dang, N. L., Jiang, K., and
Swamidass, S. J. (2019). Deep learning long-range
information in undirected graphs with wave networks.
In 2019 International Joint Conference on Neural Net-
works (IJCNN), pages 1–8.
Merler, M., Ratha, N., Feris, R. S., and Smith, J. R. (2019).
Diversity in faces. arXiv preprint arXiv:1901.10436.
Mikolov, T., Sutskever, I., Chen, K., Corrado, G. S., and
Dean, J. (2013). Distributed representations of words
and phrases and their compositionality. In Burges, C.
J. C., Bottou, L., Welling, M., Ghahramani, Z., and
Weinberger, K. Q., editors, Advances in Neural In-
formation Processing Systems 26, pages 3111–3119.
Curran Associates, Inc.
Pakdaman Naeini, M., Cooper, G., and Hauskrecht, M.
(2015). Obtaining well calibrated probabilities using
bayesian binning. Proceedings of the ... AAAI Con-
ference on Artificial Intelligence. AAAI Conference on
Artificial Intelligence, 2015:2901–2907.
Platt, J. C. (1999). Probabilistic outputs for support vector
machines and comparisons to regularized likelihood
methods. In ADVANCES IN LARGE MARGIN CLAS-
SIFIERS, pages 61–74. MIT Press.
Tang, Y., Zhang, Y., Chawla, N. V., and Krasser, S. (2009).
Svms modeling for highly imbalanced classification.
IEEE Transactions on Systems, Man, and Cybernet-
ics, Part B (Cybernetics), 39(1):281–288.
Ting, K. M. (1998). Inducing cost-sensitive trees via in-
stance weighting. In
˙
Zytkow, J. M. and Quafafou,
M., editors, Principles of Data Mining and Knowl-
edge Discovery, pages 139–147, Berlin, Heidelberg.
Springer Berlin Heidelberg.
Turiel, J. D. and Aste, T. (2020). Peer-to-peer loan ac-
ceptance and default prediction with artificial intelli-
gence. Royal Society Open Science, 7(6):191649.
Verma, S. and Rubin, J. (2018). Fairness definitions ex-
plained. In 2018 IEEE/ACM International Workshop
on Software Fairness (FairWare), pages 1–7.
Yeh, I.-C. and hui Lien, C. (2009). The comparisons of
data mining techniques for the predictive accuracy of
probability of default of credit card clients. Expert
Systems with Applications, 36(2, Part 1):2473–2480.
Zadrozny, B. and Elkan, C. (2001). Obtaining calibrated
probability estimates from decision trees and naive
bayesian classifiers. In Proceedings of the Eigh-
teenth International Conference on Machine Learn-
ing, ICML ’01, page 609–616, San Francisco, CA,
USA. Morgan Kaufmann Publishers Inc.
Zadrozny, B. and Elkan, C. (2002). Transforming classifier
scores into accurate multiclass probability estimates.
In Proceedings of the Eighth ACM SIGKDD Interna-
tional Conference on Knowledge Discovery and Data
Mining, KDD ’02, page 694–699, New York, NY,
USA. Association for Computing Machinery.
Zavr
ˇ
snik, A. (2021). Algorithmic justice: Algorithms and
big data in criminal justice settings. European Journal
of Criminology, 18(5):623–642.
ICAART 2022 - 14th International Conference on Agents and Artificial Intelligence
654
