
Detection of Emotion Categories’ Change in Speeches
Anwer Slimi
1,2 a
, Henri Nicolas
1b
and Mounir Zrigui
2c
1
Univ. Bordeaux, CNRS, Bordeaux INP, LaBRI, UMR 5800, F-33400 Talence, France
2
University of Monastir, RLANTIS Laboratory LR 18ES15, Monastir, Tunisia
Keywords: Connectionist Temporal Classification, Emotion Recognition, Neural Networks, Spectrograms.
Abstract: In the past few years, a lot of research has been conducted to predict emotions from speech. The majority of
the studies aim to recognize emotions from pre-segmented data with one global label (category). Despite the
fact that emotional states are constantly changing and evolving across time, the emotion change has gotten
less attention. Mainly, the exiting studies focus either on predicting arousal-valence values or on detecting the
instant of the emotion change. To the best of the authors knowledge, this is the first paper that addresses the
emotion category change (i.e., predicts the classes existing in a signal such as angry, happy, sad etc.). As a
result of that, we propose a model based on the Connectionist Temporal Classification (CTC) loss, along with
new evaluation metrics.
1 INTRODUCTION
In conversations, emotions add significance to the
speech and help us understand each other. Human
emotions have a fundamental part in all social
phenomena and some decisions can be made based on
the expressed feelings, so they should be explored in
depth. Within this context, allowing machines to
understand emotions would produce significant
improvement in the human-computer interactions in
a way that the context and the circumstances of a
given conversation would be easily identified and
become crystal clear to machines.
Emotions are dynamic in nature and they
constantly change throughout time, hence, an
intelligent system should be able to identify changes
in emotions as they occur when speakers participate
in human-computer interaction during which their
emotions are identified based on behavioral cues, so
that it may react accordingly. Most of the conducted
studies have been focusing on pre-segmented speech
utterances, where each utterance has one global label
(emotion). Such models are not efficient for emotion
detection change since the recognition of emotions
using pre-segmented speech utterances leads to a loss
of continuity between feelings and does not give
a
https://orcid.org/0000-0003-0558-2321
b
https://orcid.org/0000-0003-2179-4965
c
https://orcid.org/0000-0002-4199-8925
insights into emotion changes (
Huang et al, 2016)
.
However, despite its importance, research on emotion
change detection has gotten less attention than other
research aimed at recognizing and predicting
emotions from speeches. It is an interesting research
area that only few papers have attempted to address.
Existing researches have mainly focused on either
detecting the instant of emotion change i.e., detecting
when exactly an emotion change has occurred or on
predicting the change of valence (positive or
negative) and the arousal (low or high). To the best of
our knowledge, this paper is the first to introduce
emotion categories change detection system i.e.,
detecting if a change has occurred from one category
(angry, sad, neutral, etc.) to another. In other words,
within the same conversation or let's say within the
same part of speech of a given person, if s/he was
talking with a particular emotion then suddenly a
change took place in his/her tone, the system would
be able to detect such change. We aim to design a
system that can interpret emotional states in speeches
and/or conversations and detect every emotional
change either from one person’s long speech or the
change that occurs when two or more different people
have a conversation.
Slimi, A., Nicolas, H. and Zrigui, M.
Detection of Emotion Categories’ Change in Speeches.
DOI: 10.5220/0010868100003116
In Proceedings of the 14th International Conference on Agents and Artificial Intelligence (ICAART 2022) - Volume 3, pages 597-604
ISBN: 978-989-758-547-0; ISSN: 2184-433X
Copyright
c
2022 by SCITEPRESS – Science and Technology Publications, Lda. All rights reserved
597

Our proposed model is based on the Connectionist
Temporal Classification (CTC) loss. It takes a long
sequence of data as an input, processes it through a
Convolutional Neural Network (CNN) followed by a
Recurrent Neural Network (RNN) to detect pertinent
features and feeds it to the CTC which will in return
determine the sequence of emotion categories
presented in the input speech. To evaluate our
model’s performance, we have introduced two new
evaluation metrics: the ECER (Emotion Change Error
Rate) and the ECD (Emotion Change Detection).
In the remainder of this paper, the second section
focuses on a few significant works that are connected.
The proposed model is detailed in the third section.
The fourth section sheds lights upon some
information on the datasets that were utilized to
assess our model's performance. Detailed results
along with the new evaluation metrics are provided in
the fifth section. A depth analysis and discussion are
presented in section six. Finally, in Section 7, we
provide a summary of this article and discuss our
future work.
2 THE STATE OF THE ART
Several recent researches have focused on the
emotion recognition from speech. The work of
Mustaqeem and Kwon (2020a) focuses mainly on the
pre-processing phase where they used an adaptive
threshold-based algorithm to remove silence, noises
and irrelevant information, then a spectrogram is
generated and fed to a CNN. In the work of
Aouani
and Ayed (2020) a vector of 42 features was extracted
from each signal. Then, they have deployed an Auto-
Encoder (AE) to reduce the data representation and to
select pertinent features. The output of the AE will be
passed to an SVM to classify speeches and determine
emotions. Slimi et al. (2020) have used log-mel
spectrograms as an input for a shallow neural network
(SNN) to prove that neural networks can work with
small datasets. Once the spectrograms were
generated, they have resized them to be able to feed
them to the first layer of the neural network. In the
work of Mustaqeem and Kwon (2020b), different
blocks were used in the SER framework. They have
used a ConvLSTM (combination of CNN and LSTM)
for local feature learning block (LFLB), a GRU
(gated recurrent units) for global features learning
block (GFLB) and the center loss along with the
softmax for multi-class classification. In the work of
Issa et al. (2020) five different feature sets were used
and tested using a CNN: Mel-frequency Cepstral
Coefficients (MFCCs) Mel-scaled spectrogram,
Chromagram, Spectral contrast feature and Tonnetz
representation. However, despite the variety of
feature extraction algorithms and classification
techniques, they all share one common point which is
recognizing emotions from pre-segmented data with
one global label.
For the emotion change detection, fewer papers
have been published. Huang et al (2015) have worked
on detecting the instant of emotion change and
transition points from one emotion to another. A
Gaussian Mixture Models (GMM) with and without
prior knowledge of emotion-based methods was used
to detect emotion change among only four different
emotions. However, their main focus was on arousal
and valence. Their method consists of using a double
sliding window consisting of both previous and
current fixed-length windows. Within these two
windows, which span multiple frames, features are
extracted based on the frame and used to calculate
probabilities. Scores, which comprise a linear
combination of log likelihoods, are calculated and
compared to a threshold during the detection phase in
order to make a decision. If a score is above the
threshold within the tolerance range of the actual
point of change, then a change occurs. To test their
model, they have used Detection Error Trade-off
(DET) curve and Equal Error Rate (EER). In the
paper of (Huang and Epps, 2016) , authors have
explored the problem of identifying points of
emotional change over time in terms of testing
exchangeability using a martingale framework which
is a sort of stochastic process that employs
conditional expectations. It occurs when a collection
of random variables is repeated at a specific time.
When a new data point is seen in the martingale
framework, hypothesis testing is performed to
determine whether a concept change occurs in the
data stream or not. In this process data points (frame-
based features) of speech are observed point by point.
Their goal was to identify changes in emotional
categories (neutral and emotional), as well as within
dimensions (positive and negative in arousal and
valence). They have used two sets of frame-level
acoustic features: the MFCCs and the Geneva
Minimalistic Acoustic Parameter Set (eGeMAPS).
The model of Huang and Epps (2018) consists of
detection the emotion change points in time as well as
assessing the emotion change by calculating the
magnitude of emotion changes along with the types
of emotion change. They have used 88-dimensional
eGeMAPS features and three different regression
models: Support Vector Regression (SVR),
Relevance Vector Machine (RVM) and Output-
Associative RVM (OA-RVM).
ICAART 2022 - 14th International Conference on Agents and Artificial Intelligence
598
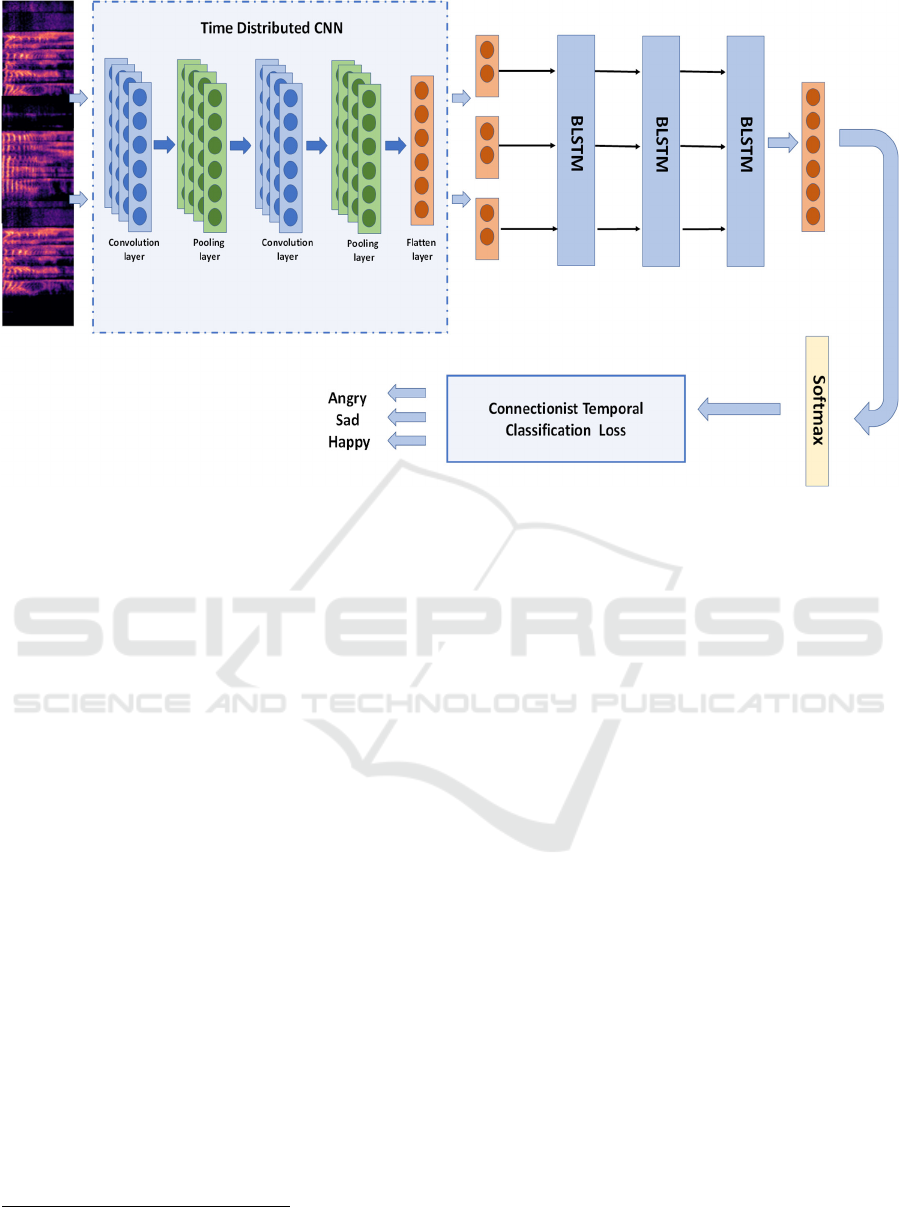
Figure 1: Proposed model.
3 PROPOSED MODEL
The main goal of our work is to predict a sequence of
emotions from a given input. Audio signals have been
used in a lot of domains such as speech recognition,
gender recognition, speaker identification, emotion
recognition etc. The first common steps in all of these
fields, is to find the best way to represent the audio or
to extract information that could be useful for the
classification. Depending on the task, feature vectors
(Trigui et al, 2016), phonemes (Terbeh and Zrigui,
2017; Maraoui et al., 2018), unsupervised learning of
semantic audio representations (Jansen et al., 2018)
were used.
Over the past few years, several feature extraction
algorithms have been deployed to design a robust
speech emotion recognition system such as Mel
Frequency Cepstral Coefficients (MFCC), Zero
Crossing Rate (ZCR), Harmonic to Noise Rate
(HNR) and Teager Energy Operator (TEO) (Aouani
and Ayed, 2020). Despite the diversity of the feature
extraction approaches, the Log-Mel-Spectrogram,
which are the plots of signal frequencies as they
change over time, remains to most effective audio
representation for speech emotion recognition
systems (Slimi et al., 2020;
Yenigalla et al., 2018)
.
1
https://github.com/keras-team/keras/blob/master/keras/
layers/wrappers.py
3.1 CNN-BLSTM
Since the Spectrograms are 2D plots, it is more
suitable to use CNN as a classification model, since
they are mainly designed for image recognition tasks.
The major benefit of CNN over other architectures is
that it automatically recognizes essential features
without the need for human intervention. Although
the audio signals will be transformed into images, the
CNN solely is not enough considering that we dealing
with sequential data. For that reason, we considered
using the CNN-BLSTM architecture.
The CNN layers were used to extract a sequence
of features and RNN layers were used to propagate
information through this sequence. Yet, the CNN
models are commonly known for receiving and
processing only one image at a time. That will be
ideal if every input corresponds to one label
(emotion) but in our case, every input is aligned with
one or more successive emotions. What we need is to
determine the sequence of emotions so it is required
to repeat several emotion-detection tasks. We can
think about cutting up a sequence of data into several
frames and determine the emotion category on each
single frame. A solution to our problem is to use the
Time Distributed Layers
1
. Each frame will have its
own convolutions flow, where we can see it as one
Detection of Emotion Categories’ Change in Speeches
599

neural network per frame. The Time Distributed
Layers will apply the same convolution and pooling
to several frames and produce output per input.
As shown in Figure 1, the model that was used to
detect the change of emotions is composed of a
Convolutional Neural Network (CNN) followed by a
Recurrent Neural Network (RNN). The RNN here is
used to make sure that we process the frames with
time notion. The RNNs suffer from the vanishing
gradient problem where an information loss can occur
for long sequences, and this can be avoided by using
an LSTM which uses more special units in addition
to the RNN’s standard units. A BiLSTM consists of
using two LSTMs in both directions, meaning that the
first takes the sequence of features in a forward
direction and the second takes the sequence of
features in a backward direction so that the
performance can be enhanced by knowledge of the
context.
The last layer of the CNN-BLSTM architecture
will be passed to a fully connected layer with a
softmax function as an activation function. Usually,
the softmax layer contains n units where n represents
the number of labels in the dataset. In our work, the
softmax will contain n+1 units where the additional
unit represents the blank label (the separation
between two emotions). Its units reflect the likelihood
that a given label will be present at a given time step.
In section 3.2, we will explain in depth the reason
behind adding an extra unit.
3.2 CTC (Connectionist Temporal
Classification)
Generally, to perform classification, every input
needs to have its own label. In the case of emotion
categories change, every part of speech should have
its corresponding label. In order to predict the
emotions from sequential data, we need to pre-
segment the data and specify for each horizontal
position of the speech the corresponding label. To
make things a bit more formal, we want to map to
sequence of audio signals 𝑋=[𝑥
,𝑥
,…,𝑥
] to a
corresponding label sequence 𝑌=[𝑦
,𝑦
,…,𝑦
] .
Unfraternally, such alignment is hard to obtain since
emotions are not fixed and unchangeable, yet, they
constantly change throughout time and the ratio of the
lengths of both sequences can vary. One other thing
to be mentioned is that, when there is no accurate
alignment, manual alignment is not practical and it is
time-consuming.
The CTC loss averts all these challenges by taking
as inputs, the output of the CNN-BiLSTM along with
the corresponding sequence of ground-truth labels
and accomplish the task without any assistance. It will
provide an output distribution across all potential
outputs of a specific input. This distribution can be
used to infer a likely output or to estimate the
likelihood of a particular output. So, what we want is
to get the most likely output. We can do that by
calculating:
𝑌
∗
=𝑎𝑟𝑔max
(
𝑝(𝑌|𝑋)
)
(1)
Note that earlier we have stated that the output of
the model is n+1. The additional unit, which is a blank
that denotes the separation between two different
speeches having different emotions. Which means
that whenever a change of labels occurs, the blank
label is added. For this reason, the CTC uses a
function F to map the sequence of probabilities S to a
sequence of predicted labels Y. The function F works
by eliminating the repeated labels along with the
blank label. So, given a sequence S, which denotes
the output of the Softmax, the conditional probability
of having an output sequence Y given an input
sequence X is:
𝑝
(
𝑌
|
𝑋
)
=𝑝
(
𝑆
|
𝑋
)
(
)
(2)
So, the input of the CTC will be the output of the
softmax function of different timesteps. The CTC will
parse the output, once it finds the blank label, it
eliminates it and combines all successive similar
labels into one label.
Solving equation (1) is expensive and time
consuming, so in practice, it is recommended to
follow the methods of Graves et al. (2006). In their
work, the authors have proposed the best path
decoding which consists of choosing the most likely
label for each time frame, and the prefix search
decoding in which the output sequence is divided into
time steps on which will apply the standard Forward-
Backward algorithm.
4 DATA PREPARATION
Since the existing datasets are already pre-segmented,
we create a new dataset by combining two or more
utterances together to obtain long input sequences.
Combining the utterances involves combining the
labels of each single utterance, so we go from an
utterance and its corresponding label to a list of
utterances and its corresponding list of labels.
ICAART 2022 - 14th International Conference on Agents and Artificial Intelligence
600
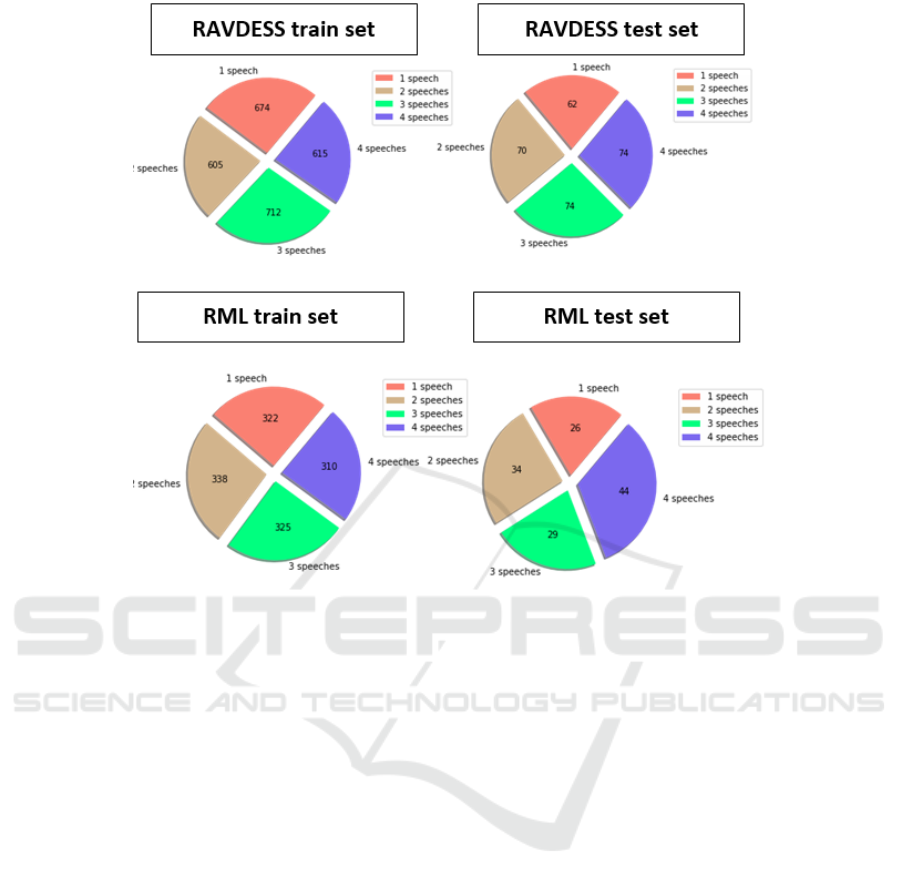
Figure 2: The sequences combinations for both datasets.
4.1 Datasets
Two datasets have been used to test our model: the
first is the RAVDESS (
Livingstone and Russo, 2018). It
is an English dataset that contains 1440 audio files
recorded by 24 people. It contains two intensity levels
and 8 different categories in total (Happy, sad,
disgust, neutral, calm, angry, surprised and fearful).
The second dataset is the RML dataset (
Xie and L.
Guan, 2013)
which consists of 720 files recorded by 8
actors. There are six different languages presented in
this dataset (English, Italian, Mandarin, Urdu,
Punjabi and Persian) and 6 different emotional
categories (Disgust, Happiness, Fear, Anger, Surprise
and Sadness).
4.2 Data Augmentation
In practice, DL models require huge amount of data
to be well trained, otherwise they will not be able to
achieve high accuracy (Slimi et al., 2020). The
datasets that are used for emotion recognition from
speeches are small and this would lead to low
performance. One of the solutions that can prevent
this problem is via augmenting the dataset.
Audio Data Augmentation consists of altering
existing dataset to get a bigger dataset. Models that
are trained with augmented data will be less
vulnerable to distortions and consequently more
robust, as they have learned to avoid insignificant
aspects. Data augmentation was used in a lot of
domains such as Computer Vision application, speech
recognition and even in speech emotion recognition
(Zhu et al., 2018; Padi et al., 2020). There are lots of
techniques. In our work, we have used the most
known four techniques which are adding white noise
with the original signal, shifting the audio signal by a
constant factor to move it to the right along time axis,
time stretching by changing the speed without
affecting the sound’s pitch and finally changing the
pitch without affecting the speed.
4.3 Sequence Structuring
In order to be able to detect the emotion change, we
need long duration audio sequences of one or more
person expressing several emotions successively,
which is not the case with existing datasets for speech
emotion recognition. The existing datasets are
composed of pre-segmented speeches where each
audio file contains one single person talking and
Detection of Emotion Categories’ Change in Speeches
601
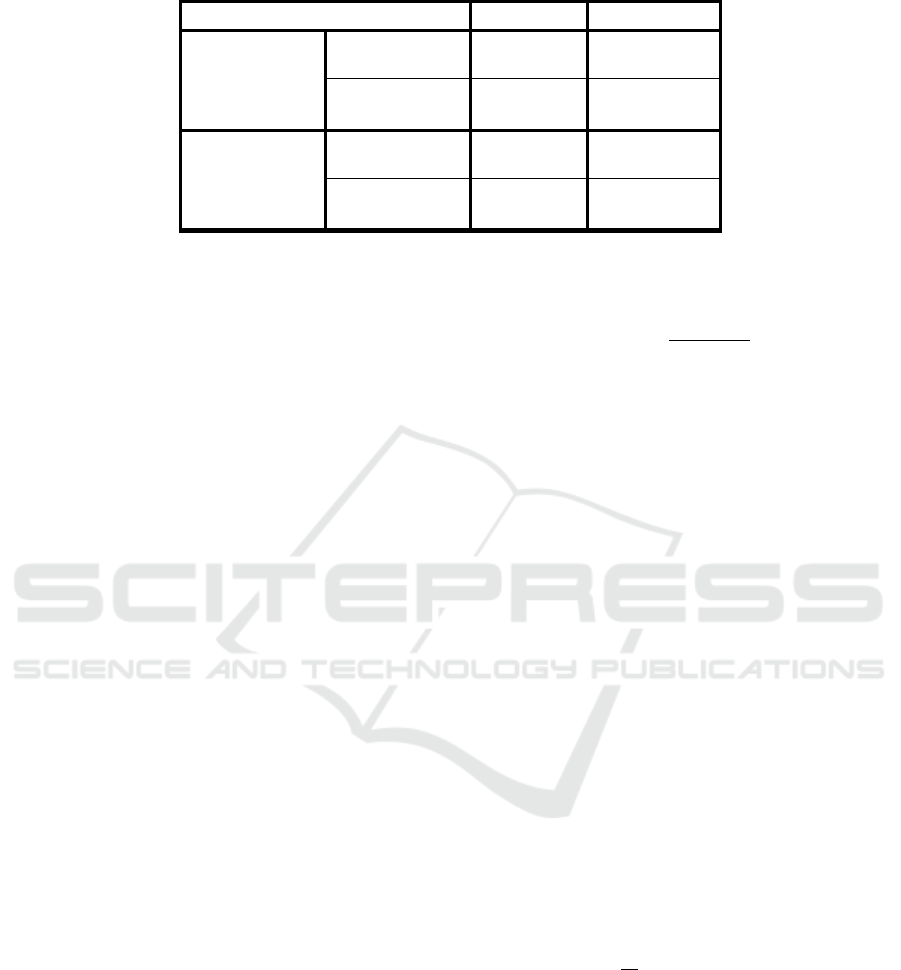
Table 1: The ECER and Accuracy of both datasets.
ECER Accuracy
RML
Original
datase
t
58.34% 41.66%
Augmented
datase
t
16.32% 83.68%
RAVDESS
Original
datase
t
62.3% 37.70%
Augmented
datase
t
21.19% 78.81%
expressing one single emotion. For this reason, we
have randomly combined several speeches together.
Each sequence contains from one to four different
speeches. The speeches are combined randomly
where a sequence could contain either several
speeches of the same person or different persons.
5 EXPERIMENTS AND RESULTS
Approximately, 80% of the data were used for
training, 10% to fine tune and validate the model
whereas 10% of the data were used to test it.
5.1 Model Tuning
The CNN is composed of two Convolutional layers
with ReLU activation, two Max-Pooling layers and a
flatten layer. We have used three layers of BiLSTM
followed by a Dense layer and a Softmax layer. A
dropout of 0.1 value is used to prevent the overfitting.
For the CTC, we have used the CTC Keras model
(Soullard et al., 2019). As for the optimization, we
have used the Adam optimizer with a learning rate
equals to 10
.
5.2 Evaluation Metrics
As mentioned in Section 1, there was not much
research in the domain of speech change detection
which makes it hard to establish comparisons. For this
particular reason, we propose the ECER metric which
is inspired from the WER (
Park et al., 2008) that is used
to determine a speech recognition system’s
performance (Labidi et al., 2017). Hence, this metric
could be used as reference for future researches.
5.2.1 Emotion Change Error Rate (ECER)
Given two sequences of labels, the first represents the
GT labels and the second represents the model’s
prediction, the ECER is calculated as follows:
𝐸𝐶𝐸𝑅 =
𝑆+𝐷+𝐼
𝑁
(3)
Where S is the number of labels that were
replaced, D is the number of the labels that were
disregarded, I is the number of labels that were
inserted, C is the number of correct labels and N is the
number of emotions in the GT sequence (N=S+D+C).
The Accuracy is thus can be calculated as:
𝐴
𝑐𝑐𝑢𝑟𝑎𝑐𝑦 = 1 − 𝐸𝐶𝐸𝑅 (4)
These two metrics do not only measure if the system
has successfully detected emotions change, but they
also measure whether or not the system has
recognized the expressed emotion.
5.2.2 Emotion Change Detection (ECD)
Although the ECER tells a lot about the system
performance, the goal here is to determine whether or
not our model is capable of detecting all the emotional
changes that have occurred in a sequence.
Given a test set T of size m and a prediction list P
of size m, the Emotion Change Detection (ECD) rate
is calculated as follows:
𝐸𝐶𝐷 =
1
𝑚
𝐸(𝑡,𝑝)
∈, ∈
(5)
Where 𝐸
(
𝑋,𝑌
)
=1 if the length of X equals the
length of Y and 0 if not.
5.3 Results
For each one of the datasets, two experiments have
been conducted: the first using the original dataset
and the second using the augmented dataset.
ICAART 2022 - 14th International Conference on Agents and Artificial Intelligence
602

Table 1 shows the ECER and the Accuracy of
each one of the experiments. For both original
datasets (without augmentation) the ECER was too
high and the accuracy was too low. The training
accuracy was also too low leaning that the model
suffers from underfitting and it was not able to learn.
The model was too deep and the amount of data was
not enough for such model. With more data, both the
ECER and the accuracy were improved significantly
for both datasets.
Table 2 shows the ECD of the two datasets. Since
the model was not able to learn due to the lack of data,
the ECD was a little bit low. However, with more data
to well train the model, the results were improved.
Table 2: The ECD of both datasets.
ECD
RML
Original
datase
t
77%
Augmented
datase
t
100%
RAVDESS
Original
datase
t
65%
Augmented
datase
t
100%
6 ANALYSIS AND DISCUSSION
First, we have tested our model on totally random
data sequences. The results have shown that the size
of the dataset matters and affects the accuracy i.e., the
more data we have, the better results we get. And
although the RAVDESS has bigger size, it achieved
less accuracy values compared to the RML and this
can be explained by the fact that RAVDESS is
considered to be as one of the hardest datasets since
the human accuracy for this dataset is around 60%
(
Livingstone and Russo, 2018).
Second, we have adjusted manually some of the
input sequences for both training and testing datasets.
For example, with a dataset of four emotion
categories, we would have five possible outputs
𝑦
,…,𝑦
where 𝑦
denotes the blank, that we will
use to detect the change. If the output of the model is
[𝑦
𝑦
𝑦
𝑦
𝑦
𝑦
𝑦
𝑦
𝑦
𝑦
𝑦
] then the final result after
using the CTC should be [𝑦
𝑦
𝑦
𝑦
] . We have
formed some data sequences where there are two
consecutive speeches of different people but with the
same label and two successive consecutive speeches
of the same person with the same label. The goal here
is to determine whether the CTC will be capable of
separating between two consecutive utterances with
the same label or it will just consider them as one
single speech. The ECD was always 100% which
means our model has successfully learned to separate
between different speeches even though they have the
same label. This could be helpful when trying to
deploy our model in real time emotion detection
system in conversation, which means the system will
be capable of determining the emotional state of each
speaker independently of the other.
Getting an ECD equals to 100% and a low value
for the accuracy, can be interpreted by the fact that
the model has succeeded to detect all the emotion
changes through all the sequences, yet it failed to
recognize the emotions, i.e., for each input sequence,
the model succeeded to detect a change has been
occurred but sometimes fails the determine what is
the label. The task of well recognizing the emotions
remains a challenge as, to the best of our knowledge,
none of the recent researches have achieved more
than 90% accuracy for both datasets.
7 CONCLUSIONS
Detecting categories changes in emotional speeches
has been the focus of this research article. we have
introduced a model which was capable of
successfully detecting emotion categories changes.
Yet, the model in some cases struggles to recognize
emotion. Our next work should focus on designing a
robust emotion recognition model that can be directly
deployed in emotion change detection systems.
To evaluate our model, we have proposed new
evaluation metrics: the ECER to determine the
performance of the system in detecting the emotional
change and recognizing emotion, and the ECD to
determine whether or not the model has detected all
emotional changes. The amount of the data was not
enough to train the neural network so we have used
data augmentation techniques to increase the amount
of data, which helped in improving the accuracy.
REFERENCES
Zhaocheng Huang and Julien Epps.2018. Prediction of
sEmotion Change from Speech. Frontiers ICT 5: 11
Zhaocheng Huang, Julien Epps, Eliathamby Ambikairajah.
2015. An investigation of emotion change detection
from speech. INTERSPEECH 2015: 1329-1333
Zhaocheng Huang, Julien Epps. 2016. Detecting the instant
of emotion change from speech using a martingale
framework. ICASSP 2016: 5195-5199
Detection of Emotion Categories’ Change in Speeches
603

Hadhami Aouani, Yassine Ben Ayed. 2020. Speech
Emotion Recognition with deep learning. KES 2020:
251-260
Yann Soullard, Cyprien Ruffino, Thierry Paquet.
CTCModel. 2019. A Keras Model for Connectionist
Temporal Classification. [Research Report] université
de Rouen Normandie. ⟨hal-02420358⟩
Anwer Slimi, Mohamed Hamroun, Mounir Zrigui and,
Henri Nicolas. 2020. Emotion Recognition from
Speech using Spectrograms and Shallow Neural
Networks. The 18th International Conference on
Advances in Mobile Computing & Multimedia
(MoMM2020), November 30- December 2, 2020,
Chiang Mai, Thailand. ACM, New York, NY, USA, 7
pages. https://doi.org/10.1145/3428690.3429153
Dias Issa, M. Fatih Demirci, Adnan Yazici. 2020. Speech
emotion recognition with deep convolutional neural
networks. Biomed. Signal Process. Control. 59: 101894
Naim Terbeh, Mounir Zrigui. 2017. A Robust Algorithm
for Pathological-Speech Correction. PACLING 2017:
341-351.
Alex Graves, Santiago Fernández, Faustino Gomez, and
Jürgen Schmidhuber. 2006. Connectionist temporal
classification: labelling unsegmented sequence data
with recurrent neural networks. In Proceedings of the
23
rd
international conference on Machine learning,
pages 369 376. ACM
Xie and L. Guan 2013. Multimodal Information Fusion of
Audiovisual Emotion Recognition Using Novel
Information Theoretic Tools. International Journal of
Multimedia Data Engineering and Management, vol. 4,
no. 4, pp. 1-14, 2013.
Livingstone SR, Russo FA. 2018. The Ryerson Audio-
Visual Database of Emotional Speech and Song
(RAVDESS): A dynamic, multimodal set of facial and
vocal expressions in North American English. PLoS
ONE 13(5): e0196391.
Mohsen Maraoui, Naim Terbeh, Mounir Zrigui. 2018.
Arabic discourse analysis based on acoustic, prosodic
and phonetic modeling: elocution evaluation, speech
classification and pathological speech correction. I. J.
Speech Technology 21(4): 1071-1090
Zhu X., Liu Y., Li J., Wan T., Qin Z. (2018) Emotion
Classification with Data Augmentation Using
Generative Adversarial Networks. In: Phung D., Tseng
V., Webb G., Ho B., Ganji M., Rashidi L. (eds)
Advances in Knowledge Discovery and Data Mining.
PAKDD 2018. Lecture Notes in Computer Science, vol
10939. Springer, Cham. https://doi.org/10.1007/978-3-
319-93040-4_28
Mustaqeem, Soonil Kwon. 2020a. A CNN-Assisted
Enhanced Audio Signal Processing for Speech Emotion
Recognition. Sensors 20(1): 183 (2020)
Sarala Padi, Dinesh Manocha, Ram D. Sriram. 2020. Multi-
Window Data Augmentation Approach for Speech
Emotion Recognition. CoRR abs/2010.09895
Youngja Park, Siddharth Patwardhan, Karthik
Visweswariah, Stephen C. Gates.2008. An empirical
analysis of word error rate and keyword error rate.
INTERSPEECH 2008: 2070-2073
Mohamed Labidi, Mohsen Maraoui, Mounir Zrigui. 2017.
Unsupervised Method for Improving Arabic Speech
Recognition Systems. PACLIC 2017: 161-168
Aymen Trigui, Naim Terbeh, Mohsen Maraoui, Mounir
Zrigui. 2016. Statistical Approach for Spontaneous
Arabic Speech Understanding Based on Stochastic
Speech Recognition Module. Research in Computing
Science 117: 143-151
Promod Yenigalla, Abhay Kumar, Suraj Tripathi, Chirag
Singh, Sibsambhu Kar, Jithendra Vepa. 2018. Speech
Emotion Recognition Using Spectrogram & Phoneme
Embedding. INTERSPEECH 2018: 3688-3692.
Mustaqeem, Soonil Kwon. 2020b. CLSTM: Deep Feature-
Based Speech Emotion Recognition Using the
Hierarchical ConvLSTM Network. Mathematics 2020,
8, 2133. https://doi.org/10.3390/math8122133
Aren Jansen, Manoj Plakal, Ratheet Pandya, Daniel P. W.
Ellis, Shawn Hershey, Jiayang Liu, R. Channing
Moore, Rif A. Saurous. 2018. Unsupervised Learning
of Semantic Audio Representations. ICASSP 2018:
126-130
ICAART 2022 - 14th International Conference on Agents and Artificial Intelligence
604
