
Can Super Resolution Improve Human Pose Estimation in Low
Resolution Scenarios?
Peter Hardy
a
, Srinandan Dasmahapatra and Hansung Kim
b
Vision, Learning and Control research group (VLC), School of Electronics and computer Science (ECS)
University of Southampton, U.K.
Keywords:
Super Resolution, Human Pose Estimation, Keypoint Detection.
Abstract:
The results obtained from state of the art human pose estimation (HPE) models degrade rapidly when evalu-
ating people of a low resolution, but can super resolution (SR) be used to help mitigate this effect? By using
various SR approaches we enhanced two low resolution datasets and evaluated the change in performance of
both an object and keypoint detector as well as end-to-end HPE results. We remark the following observations.
First we find that for people who were originally depicted at a low resolution (segmentation area in pixels),
their keypoint detection performance would improve once SR was applied. Second, the keypoint detection
performance gained is dependent on that persons pixel count in the original image prior to any application
of SR; keypoint detection performance was improved when SR was applied to people with a small initial
segmentation area, but degrades as this becomes larger. To address this we introduced a novel Mask-RCNN
approach, utilising a segmentation area threshold to decide when to use SR during the keypoint detection step.
This approach achieved the best results on our low resolution datasets for each HPE performance metrics.
1 INTRODUCTION
Human Pose Estimation (HPE) and keypoint detec-
tion are important research topics in computer vi-
sion, with many real-world applications such as ac-
tion recognition and interactive media (Luvizon et al.,
2020) (Khan and Wan, 2018). Although modern HPE
models obtain impressive results on popular datasets
such as COCO (Lin et al., 2014) and MPII (An-
driluka et al., 2014), their performance degrades sub-
stantially when evaluating people of a small scale and
low resolution (Jin et al., 2020). During keypoint
detection, current HPE models utilise Convolutional
Neural Networks (CNN). However, as convolutions
have a limited robustness to an objects scale (Taka-
hashi et al., 2017), ongoing work creating scale in-
variant CNN architectures remains a key research fo-
cus (Ngiam et al., 2010) (Noord and Postma, 2016).
In contrast, little research exploring how a persons’
resolution can be improved for HPE has been under-
taken. Super resolution (SR) has been touted within
object detection as a panacea for issues of image qual-
ity (Na and Fox, 2020) (Wang et al., 2020), but could
it also benefit HPE? This paper will explore multi-
a
https://orcid.org/0000-0002-7682-2110
b
https://orcid.org/0000-0003-4907-0491
ple SR techniques on low resolution imagery to ad-
dress this question. By evaluating the performance of
a HPE model at different stages of the end-to-end pro-
cess, we will establish the effect that SR has on HPE
and how it varies depending on the target persons’ ini-
tial resolution.
2 BACKGROUND
2.1 Human Pose Estimation
The objective of HPE is to locate and group specific
keypoints or bodyparts (shoulder, ankle, etc) from a
given image in order to create a human pose. Cur-
rent HPE methods fall into two categories: bottom-
up and top-down approaches. Bottom-up approaches
only consist of a keypoint detector, which is used to
detect all keypoints in a given image. They then use
a grouping algorithm, or human body fitting model,
to associate the keypoints with each other in order to
create a human pose. By comparison, top-down ap-
proaches utilise both an object and keypoint detection
component. They start by first detecting the bound-
ing box of each person in an image and then perform
keypoint detection inside each bounding box. This
494
Hardy, P., Dasmahapatra, S. and Kim, H.
Can Super Resolution Improve Human Pose Estimation in Low Resolution Scenarios?.
DOI: 10.5220/0010863700003124
In Proceedings of the 17th Inter national Joint Conference on Computer Vision, Imaging and Computer Graphics Theory and Applications (VISIGRAPP 2022) - Volume 4: VISAPP, pages
494-501
ISBN: 978-989-758-555-5; ISSN: 2184-4321
Copyright
c
2022 by SCITEPRESS – Science and Technology Publications, Lda. All rights reserved

negates the need for a grouping algorithm as all the
keypoints in each bounding box are assumed to cor-
respond to the same person (Chen et al., 2020). As
the number of people in a given scene increases, so
does the computational cost of top-down approaches.
However, this approach is more accurate overall as
more people within a scene are detected. The most
popular approach to keypoint detection (Chen et al.,
2018) (Sun et al., 2019) (Cao et al., 2019) (Cheng
et al., 2020) is known as heatmap regression (Bulat
and Tzimiropoulos, 2016). A CNN head extracts the
initial features and reduces the resolution of the input
image, this is followed by a main body which out-
puts feature maps with the same size as the input fea-
ture map, and is followed by a regressor which esti-
mates the predicted heatmaps. Ground truth heatmaps
are constructed by using a 2D Gaussian kernel on the
given ground truth keypoint and are used to supervise
the predicted heatmaps by reducing the L2 loss. Since
its introduction by Tompson et al. (Tompson et al.,
2014), heatmaps have become the default method for
keypoint detection due to its ease of implementation
and much higher accuracy than traditional coordinate
regression.
2.2 Super Resolution
Currently used in multiple real-world applications
such as security (Zhang et al., 2010) (Rasti et al.,
2016) and medical imaging (Isaac and Kulkarni,
2015) (Huang et al., 2017), SR refers to the process
of recovering accurate high resolution images from
their low resolution counterparts. Modern state of the
art SR performance is obtained from deep learning
approaches, such as generative adversarial networks
(GAN) (Wang et al., 2019) (Ledig et al., 2017) and
auto-encoder architectures (Zhang et al., 2020) (Hu
et al., 2019). While there exists many different ways
of assessing the performance of SR models (structural
similarity index (Wang et al., 2004), feature similarity
index (Zhang et al., 2011), etc) the most commonly
used metric is the peak signal-to-noise ratio (PSNR).
Although PSNR is regularly used as a training metric,
the output images generated by maximising PSNR
correlates poorly with image quality as perceived by
the human eye (Erfurt et al., 2019) (Wang et al.,
2002). This disparity is surprising when findings of
recent studies have improved the overall object de-
tection performance in low resolution imagery when
combining SR with an object detector (Na and Fox,
2020) (Wang et al., 2020). Providing more evidence
that deep learning approaches may not perceive im-
age quality the same way as humans, and may in fact
learn completely different associations when identify-
ing objects. Some studies however have found a neg-
ative impact on object detection performance due to
SR if the resolution of the object in the original image
is extremely low (Shermeyer and Etten, 2019).
3 METHOD
While it is difficult to define low resolution with a
numerical value, intuition tells us that a low resolu-
tion image will be more pixelated and less informative
than a high resolution one. We can therefore infer that
commonly used computer vision datasets are not low
resolution, due to the clarity of the images present. In
order to evaluate if SR can improve the HPE results
of low resolution people, we used bicubic downsam-
pling to create two low resolution versions (
1
2
and
1
4
scale) of the COCO validation dataset. We then ap-
plied various SR techniques on these low resolution
datasets to increase their resolution by a factor of 4.
This would then allow us to compare the HPE results
between the low resolution images and their SR coun-
terparts. The COCO dataset was chosen for this study
as each images annotation also contains the segmen-
tation area (in pixels) of each person in an image. This
allowed us to investigate how the effects of SR differ
depending on the persons starting segmentation area,
as SR may have an adverse effect the lower the ini-
tial segmentation area due to the limited amount of
starting pixels to reconstruct a high resolution per-
son from. The SR approaches we used to enhance
our images were standard bicubic interpolation, ESR-
GAN (Wang et al., 2019) and USRNET (Zhang et al.,
2020). For ESRGAN and USRNET we used a GAN
version of each model (ESRGAN and USRGAN), and
a PSNR maximising version of each model (ESRNET
and USRNET). For our HPE model we used HRNET
(Sun et al., 2019), a top-down based approach which
achieved one of the highest accuracies across various
keypoint datasets at the time of writing. We chose a
top-down approach for this study as it consists of both
an object and keypoint detection component, which
allowed us to test the possible effects that SR has at
multiple stages of the end-to-end HPE process.
3.1 Object Detection with Super
Resolution
The object detector that we used was Faster R-CNN
with a resnet-101 and feature pyramid network back-
bone (Lin et al., 2017). This was trained on the stan-
dard unaltered version of the COCO training dataset
and the AP and AR performance of this model on the
Can Super Resolution Improve Human Pose Estimation in Low Resolution Scenarios?
495

Table 1: The person detection results on the default COCO
dataset.
Dataset AP AR
COCO 0.545 0.612
default COCO validation dataset can be seen in Table
1.
As the COCO annotation groups people into a
small, medium and large subgroup (S, M and L) de-
pending on that persons given segmentation area, a
persons subgroup would usually change when SR is
applied. In order to compare the effect that SR has
on each subgroup fairly, if someone was defined as
small, medium or large in the scaled down image, they
would also be defined as that subgroup in the results
of the SR image. It is for this reason we have not
reported the S, M, or L results of the default COCO
dataset as no fair comparison can be made. The re-
sults showing the average precision (AP) and aver-
age recall (AR) of our detector on the low resolution
datasets and their SR counterparts can be seen in Ta-
ble 2 and 3
Our results show that the overall performance (AP
and AR) of the object detector improved once SR was
applied. This concurs with previous studies in this
area (Wang et al., 2020) (Na and Fox, 2020). A recent
study however found that the lower the original reso-
lution of the object we are detecting, the worse the
object detector would perform after SR was applied
(Shermeyer and Etten, 2019). As the small subgroup
contained people with a segmentation area between
1 and 32
2
pixels, we could not confirm whether all
people of a smaller segmentation area had improved,
simply that this group as a whole did. In order to de-
termine if the improvements in detection rate were
skewed by performance variations in subgroups, we
conducted a further test. We created 24 new sub-
groups from our data, grouping people of a similar
segmentation area together. The segmentation areas
of people within each subgroup (1-24) for our
1
2
scale
dataset commenced at 1-500 and concluded at 11501-
12000 increasing by 500 for each subgroup. For the
1
4
scale dataset the segmentation areas of people within
each subgroup increased by 125, starting at 1-125 and
concluding at 2876-3000. We then evaluated the per-
formance of the object detector across these 24 sub-
groups. Our findings can be seen in Figure 1 which
shows the percentage increase or decrease in object
detection rate for each subgroup once SR had been
applied.
Contradicting with previous findings, our results
demonstrate that the lower the original segmentation
area of the object we wish to detect, the more likely
it will be detected once SR is performed. Addition-
ally, we found what seems to be a soft threshold of
3000 pixels, as shown by subgroup 6 in the left panel
(segmentation area of 2501-3000). People who had
an initial segmentation area below this threshold had
their detection rate improved once SR was performed
on them, aside from bicubic interpolation and ESR-
GAN for subgroup 2. For people above this threshold
however, it is not clear if the overall detection per-
formance would improve or worsen once SR was ap-
plied as the results seem to be sporadic in nature. In
the right panel the largest subgroup contained people
with a segmentation area of between 2876-3000, and
as we decrease the subgroup number, and therefore
initial segmentation area, there is a gradual improve-
ment in object detection rate.
3.2 Keypoint Detection with Super
Resolution
This section will examine how SR affects the keypoint
detection component of the end-to-end HPE process.
Our HRNET (Sun et al., 2019) model was trained
on the standard COCO training dataset and the AP
and AR performance when evaluating ground truth
bounding boxes in the original COCO dataset can be
seen in Table 4.
As our previous results have shown that the lower
the resolution of your object, the better the object de-
tection rate will be once SR had been performed. We
now wanted to determine if this also held true for key-
point detection. To eliminate object detection as a
variable, we provided HRNET with the ground truth
bounding boxes of people in each image. This al-
lowed us to analyse the overall effect that SR has on
keypoint detection in low resolution imagery, given
that the object detection results are identical. The
evaluation metric we used for this study is based on
Object Keypoint Similarity (OKS):
Σ
i
exp(−d
2
i
/2s
2
k
2
i
)δ(v
i
> 0)
Σ
i
δ(v
i
> 0)
, (1)
where d
i
is the Euclidean distance between the de-
tected and corresponding ground truth keypoint, v
i
is
the visibility flag of the ground truth keypoint, s is
the objects scale and k
i
is a per-keypoint constant that
controls falloff. In our results we report standard av-
erage precision and recall scores (Lin et al., 2014):
AP, the mean of the AP scores at 10 positions (OKS =
0.50, 0.55, ..., 0.90, 0.95), AP
M
for medium objects,
AP
L
for large objects, AR (the mean of AR scores
OKS = 0.50, 0.55, ..., 0.90, 0.95) and AR for medium
and large people (AR
M
and AR
L
respectively). AP
S
is
not reported during keypoint detection as people with
a segmentation area < 32
2
do not have their keypoints
annotated in the COCO dataset. The results of our
VISAPP 2022 - 17th International Conference on Computer Vision Theory and Applications
496

Table 2: The person detection results of the
1
2
scale low resolution (LR) dataset and the SR datasets obtained by upscaling the
LR dataset by a factor of 4. The best approach for each evaluation metric is highlighted in bold.
Dataset AP AP
S
AP
M
AP
L
AR AR
S
AR
M
AR
L
LR (
1
2
scale) 0.507 0.394 0.683 0.752 0.571 0.459 0.741 0.829
Bicubic 0.511 0.399 0.684 0.752 0.577 0.467 0.742 0.828
ESRGAN (Wang et al., 2019) 0.515 0.402 0.684 0.755 0.581 0.473 0.743 0.829
ESRNET (Wang et al., 2019) 0.521 0.409 0.692 0.752 0.589 0.483 0.749 0.832
USRGAN (Zhang et al., 2020) 0.522 0.410 0.689 0.756 0.588 0.481 0.749 0.832
USRNET (Zhang et al., 2020) 0.522 0.411 0.690 0.754 0.590 0.485 0.748 0.834
Table 3: The person detection results of the
1
4
scale low resolution (LR) dataset and the SR images obtained by upscaling the
LR dataset by a factor of 4. The best approach for each evaluation metric is highlighted in bold.
Dataset AP AP
S
AP
M
AP
L
AR AR
S
AR
M
AR
L
LR (
1
4
scale) 0.387 0.322 0.688 0.716 0.448 0.378 0.762 0.844
Bicubic 0.413 0.351 0.697 0.736 0.478 0.414 0.768 0.868
ESRGAN (Wang et al., 2019) 0.445 0.385 0.721 0.739 0.509 0.448 0.786 0.891
ESRNET (Wang et al., 2019) 0.454 0.394 0.728 0.749 0.519 0.459 0.793 0.886
USRGAN (Zhang et al., 2020) 0.456 0.396 0.729 0.743 0.521 0.461 0.793 0.874
USRNET (Zhang et al., 2020) 0.452 0.392 0.725 0.736 0.518 0.458 0.790 0.870
Figure 1: The percentage change in detection rate due to SR for each of our 24 subgroups created from
1
2
scale (left panel)
and
1
4
scale (right panel) datasets and their SR counterparts.
Table 4: The AP and AR performance of HRNET (Sun
et al., 2019) on the default COCO dataset when evaluating
ground truth bounding boxes.
Dataset AP AR
COCO 0.765 0.793
keypoint detector on the low and SR datasets can be
seen in Tables 5 and 6.
As our results show, the overall performance of
our keypoint detector (AP and AR) improved when
evaluating the SR versions of both the
1
2
and
1
4
scale
dataset. When we look closely however, we can see
that simply stating the performance would improve
for all observations would be incorrect. Examining
the keypoint detection performance for the large sub-
group of people (AP
L
and AR
L
) in the
1
2
scale dataset,
we can see that there was performance degradation as
a result of SR. Additionally, not every SR approach
we used improved the AP and AR of the medium
subgroup of people (AP
M
and AR
M
), as both bicu-
bic interpolation and ESRGAN actually made these
results worse. Our findings seemed to hint at a person
segmentation area threshold for keypoint detection,
above which using SR on a person would worsen the
performance of the keypoint detector. To confirm this,
we evaluated the change in keypoint detection perfor-
mance across our 24 subgroups. From this we could
determine if there is in-fact an upper limit in object
segmentation area, above which the keypoint detec-
tion performance would worsen once SR was applied.
The results are shown in Figure 2 and 3.
Our figures show that as the initial segmentation
area of the people we are evaluating increases, the
benefits gained by applying SR for keypoint detec-
tion decreases. For our dataset, the threshold beyond
which applying SR seems to have a negative affect on
keypoint detection, is a segmentation area of between
Can Super Resolution Improve Human Pose Estimation in Low Resolution Scenarios?
497
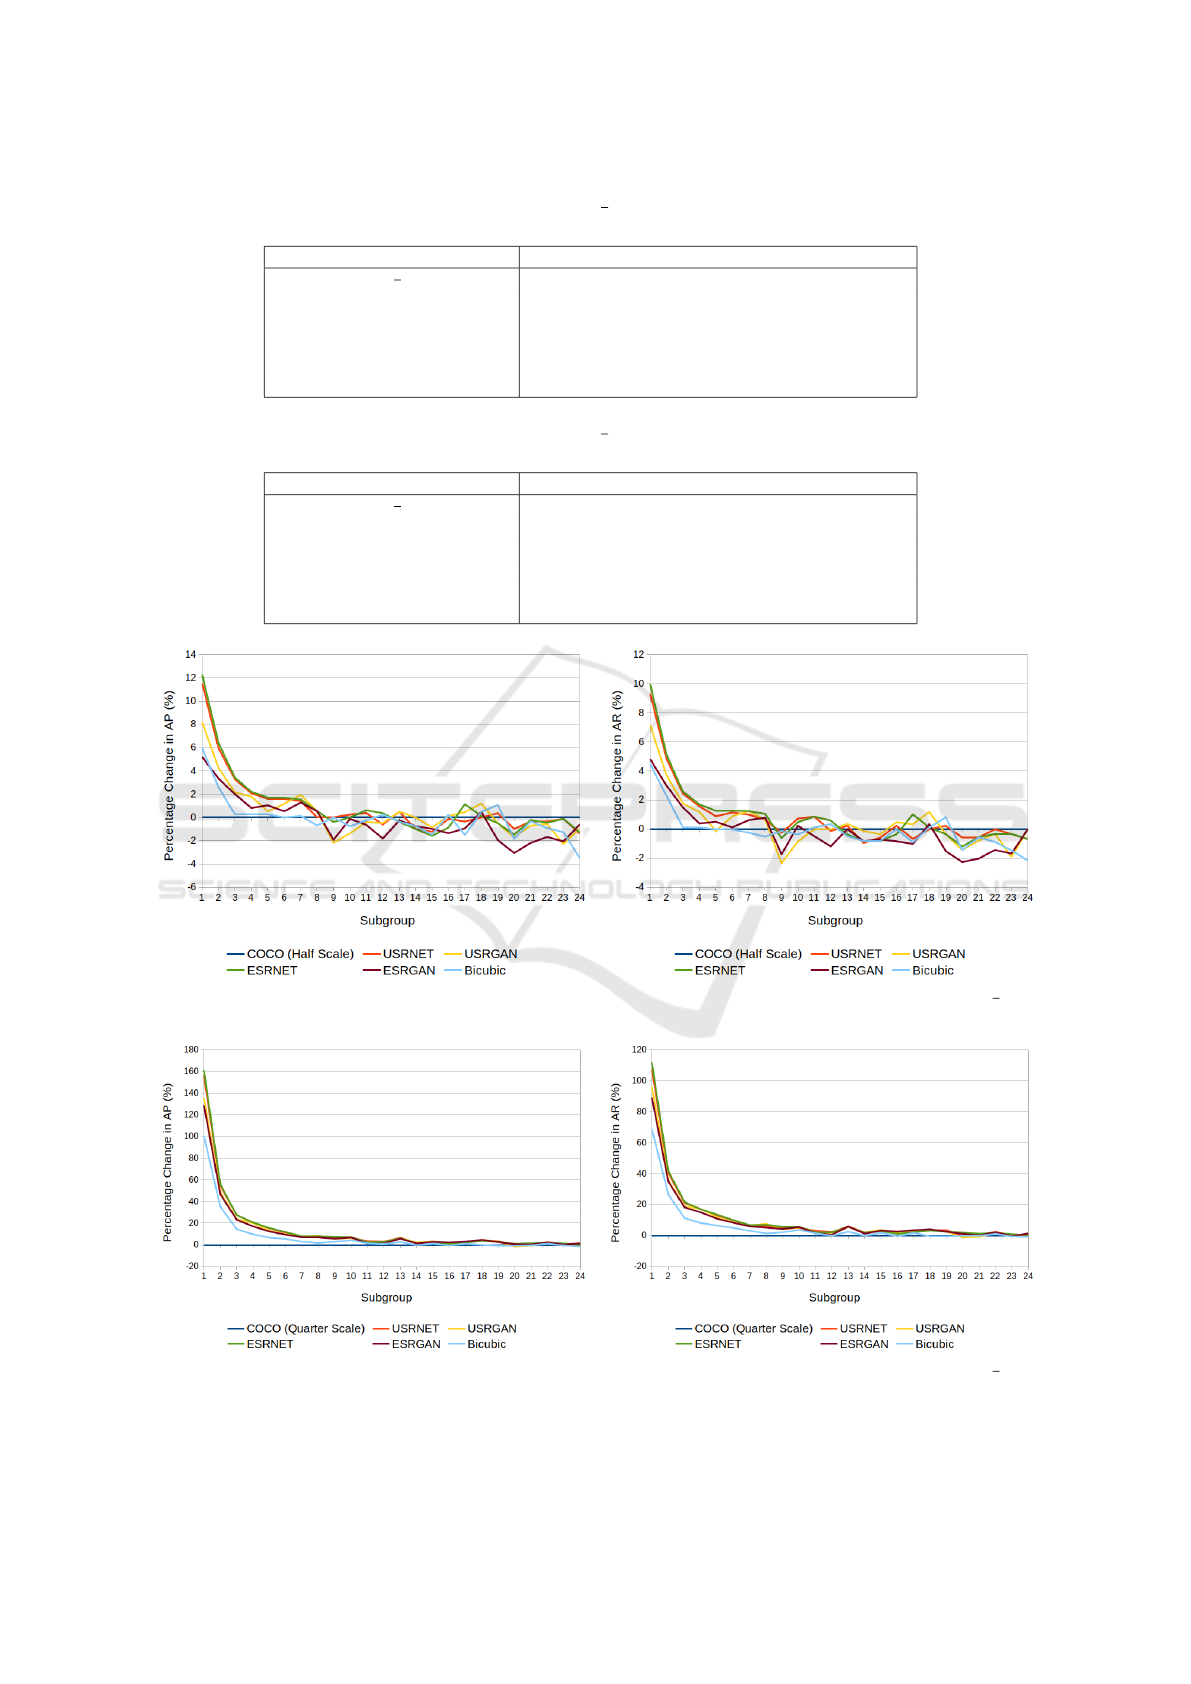
Table 5: The performance of HRNET (Sun et al., 2019) on the
1
2
scale dataset and that same dataset upscaled by a factor of 4
using the various SR techniques. The best result for each evaluation metric is higlighted in bold.
Dataset AP AP
M
AP
L
AR AR
M
AR
L
COCO
1
2
Scale 0.722 0.765 0.841 0.752 0.794 0.880
Bicubic 0.728 0.763 0.835 0.760 0.764 0.875
ESRGAN (Wang et al., 2019) 0.729 0.764 0.825 0.761 0.796 0.866
ESRNET (Wang et al., 2019) 0.744 0.774 0.831 0.773 0.803 0.873
USRGAN (Zhang et al., 2020) 0.735 0.769 0.826 0.766 0.798 0.870
USRNET (Zhang et al., 2020) 0.741 0.772 0.832 0.772 0.802 0.873
Table 6: The performance of HRNET (Sun et al., 2019) on the
1
4
scale dataset and that same dataset upscaled by a factor of 4
using the various SR techniques. The best result for each evaluation metric is higlighted in bold.
Dataset AP AP
M
AP
L
AR AR
M
AR
L
COCO
1
4
Scale 0.538 0.791 0.800 0.573 0.830 0.879
Bicubic 0.601 0.796 0.801 0.637 0.836 0.882
ESRGAN (Wang et al., 2019) 0.627 0.810 0.786 0.664 0.845 0.875
ESRNET (Wang et al., 2019) 0.649 0.813 0.801 0.684 0.848 0.888
USRGAN (Zhang et al., 2020) 0.635 0.810 0.794 0.670 0.846 0.882
USRNET (Zhang et al., 2020) 0.647 0.813 0.795 0.681 0.849 0.888
Figure 2: The percentage change in AP (left panel) and AR (right panel) due to SR across our 24 subgroups of the
1
2
scale
dataset and their SR counterparts.
Figure 3: The percentage change in AP (left panel) and AR (right panel) due to SR across our 24 subgroups of the
1
4
scale
dataset and their SR counterparts.
VISAPP 2022 - 17th International Conference on Computer Vision Theory and Applications
498

3501-4000 (subgroup 8 in Figure 2). As beyond this
value the percentage change in AP and AR once SR
was applied starts to become negative. For people
within our smallest subgroup however (subgroup 1 in
Figure 3) it is worth noting just how prominent the
performance increase is, as we observed a 160% in-
crease in AP performance and 110% increase in AR
performance.
3.3 End-to-End Results
This section will evaluate the final keypoint detection
performance obtained when using SR for the entire
end-to-end top-down HPE process. The results of
which can be seen in Table 7 and 8.
Our results show a clear overall improvement (AP
and AR) for keypoint detection when evaluating SR
instead of low resolution imagery. What is surprising
however is that there is still a performance decrease
for the larger people (AP
L
) in our
1
2
scale dataset
when SR is applied. As shown in Table 2, our object
detection results for our AP
L
subgroup was either the
same or improved once SR was applied. The results
in Table 7 however, shows that even though the ob-
ject detection results have slightly improved, SR has
made it harder for our keypoint detector to perform
optimally. In other words, it performed worse even
with better bounding boxes. As our final contribu-
tion for this study we therefore decided to introduce
an end-to-end top-down HPE approach that would ad-
dress this problem.
3.4 Mask-RCNN with a Segmentation
Area Threshold
By first applying SR to an image, Mask-RCNN (He
et al., 2017) would be used to find both the bound-
ing box and segmentation area of people within each
image. If the initial segmentation area of a partic-
ular person was above a given threshold, then key-
point detection is performed on the original image
in a re-scaled bounding box. If the area was below
the threshold however, then the SR image is used
throughout the end-to-end HPE process. By using
one of the best performing SR approaches (USRNET)
and the
1
2
scale dataset, we performed end-to-end top-
down HPE using a segmentation area threshold to de-
cide if the SR or original image should be used dur-
ing the keypoint detection step. Our threshold chosen
was a segmentation area of 3500 or less in the original
image, as this is where we began to observe minimal
benefits from SR as shown in Figure 2. If the persons
segmentation area was below this value then the SR
image would be used during keypoint detection. If
their segmentation area was greater however, then the
original image would be used during keypoint detec-
tion instead. The results of our mixed approach when
compared to simply using the
1
2
scale and USRNET
SR dataset can be seen in Table 9.
As the people in the large subgroup all have a seg-
mentation area above the threshold, the AP
L
of the
original
1
2
scale dataset and mixed approach are now
identical. The AR
L
has improved however, and this
is due to the our object detector finding more large
people in the SR than in the low resolution image, as
shown by the increase in AP
L
and AR
L
for USRNET
in Table 2. Overall the threshold approach allowed
our keypoint detector to perform at its optimum for
every evaluation metric, showing that our approach of
using Mask-RCNN with a threshold may be a suitable
solution for situations where people are both high and
low resolution in the same image.
4 CONCLUSION
In this paper we undertook a rigorous empirical study
to understand how SR affects the different stages of
a top-down HPE process. Prior studies, as well as
our initial object detection results, lead us to believe
that our final HPE results would also improve once
SR was applied; however, this was not the case. Fig-
ure 2 shows a clear downward trend, showing that as
the initial segmentation area of an object increases,
the keypoint detection results after SR decreases. Ad-
ditionally, as current state of the art keypoint detectors
share a similar feed forward architecture and use the
same loss function we see no reason why this obser-
vation would differ for a different model, simply the
threshold at which the performance decreased would
change. Remarkably, our object detector did not seem
to exhibit the same downward pattern; instead the
change in object detection rate became sporadic for
our larger segmentation area subgroups once SR was
applied. This shows that although both components of
a top-down HPE model are reliant on an images res-
olution to perform optimally, the keypoint detection
component relies more on this factor than the object
detector, whose performance may be more affected
by things such as an images context, the lighting of
the people in an image, whether people are occluded
and if they have a difficult to identify bounding box.
Our reasoning for why each components performance
degrades as the initial segmentation area increases, is
due to the training data that SR models use. Both SR
models were trained to reconstruct high resolution im-
agery from their low resolution counterparts (Agusts-
son and Timofte, 2017), meaning that they have not
Can Super Resolution Improve Human Pose Estimation in Low Resolution Scenarios?
499

Table 7: The performance of HRNET (Sun et al., 2019) on the
1
2
scale dataset and that same dataset upscaled by a factor of 4
using the various SR techniques. The best result for each evaluation metric is higlighted in bold.
Dataset AP AP
M
AP
L
AR AR
M
AR
L
COCO
1
2
Scale 0.704 0.758 0.835 0.747 0.799 0.879
Bicubic 0.709 0.756 0.832 0.753 0.796 0.876
ESRGAN 0.707 0.756 0.832 0.753 0.796 0.876
ESRNET 0.721 0.768 0.827 0.766 0.805 0.872
USRGAN 0.715 0.761 0.827 0.760 0.801 0.874
USRNET 0.722 0.766 0.828 0.766 0.803 0.876
Table 8: The performance of HRNET (Sun et al., 2019) on the
1
4
scale dataset and that same dataset upscaled by a factor of 4
using the various SR techniques. The best result for each evaluation metric is higlighted in bold.
Dataset AP AP
M
AP
L
AR AR
M
AR
L
COCO
1
4
Scale 0.519 0.785 0.785 0.567 0.833 0.888
Bicubic 0.579 0.791 0.799 0.627 0.836 0.879
ESRGAN 0.602 0.801 0.798 0.649 0.843 0.877
ESRNET 0.630 0.812 0.807 0.676 0.856 0.886
USRGAN 0.613 0.808 0.808 0.661 0.851 0.886
USRNET 0.629 0.811 0.817 0.675 0.852 0.893
Table 9: The keypoint detection results from HRNET (Sun et al., 2019) on the
1
2
scale, USRNET and mixed approach datasets.
Dataset AP AP
M
AP
L
AR AR
M
AR
L
COCO
1
2
Scale 0.704 0.758 0.835 0.747 0.799 0.879
USRNET 0.722 0.766 0.828 0.766 0.803 0.876
Mixed Approach (W/Threshold) 0.723 0.767 0.835 0.768 0.804 0.882
been trained to reconstruct even higher resolution im-
ages from medium resolution counterparts. As we in-
crease the segmentation area of the person we wish to
reconstruct, they become increasingly higher in reso-
lution. This causes our SR models to struggle as they
has not learnt how to deal with inputs of this size. Al-
though we presented a way to address this problem
via our Mask-RCNN approach, the bias introduced
by our threshold, as well as not addressing the spo-
radicity in object detection makes this a sub-optimal
solution. Furthermore, our solution only addresses
the issue in top-down HPE approaches as it utilises
an object detector therefore we would be unable to
apply our solution for bottom-up HPE. Future works
to find an optimum solution could include an end-to-
end HPE model which would learn where in an im-
age to apply SR to, as well as a SR approach which
could perform optimally on both low and high reso-
lution objects. Overall however, the improvement in
HPE when evaluating the effects of SR on low resolu-
tion people is noteworthy, and suggests that SR could
be used as a valuable tool for future HPE applications
in low resolution scenarios.
ACKNOWLEDGMENTS
This work was supported by the EPSRC Programme
Grant Immersive Audio-Visual 3D Scene Reproduc-
tion Using a Single 360 Camera (EP/V03538X/1)
REFERENCES
Agustsson, E. and Timofte, R. (2017). Ntire 2017 chal-
lenge on single image super-resolution: Dataset and
study. In 2017 IEEE Conference on Computer Vision
and Pattern Recognition Workshops (CVPRW), pages
1122–1131.
Andriluka, M., Pishchulin, L., Gehler, P., and Schiele, B.
(2014). 2d human pose estimation: New benchmark
and state of the art analysis. In IEEE Conference on
Computer Vision and Pattern Recognition (CVPR).
Bulat, A. and Tzimiropoulos, G. (2016). Human pose esti-
mation via convolutional part heatmap regression. In
Leibe, B., Matas, J., Sebe, N., and Welling, M., edi-
tors, Computer Vision – ECCV 2016, pages 717–732,
Cham. Springer International Publishing.
Cao, Z., Hidalgo, G., Simon, T., Wei, S.-E., and Sheikh,
Y. (2019). Openpose: Realtime multi-person 2d pose
estimation using part affinity fields.
Chen, Y., Tian, Y., and He, M. (2020). Monocular hu-
man pose estimation: A survey of deep learning-based
methods. Computer Vision and Image Understanding,
192:102897.
Chen, Y., Wang, Z., Peng, Y., Zhang, Z., Yu, G., and Sun, J.
(2018). Cascaded pyramid network for multi-person
pose estimation. pages 7103–7112.
Cheng, B., Xiao, B., Wang, J., Shi, H., Huang, T. S., and
Zhang, L. (2020). Higherhrnet: Scale-aware represen-
tation learning for bottom-up human pose estimation.
VISAPP 2022 - 17th International Conference on Computer Vision Theory and Applications
500

In Proceedings of the IEEE/CVF Conference on Com-
puter Vision and Pattern Recognition (CVPR).
Erfurt, J., Helmrich, C. R., Bosse, S., Schwarz, H., Marpe,
D., and Wiegand, T. (2019). A study of the per-
ceptually weighted peak signal-to-noise ratio (wpsnr)
for image compression. In 2019 IEEE International
Conference on Image Processing (ICIP), pages 2339–
2343.
He, K., Gkioxari, G., Doll
´
ar, P., and Girshick, R. (2017).
Mask r-cnn. In 2017 IEEE International Conference
on Computer Vision (ICCV), pages 2980–2988.
Hu, X., Naiel, M. A., Wong, A., Lamm, M., and Fieguth, P.
(2019). Runet: A robust unet architecture for image
super-resolution. In 2019 IEEE/CVF Conference on
Computer Vision and Pattern Recognition Workshops
(CVPRW), pages 505–507.
Huang, Y., Shao, L., and Frangi, A. F. (2017). Simultane-
ous super-resolution and cross-modality synthesis of
3d medical images using weakly-supervised joint con-
volutional sparse coding. In 2017 IEEE Conference
on Computer Vision and Pattern Recognition (CVPR),
pages 5787–5796.
Isaac, J. S. and Kulkarni, R. (2015). Super resolution tech-
niques for medical image processing. In 2015 Inter-
national Conference on Technologies for Sustainable
Development (ICTSD), pages 1–6.
Jin, S., Xu, L., Xu, J., Wang, C., Liu, W., Qian, C., Ouyang,
W., and Luo, P. (2020). Whole-body human pose
estimation in the wild. In Vedaldi, A., Bischof, H.,
Brox, T., and Frahm, J.-M., editors, Computer Vision
– ECCV 2020, pages 196–214, Cham. Springer Inter-
national Publishing.
Khan, N. U. and Wan, W. (2018). A review of human pose
estimation from single image. In 2018 International
Conference on Audio, Language and Image Process-
ing (ICALIP), pages 230–236.
Ledig, C., Theis, L., Huszar, F., Caballero, J., Cunning-
ham, A., Acosta, A., Aitken, A., Tejani, A., Totz, J.,
Wang, Z., and Shi, W. (2017). Photo-realistic single
image super-resolution using a generative adversarial
network. pages 105–114.
Lin, T., Doll
´
ar, P., Girshick, R., He, K., Hariharan, B., and
Belongie, S. (2017). Feature pyramid networks for
object detection. In 2017 IEEE Conference on Com-
puter Vision and Pattern Recognition (CVPR), pages
936–944.
Lin, T.-Y., Maire, M., Belongie, S., Hays, J., Perona, P., Ra-
manan, D., Doll
´
ar, P., and Zitnick, C. L. (2014). Mi-
crosoft coco: Common objects in context. In Fleet,
D., Pajdla, T., Schiele, B., and Tuytelaars, T., edi-
tors, Computer Vision – ECCV 2014, pages 740–755,
Cham. Springer International Publishing.
Luvizon, D., Tabia, H., and Picard, D. (2020). Multi-task
deep learning for real-time 3d human pose estimation
and action recognition. IEEE transactions on pattern
analysis and machine intelligence.
Na, B. and Fox, G. (2020). Object classifications by image
super-resolution preprocessing for convolutional neu-
ral networks. Advances in Science, Technology and
Engineering Systems Journal, 5:476–483.
Ngiam, J., Chen, Z., Chia, D., Koh, P., Le, Q., and Ng, A.
(2010). Tiled convolutional neural networks. In Laf-
ferty, J., Williams, C., Shawe-Taylor, J., Zemel, R.,
and Culotta, A., editors, Advances in Neural Infor-
mation Processing Systems, volume 23. Curran Asso-
ciates, Inc.
Noord, N. and Postma, E. (2016). Learning scale-variant
and scale-invariant features for deep image classifica-
tion. Pattern Recognition, 61.
Rasti, P., Uiboupin, T., Escalera, S., and Anbarjafari, G.
(2016). Convolutional neural network super resolu-
tion for face recognition in surveillance monitoring.
In Perales, F. J. and Kittler, J., editors, Articulated Mo-
tion and Deformable Objects, pages 175–184, Cham.
Springer International Publishing.
Shermeyer, J. and Etten, A. (2019). The effects of super-
resolution on object detection performance in satellite
imagery. pages 1432–1441.
Sun, K., Xiao, B., Liu, D., and Wang, J. (2019). Deep high-
resolution representation learning for human pose es-
timation. 2019 IEEE/CVF Conference on Computer
Vision and Pattern Recognition (CVPR), pages 5686–
5696.
Takahashi, R., Matsubara, T., and Uehara, K. (2017). Scale-
invariant recognition by weight-shared cnns in paral-
lel. In Zhang, M.-L. and Noh, Y.-K., editors, Proceed-
ings of the Ninth Asian Conference on Machine Learn-
ing, volume 77 of Proceedings of Machine Learning
Research, pages 295–310. PMLR.
Tompson, J. J., Jain, A., LeCun, Y., and Bregler, C. (2014).
Joint training of a convolutional network and a graphi-
cal model for human pose estimation. In Ghahramani,
Z., Welling, M., Cortes, C., Lawrence, N., and Wein-
berger, K. Q., editors, Advances in Neural Information
Processing Systems, volume 27. Curran Associates,
Inc.
Wang, B., Lu, T., and Zhang, Y. (2020). Feature-driven
super-resolution for object detection. In 2020 5th In-
ternational Conference on Control, Robotics and Cy-
bernetics (CRC), pages 211–215.
Wang, X., Yu, K., Wu, S., Gu, J., Liu, Y., Dong, C., Qiao,
Y., and Loy, C. C. (2019). Esrgan: Enhanced super-
resolution generative adversarial networks. In Leal-
Taix
´
e, L. and Roth, S., editors, Computer Vision –
ECCV 2018 Workshops, pages 63–79, Cham. Springer
International Publishing.
Wang, Z., Bovik, A., Sheikh, H., and Simoncelli, E. (2004).
Image quality assessment: from error visibility to
structural similarity. IEEE Transactions on Image
Processing, 13(4):600–612.
Wang, Z., Bovik, A. C., and Lu, L. (2002). Why is image
quality assessment so difficult? In 2002 IEEE Inter-
national Conference on Acoustics, Speech, and Signal
Processing, volume 4, pages IV–3313–IV–3316.
Zhang, K., Gool, L., and Timofte, R. (2020). Deep un-
folding network for image super-resolution. 2020
IEEE/CVF Conference on Computer Vision and Pat-
tern Recognition (CVPR), pages 3214–3223.
Zhang, L., Zhang, H., Shen, H., and Li, P. (2010). A
super-resolution reconstruction algorithm for surveil-
lance images. Signal Processing, 90(3):848–859.
Zhang, L., Zhang, L., Mou, X., and Zhang, D. (2011).
Fsim: A feature similarity index for image quality as-
sessment. Image Processing, IEEE Transactions on,
20:2378 – 2386.
Can Super Resolution Improve Human Pose Estimation in Low Resolution Scenarios?
501
