
An Extensible Framework for Data Reliability Assessment
Óscar Oliveira
a
and Bruno Oliveira
b
CIICESI, School of Management and Technology, Porto Polytechnic, Rua do Curral, Felgueiras, Portugal
Keywords: Data Quality, Data Reliability, Data Warehouse, Data Lake, Quality Indicator.
Abstract: Data Warehouse (DW) and Data Lake (DL) systems are mature and widely used technologies to integrate
data for supporting decision-making. They support organizations to explore their operational data that can be
used to take competitive advantages. However, the amount of data generated by humans in the last 20 years
increased exponentially. As a result, the traditional data quality problems that can compromise the use of
analytical systems, assume a higher relevance due to the massive amounts and heterogeneous formats of the
data. In this paper, an approach for dealing with data quality is described. Using a case study, quality metrics
are identified to define a reliability indicator, allowing the identification of poor-quality records and their
impact on the data used to support enterprise analytics.
1 INTRODUCTION
Data is the main ingredient to generate information.
Reliable data is a critical asset for reducing the risks
of negative business outcomes relating to the
decision-making process. For that reason, measuring
overall Data Quality (DQ) is fundamental to ensure
reliable decisions.
DQ is a complex topic involving several facets
that should be carefully studied and framed when data
is analysed. DQ involves several different analyses
related to the nature of problems that can occur.
Missing values, referential integrity violations or
contradictory data can ruin a project that highly
depends on the data to support decision making.
In the so-called Big Data era, these problems are
even more critical than before, since more
unstructured data from heterogeneous data sources
are consumed from analytical systems to support
decision-making activities. Controlling these
problems can be difficult and can lead to serious
drawbacks that can compromise all analytic
procedures over the generated data.
The definition of policies can be used to reduce
these problems, contributing to the establishment and
deployment of roles, responsibilities, policies, and
procedures concerning the acquisition, maintenance,
dissemination, and disposition of data (Batini &
a
https://orcid.org/0000-0003-3807-7292
b
https://orcid.org/0000-0001-9138-9143
Scannapieco, 2016). However, dealing with the
problems generated by bad data is not a
straightforward task and usually involves very
specific knowledge and tools that should be combined
to achieve a specific result. This result is sometimes
ambiguous. Analysing individual metrics (such as the
number of null values or duplicate rows) can provide
relevant information but does not provide the
necessary meanings considering the different data
quality dimensions. It is not always clear what is the
impact of each metric on the overall data quality and
what are the necessary dimensions to produce a
global score. Measuring the incoming data using
multidimensional metrics and establishing proper
mechanisms to deal with bad data can improve the
overall data quality and reduce the negative impact of
bad data that can pass unnoticed in big datasets.
In this paper, a framework for managing DQ is
presented. This framework aims to provide a flexible
and extensible approach for consuming, analyzing
and handling data before their use to generate
business insights. Section 2 describes some relevant
research works in the DQ field. Section 3 presents an
overview of the proposed framework. Section 4
presents a case study to demonstrate some aspects of
the proposed framework. Finally, in Section 5,
conclusions and future work directions are presented.
Oliveira, Ó. and Oliveira, B.
An Extensible Framework for Data Reliability Assessment.
DOI: 10.5220/0010863600003179
In Proceedings of the 24th International Conference on Enterprise Information Systems (ICEIS 2022) - Volume 1, pages 77-84
ISBN: 978-989-758-569-2; ISSN: 2184-4992
Copyright
c
2022 by SCITEPRESS – Science and Technology Publications, Lda. All rights reserved
77

2 RELATED WORK
Data engineers deal frequently with a lot of data
quality problems when developing analytical
systems. The use of several sources, structural and
semantically heterogeneous, lacking in
documentation and consistency, results in several
data quality problems that compromise analytical
systems trust.
Data quality can be related to very different
problems that produce noisy data that can lead to
wrong or inadequate analysis. These problems are
related to missing values, data duplication,
misspellings, contradictory values, or inconsistent
values. Rahm (Rahm & Do, 2000) classified data
quality problems in single-source and multi-source
problems. For both scenarios, schema and instance
level data quality problems can occur. Rahm also
discusses cleaning approaches to deal with such
problems, presenting the several phases needed to
data cleaning processes: data analysis involving the
identification of metadata, use of transformation, and
mapping rules applied by an ETL process that assures
a common data schema to represent multi-source
data, ETL correctness and effectiveness verification,
execution of the transformation steps, and the
backflow of cleaned data that results in data
correction directly in the data sources to reduce
further cleaning processes. Rahm also addresses
conflict resolution, describing preparation steps that
involve data extraction from free-form attributes, data
validation, and correction, that can be applied using
existing attributes or data dictionaries to correct or
even standardize data values. Another common
problem referred is related to the identification of
matching instances without common attributes,
which involves the calculation of the similarity to
evaluate the matching confidence between data. Most
of these problems can be identified using specific
strategies, typically embodied in data profiling tools,
proving several metrics used to measure data
adequacy. However, despite being useful, the metrics
are not easy to understand and use. Data perfection is
almost impossible in real scenarios, and it is difficult
to integrate metrics from each data quality dimension
and conclude about its global state.
DQ is also frequently classified and measured
using dimensions, each one representing a class of
errors that can occur. There are several approaches
based on theoretical (Wand & Wang, 1996),
empirical (Wang & Strong, 1996), or intuitive
approaches (Redman & Godfrey, 1997). Comparing
and defining the definitive approach is not an easy
task since most of the proposals in the area are based
on different assumptions related to the granularity
level considered and the approached data model
(most research works only focus on the relational
model).
Batini (Batini & Scannapieco, 2016) provided a
classification framework based on a set of quality
dimensions: Accuracy, Completeness, Redundancy,
Readability, Accessibility, Consistency, Usefulness,
and Trust. For each dimension, several metrics are
presented in form of measure values. Several other
authors addressed similar dimensions classification
(Loshin, 2010)(Kumar & Thareja, 2013), providing
slight variations to the dimension definition and using
specific taxonomies and ontologies to relationship
them and their potential metrics (Geisler, Quix,
Weber, & Jarke, 2016). For example, in (Loshin,
2010), the author classified the dimensions between
intrinsic (related to the data model, such as the
structure and accuracy) and contextual (related to the
bounded context, such as completeness and
consistency).
Batini (Batini & Scannapieco, 2016) divides the
DQ into several dimensions. The Accuracy
dimension defines how accurately a specific value
represents reality. The (structural) accuracy can be
classified as syntactic and semantic. The syntactic
accuracy measures the distance from a specific value
to its correct representation (e.g., when mismatch
input is stored) and is measured by comparison
functions to evaluate the distance between two
values. For semantic accuracy, the correct value
should be known or deduced, and it is measured based
on a “correct” or “not correct” domain. For sets of
values, the duplication problem is also addressed,
resulting in data duplication, mainly when less
structured sources are used. Accuracy can be
discussed in several scopes: single value, attribute,
relation (or entity) and database. When a set of values
is considered, a ratio between correct values and total
values can be used. The relative importance of value
accuracy is also considered since the errors found can
have different importance in the context of a tuple or
a table. For example, an accuracy error in attributes
used for matching/identification data has greater
importance than descriptive attributes that not
compromise the data integration.
The completeness dimension also represents
several problems that typically occur in real-work
scenarios. Non-null values assigned to data elements
are analyzed considering the context in which they
are applied (Loshin, 2009). The null values can be
applied to data elements that should have a valid
value (and for that reason is considered an invalid
case), can be applied to optional values (in case the
ICEIS 2022 - 24th International Conference on Enterprise Information Systems
78
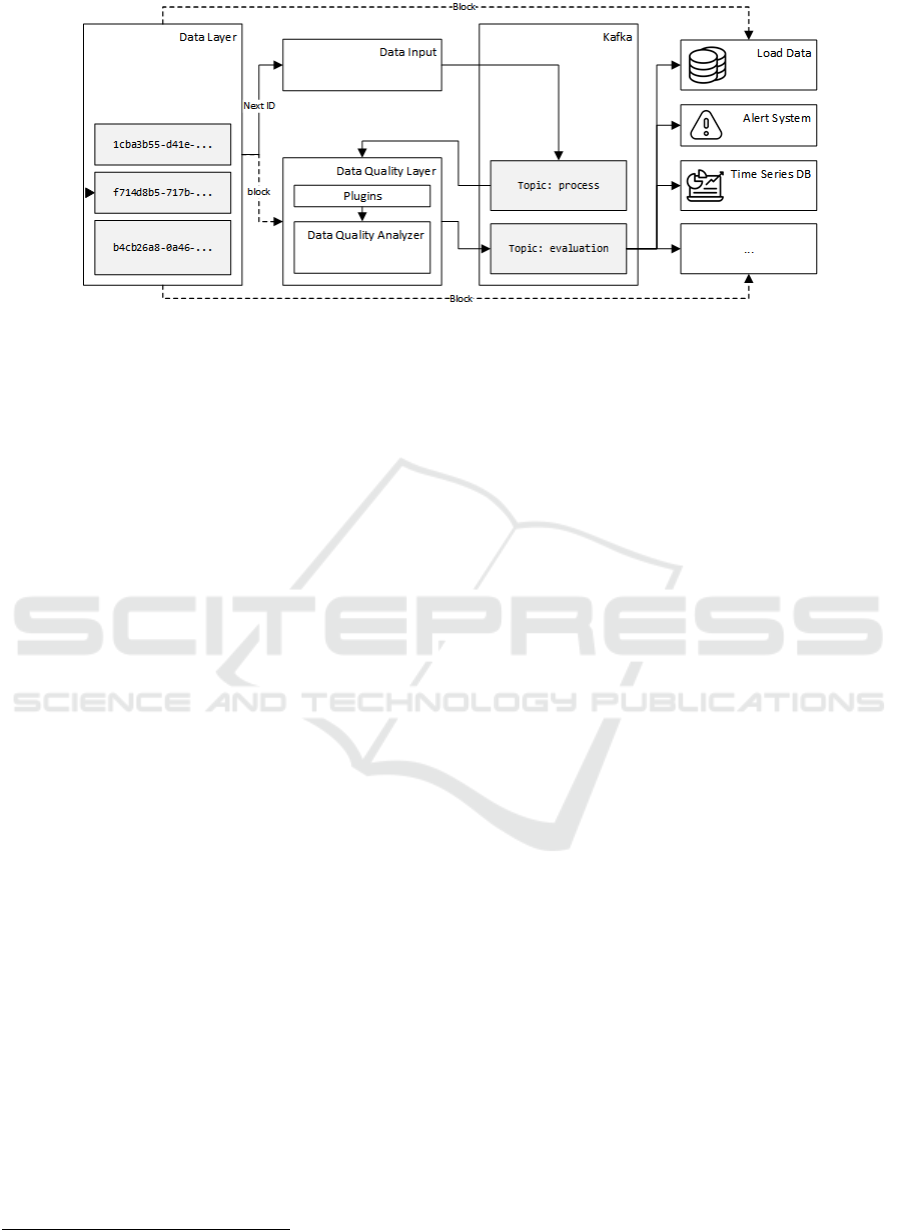
Figure 1: Architecture of the proposed framework.
value doesn’t exist), and can be applied due to the
existence of business rules that imply specific
conditions (Loshin, 2009). It can also be described or
defined as the level of data missing or unusable
(Cervo, 2015). Batini (Batini & Scannapieco, 2016)
characterizes completeness considering the existence
and meaning of null values, and its validity
considering the Open World (OW) and closed world
assumptions (CW). Thus, the existence of null values
can have different origins:
• The value exists but it is missing, which implies
incompleteness
• The value does not exist, and no incompleteness
is found
• The value can exist, but it is now known if exists
or not and it is not sure if it is an incompleteness
case
The CW assumption complements completeness by
considering that only the values that exist in the data
entity (for example, a table) represents facts for
checking for completeness. In the OW assumption, it
is assumed that facts can be true or false, even if they
are not present in the dataset. Thus, completeness can
be defined considering the existence of null values
and the OW and CW assumptions. The OW
assumption considers the existence of reference data
to characterize completeness even when null values
are not found. When null values are found and CW
assumption is followed, completeness can be
characterized in different scopes: value (checking
null values for some fields), tuple (checking null
values for a tuple field), attribute (measuring null
values for a specific field of a data entity) and relation
(analyzing null values for a data entity). Another
important aspect identified by Batini (Batini &
Scannapieco, 2016) is the notion of completeness
1
http://kafka.apache.org/
considering the evolution in time. These scenarios are
very common and happen when data is considered
complete during a certain period.
Despite the several and complete contributions,
sometimes companies just want to know, in simpler
terms, how good is the data, i.e., a simple metric that
can provide useful insight about the current data
quality status and how this quality is evolving across
time. Even simple, such metrics can be very useful to
identify potential problems and promote new
practices to improve overall data quality.
3 PROPOSED FRAMEWORK
Providing a classification for DQ defines possible
solutions to handle specific problems that share some
characteristics and solution in common. Additionally,
it defines a possible way to measure the quality within
a data dimension. Thus, a clearer notion of how
incoming data is aligned to the pre-defined
requirements at a specific moment can be delivered to
data engineers, contributing with important insights
to identify and correct issues that can compromise
decision-making processes.
The architecture for analysing the data reliability
of heterogeneous data sources is based on the scalable
publish/subscribe messaging system Kafka
1
. Kafka is
a reliable and high-throughput system for handling
real-time data streams and building data pipelines. In
this system, the producers produce messages to topics
and the consumers consume those messages. A topic
is a collection of messages stored persistently
(following a retention policy). The architecture
proposed is depicted in Figure 1 and is next described.
An Extensible Framework for Data Reliability Assessment
79

The Data Layer represents the data retention
system responsible for managing the (non-fixed size)
data blocks data to be processed that are coming from
diverse and heterogeneous data sources. This service
has two main responsibilities, namely, to make
available the next block (internal) identifier (id) and
to deliver a block (with a given id). The Data Input is
a simple service that communicates with the Data
Layer and sends a message (to the process topic) to
the Kafka broker, whenever a new block needs to be
processed.
The Data Quality Layer (DQL) consumes the
messages sent to the Kafka process topic and obtains
the Data Quality Index (DQI) from the Data Quality
Analyser (DQA). The DQL send a message to the
Kafka broker with the timestamps, the data block id,
the DQI and a (boolean) outlier (i.e., anomaly) value
evaluation. Although a manual threshold could be
applied to detect anomalies in the DQI value, the
DQL uses, a 𝑡 -Digest data structure for building
sketches of data that can be used to approximate
rank-based statistics with high accuracy (Dunning,
2021). This data structure allows building anomaly
detectors (Dunning & Friedman, 2014a) to look for
deviations of what can be considered “normal” for a
given input. The 𝑡-Digest is a simple yet widely used
data-structure and is available as an open-source
project
2
.
The DQA uses rules defined in a JSON file for the
data to be analysed. The rules can be grouped in a
given (non-fixed) dimension as depicted in Figure 2.
In the figure, two dimensions are considered, namely,
consistency and accuracy with a weight in the DQI of
50% and 50%, respectively. All the rules of this group
are to be placed in the array with key rules.
{
"dimensions": {
"consistency": {
"weight": 0.5,
"rules": [ ... ]
},
"accuracy": {
"weight": 0.5,
"rules": [ ... ]
}
}
Figure 2: Dimensions.
Each rule is defined with a unique identifier (_id),
a weight (within the dimension), the plugin to use, the
plugin parameters, and a description.
2
https://github.com/tdunning/t-digest
In Figure 3, a rule for the column id is specified.
This rule will use a Match plugin that receives as
parameters, the column and the regular expression
(RegEx) that must be used (in this case the values of
the column should be integer values). The hits of this
rule will weigh 20% in the result of the container
group (i.e., dimension). The usage of RegEx provides
a wide range of usage possibilities and flexibility to
the Match plugin.
{
"_id": "Match1",
"weight": 0.2,
"plugin": "Match",
"parameters": {
"column": "id",
"values": "[0-9]+"
},
"description": "..."
}
Figure 3: Match rule.
Three more plugins were implemented, namely,
Equal, Similarity and BloomFilter. These plugins
provide a means to verify is a value is inside a given
set of values. The Equal plugin is used to verify if a
given value exists in the set. The Similarity plugin
returns the maximum similarity degree of a value
considering the values on the set through
Approximate String Matching
3
. The BloomFilter
plugin uses a space-efficient probabilistic
BloomFilter data structure to test whether an element
is a member of a set. This latter plugin allows for a
faster, although probabilistically, check of the
existence of a value in the set. These three plugins use
the same parameters, namely a column and a set of
values. in Figure 4 it is depicted a rule that specifies
the column location must use a probabilistic approach
to check if the values are in the sets values specified.
For each data block, each group of rules is
evaluated and weighted accordingly resulting in the
averaged and weighted ratio between the number of
hits over the number of rows of each rule.
Historical data (of hits and numbers of rows
considered by each rule) is stored to provide a means
to calculate the difference between the value obtained
by the current block and by the historical data. The
value obtained ranges between -1 and 1, with the
following meaning: 1) a negative value implies that
the current block has poorer quality than the historical
data, 2) a value of 0 implies that the values obtained
by the current block are in line with the historical
3
Using the Fuzzywuzzy Python package
(https://pypi.org/project/fuzzywuzzy/).
ICEIS 2022 - 24th International Conference on Enterprise Information Systems
80
data, and 3) a positive value implies that the block has
a higher quality than the historical data.
{
"_id": "BloomFilter1",
"weight": 1,
"plugin": "BloomFilter",
"parameters": {
"column": "zone",
"values": [ "ASEAN", "BENELUX", ...]
},
"description": "..."
}
Figure 4: In rule.
The messages sent by the DQL can be consumed by
services with distinct purposes. In Figure 1, three of
those services are depicted, namely, Load Data, Alert
System, and Time Serie DB. The Load Data consumes
the evaluation topic messages, and load the data to the
target database. This service can, if necessary, prevent
the load of anomalous data detected by the DQA
staging the block data in a quarantine staging area. The
Alert System provides a means to alert the occurrence
of anomalous quality values of the data to be
processed, while the Time Series DB (Dunning &
Friedman, 2014b) stores and processes the data of the
evaluation messages. These three services are only
examples and serve only for the architecture
description. Each system or domain can require
specific services but the core processing will remain:
1) consume the evaluation messages, 2) in some cases
request the data block from the Data Layer, and 3)
perform some specific task with the available data.
4 CASE STUDY
Customer data represents a key driver for guiding
business strategies in almost any domain. It refers not
only to customers’ details but also includes
behavioural and demographic data. Apart from being
costly, data with low quality causes inefficiency and
loss of competitiveness in the companies’ strategic
decisions. Due to the proliferation of data sources
involved in modern data analytics, it’s difficult to
control the quality of data incoming to the analytics
stack.
For demonstrating the approach presented in this
paper, a customer dataset extracted from a BI system
used by a windshield repair and replacement
company was selected. Customer data is collected
from several data sources, involving structured data
from relational databases and semi-structured data
from XML, CSV or JSON documents. Each data
source represents data in different ways even when
they export data in the same format. Each data source
sends periodically the data blocks.
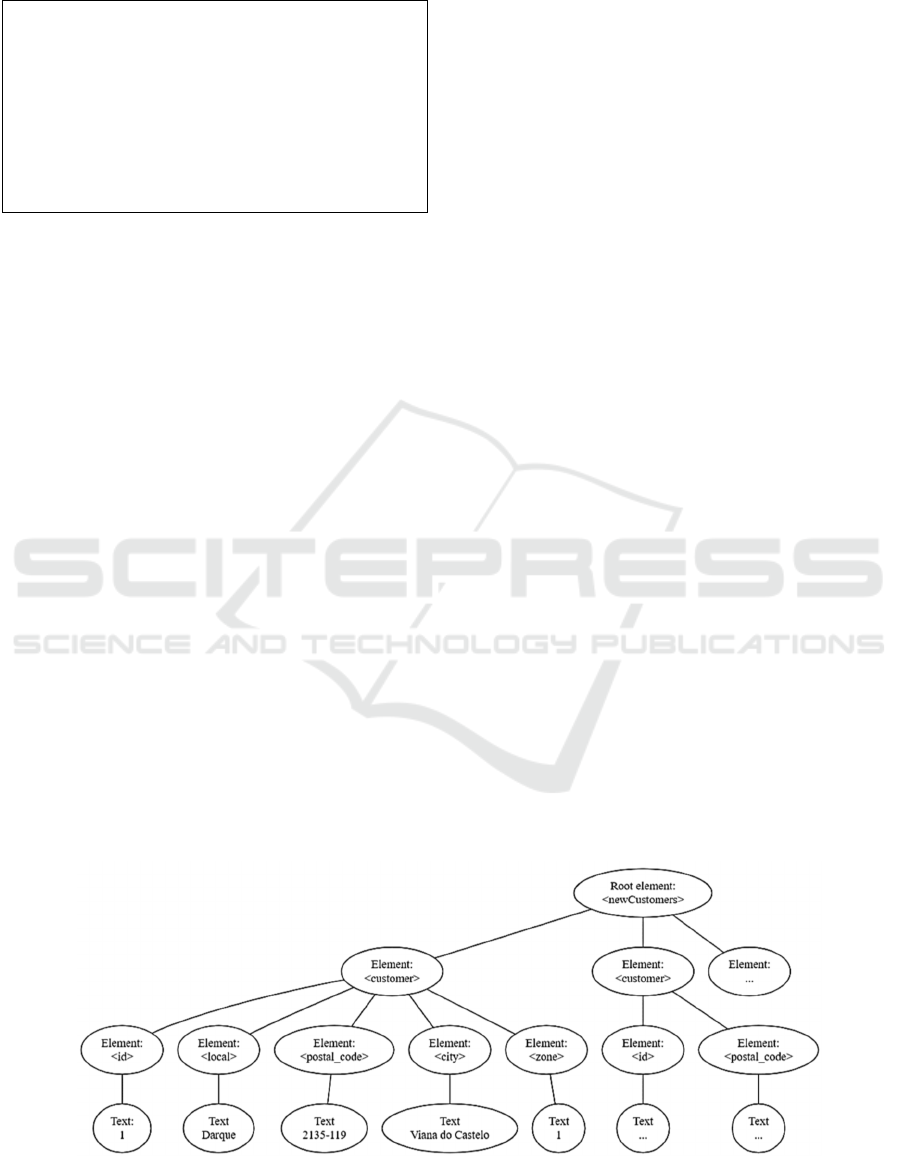
4.1 Data Description
Figure 5 presents an excerpt of an XML representing
customer data from an input block generated by a
specific data source.
The elements are next briefly described:
• The root element “newCustomers” describes the
new customers (Customer element) inserted in a
target operational data source. Due to the semi-
structured nature, each customer element can
have a different composition, i.e., their schema
is described by the data itself.
• The “id” and “postal_code” elements are
mandatory, while the “local”, “city” and “zone”
not always are represented (possibly due to
input errors or data sources limitations).
• In this subset of customer data, the “id”
identifies each customer individually in each
input block and the remaining elements
represent the customer’s address.
Figure 5: XML data excerpt for an input block.
An Extensible Framework for Data Reliability Assessment
81

• The “local” represents a description of a given
place or address reference, “postal_code”
represents the postal code for a given country,
“city” represents the city name, and “zone”
describes one or a group of countries (for
example, “Iberian Peninsula” or “OCDE”
countries).
Even simple, this subset of customer data can
reveal several problems that can compromise
decision-making processes. To archive the notion of
good data, the following expected rules were
identified:
1. “id” should be an integer value.
2. “local” elements should exist and data inside
should not be empty or have “.” (which
signalizes the inexistence of value). Some staff
members overcome the obligation to insert data
placing a dot when the data is unknown.
3. the “postal_code” can have different formats
considering the country in which refers. For the
Portugal postal code representation, the value
should be composed of four digits, a hyphen,
and three digits. Sometimes, the last three digits
are missing.
4. The “city” values can have several variations in
their values for representing the same object.
For example: “VIANA DO CASTELO”, “Viana
do Castelo”, “Viana” and “Viana Castelo” refers
to the same city.
5. The “zone” value should be matched to a set of
predefined values already known for the given
domain.
4.2 Rules
After identifying the main problems related to the
used dataset (which can be supported using data
profiling techniques (Abedjan, Golab, Naumann, &
Papenbrock, 2018)), it is important to categorize them
following the DQ dimensions (Batini & Scannapieco,
2016). Based on a specific classification, problems
can be related together to provide a consistent
indicator based on a set of related and similar
problems, which may be useful to identify common
strategies to solve or minimize them. The following
mappings were identified:
• Rules identified by 1 and 4 are related to the
Accuracy dimension. Rule 1 is connected to the
notion of model correctness while rule 5 is
connected to the notion of syntactic accuracy,
i.e., the value is syntactically correct.
• Rule 2 is framed to the Completeness
dimension, both for the existence of the “local”
element (schema completeness) and the missing
values associated with it.
• Rules 3 and 5 capture the need to enforce
semantic rules over the data for the Consistency
dimension. Rule 3 represents a specific domain
integrity constraint over the data instances (also
known as interrelation constraint) and rule 5 is
an integrity constraint based on a set of pre-
defined values that are stored in another dataset
(interrelation constraint).
Based on the DQ dimensions categorization, rules can
be configured and used by the proposed framework to
group rules together and define data problems
prevalence. Then, a reliability score can be identified
for each data input block, which can help in the
identification of outliers and identify specific
problems that can compromise data quality.
4.3 Reliability Score
With the rules defined, the JSON configuration file
for the data pipeline using our framework was
defined. Three dimensions were considered, namely,
completeness, consistency, and accuracy with
weights of 0.33, 0.33, and 0.34 respectively.
The dimension rules were be defined as follows
(less relevant elements are not described to facilitate
the presentation):
• The completeness dimension has one rule that
uses the Match plugin for the “local” column.
The value for analysis to be used by this plugin
is the RegEx expression
"^(?!($|NULL$|[.]{1}$))".
• The consistency dimension has two rules, each
one with a weight of 0.5. The first rule uses a
Match plugin for the “postal_code” column with
a value of "^([0-9]{4}-[0-9]{3}|[0-9]{4}|[0-
9]{5}|[A-Z]-[0-9]{5})$". The second rule uses
a BloomFilter plugin for the zone columns with
29 possible values (e.g., "ASEAN", "NAFTA",
"OECD", "OPEC").
• The accuracy dimension has two rules, each one
with a weight of 0.5. The first rule uses a Match
plugin for the “id” column with a value of "[0-
9]+". The second rule uses a Similarity plugin
for the “city” column with a set of 159 values
(cities that are most probably to appear due to
the business coverage).
When a block of data is been considered for
evaluation, each rule is executed evaluating each row
of the column under analysis. For most cases, the
value of the rule will represent the ratio of how many
rows respect the current rule and the total number of
rules. The Similarity plugin, return a continuous value
ICEIS 2022 - 24th International Conference on Enterprise Information Systems
82
that represents the maximum similarity encountered
considering the set of possible values. Considering
Figure 6 illustrates a part of a block of data received.
The rule over the “local” column would be 0.33 as
only one value respect the rule (hit), while, for
example, the id column (the first one) would return 1
as all values are integers.
1080,SINES,7520-215,SINES,ASEAN
1081,.,2900-737,SETUBAL,ASEAN
1082,.,2910-737,SETUBAL,ASEAN
Figure 6: Exert of a data block.
To calculate the reliability score for the rule that
considers the ”local” column, the historical ratio (all
hits over all the number of rows already evaluated by
the data pipeline) is considered. If, for example, the
historical value is 0.5, then the score of this rule
would be 0.33 – 0.5. The score –0.17 would be
returned.
The individual scores, as well as the number of
hits and number of rows considered for each rule, are
logged to provide for follow-up analysis.
The reliability score is calculated as the sum of
all weighted dimensions results, which in turn
correspond the sum of all to the sum weighted score
of the rules.
The DQL evaluation message of a data block that
is produced is illustrated in Figure 7. The key block-
id represents the unique identifier of the data block.
The dqi key represents the reliability score, i.e., Data
Quality Index, the time key represents the execution
time of the evaluation (for logging purposes), the
outlier key indicates if the data block is marked as an
anomaly (by the t-Digest), and date represents the
date and time in which the message was produced and
sent to the broker.
{'block-id': '17f04a2c-7847-46e6-96f3-
509a19aafbba', 'dqi': 0.09001, 'time': 0.085,
'outlier': False, 'date': '2021-10-24
11:25:34.459025'}
Figure 7: DQL evaluation message.
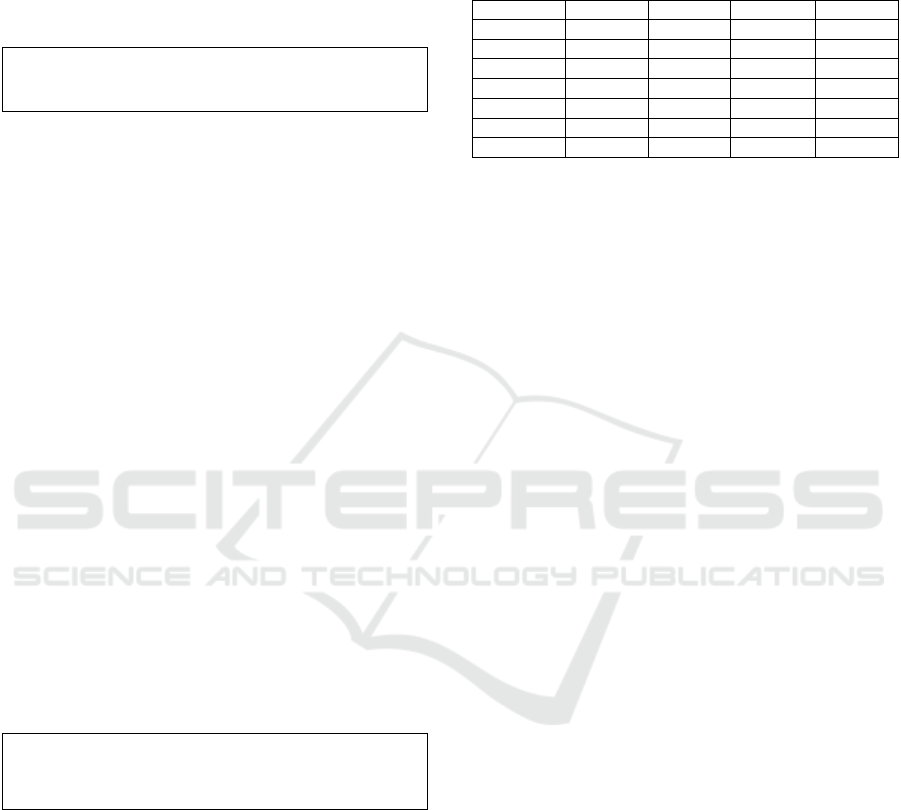
The following values (see Table 1) on a sequence of
data blocks evaluations (presented in tabular format
to simplify the presentation and discussion. For the
same reason some values were trimmed or removed).
Considering the presented results, it can be seen
that most of the blocks present a value very close to
0, indicating that the reliability is high. The block
with identifier 2fb39a55 presents a poor or anomalous
result reported by the t-Digest and is marked as an
outlier, meaning that for the case presented in Figure
1 this data block would be put in quarantine to be
posteriorly evaluated, and the rest of the blocks would
be loaded. The evaluation made by the t-Digest
depends on its configuration.
Table 1: Data blocks evaluation results.
b
loc
k
-i
d
dqi time outlie
r
date
b93231 -0.051 0.09 False ...
da8c80c9 0.059 0.12 False ...
0b5f21b1 0.061 0.09 False ...
2fb39a55 -0.130 0.06 True ...
3e3cbe81 -0.001 0.09 False ...
41335b6e 0.018 0.13 False ...
51d5047b 0.096 0.03 False ...
5 CONCLUSIONS
The emerging of more and heterogeneous data
coming from several data sources leads to more
demanding scenarios that imply the use of new
approaches for dealing with data. As data and its
related formats are growing in volume and
complexity, it is more difficult to ensure data quality
standards. Sometimes, less accurate data can be used
due to the difficulty to handle data quality problems
that may occur, mainly when the analytical system is
based on a real-time basis. Traditional data profiling
tools can be used to know and identify data problems.
However, not only the complexity of the data imposes
additional time to analyze input data, but also
interpreting the multi-dimensional metrics obtained is
hard and time-consuming.
To create more resilient systems and as we
understand that perfect data is not always possible, a
data pipeline was devised in the order to secure some
data “normality”. This framework can derive system
behaviours (e.g., load, quarantine) based on a simple
reliability score. This framework relies on services
dependent on message and a communication broker.
The reliability score can also be enhanced as it relies
on a plugin architecture and simple configuration,
allowing the creation of specialized systems.
This is the first step of this research project. Most
of the future work will be undertaken developing new
DQL plugins and service that uses the data and DQL
evaluation information. We expect to extend its
capacities in the future to create a more scalable,
flexible and efficient framework for data pipelines in
which the data is unstructured (and possibly with
heterogeneous formats) some reliability must be
ensured on downstream services. We expect to first
devise multicolumn rules as some columns only have
true/valid meaning if others have some specific value
(or format). Another path for this research that we
An Extensible Framework for Data Reliability Assessment
83

intend to follow is the dynamic automatization of the
data rules generation that can be obtained through
data mining techniques.
ACKNOWLEDGEMENTS
This work has been supported by national funds
through FCT - Fundação para a Ciência e Tecnologia
through project UIDB/04728/2020.
REFERENCES
Abedjan, Z., Golab, L., Naumann, F., & Papenbrock, T.
(2018). Data Profiling. Synthesis Lectures on Data
Management, 10(4), 1–154. https://doi.org/10.2200/
S00878ED1V01Y201810DTM052
Batini, C., & Scannapieco, M. (2016). Data and
Information Quality. Springer International Publishing.
Cervo, M. A. and D. (2015). Multi-Domain Master Data
Management. Elsevier. https://doi.org/10.1016/C2013-
0-18938-6
Dunning, T. (2021). The t-digest: Efficient estimates of
distributions. Software Impacts, 7(September 2020),
100049. https://doi.org/10.1016/j.simpa.2020.100049
Dunning, T., & Friedman, E. (2014a). Practical Machine
Learning: A New Look At Anomaly Detection. In
Machine Learning.
Dunning, T., & Friedman, E. (2014b). Time Series
Databases: New Ways to Store and Access Data.
Geisler, S., Quix, C., Weber, S., & Jarke, M. (2016).
Ontology-Based Data Quality Management for Data
Streams. J. Data and Information Quality, 7(4).
https://doi.org/10.1145/2968332
Kumar, V., & Thareja, R. (2013). A Simplified Approach
for Quality Management in Data Warehouse.
International Journal of Data Mining & Knowledge
Management Process, 3(5), 61–69.
https://doi.org/10.5121/ijdkp.2013.3506
Loshin, D. (2009). Master Data Management. Elsevier.
https://doi.org/10.1016/B978-0-12-374225-4.X0001-X
Loshin, D. (2010). The Practitioner’s Guide to Data
Quality Improvement (1st editio). Morgan Kaufmann.
Rahm, E., & Do, H. (2000). Data cleaning: Problems and
current approaches. IEEE Data Eng. Bull., 23(4), 3–13.
https://doi.org/10.1145/1317331.1317341
Redman, T. C., & Godfrey, A. B. (1997). Data Quality for
the Information Age (1st ed.). USA: Artech House, Inc.
Wand, Y., & Wang, R. Y. (1996). Anchoring data quality
dimensions in ontological foundations.
Communications of the ACM, 39(11), 86–95.
https://doi.org/10.1145/240455.240479
Wang, R. Y., & Strong, D. (1996). Beyond Accuracy: What
Data Quality Means to Data Consumers. J. Manag. Inf.
Syst., 12, 5–33.
ICEIS 2022 - 24th International Conference on Enterprise Information Systems
84
