
Hypoxic-Ischaemic Encephalopathy Prognosis using Susceptibility
Weighted Image Analysis based on Histogram Orientation Gradient
Zhen Tang
1a
, Sasan Mahmoodi
1
, Angela Darekar
2
and Brigitte Vollmer
3
1
School of Electronics and Computer Science, University of Southampton, Southampton SO17 1BJ, U.K.
2
Department of Medical Physics, University Hospital Southampton NHS Foundation Trust, Southampton So16 6YD, U.K.
3
Clinical Neurosciences and Clinical and Experimental Sciences, Faculty of Medicine,
University of Southampton, SO17 1BJ, U.K.
Keywords: Hypoxic-Ischaemic Encephalopathy, Susceptibility-weighted Imaging, HOG, Motor, Cognitive Outcomes.
Abstract: The aim of this study is to analyse the susceptibility-weighted magnetic resonance images (SWI) by using
Histogram of Oriented Gradients (HOG) as a global feature to identify areas of the neonatal brain affected by
Hypoxic-ischaemic encephalopathy (HIE). 42 infants with neonatal HIE have undergone under SW imaging
in the neonatal period and have been investigated through neurodevelopmental assessment at 24 months of
age. HOG features are used to represent the whole brain SW images and the region of interest separated from
the brain image registration algorithm. We use k-nearest neighbours (kNN) and random forest to classify the
SWI images into normal and abnormal groups, and then we compare our results to our previous work. The
result shows an effective classification, which achieved an accuracy of 76.25±10.9. Our research suggests
that automated analysis of neonatal SWI images can identify brain regions affected by HIE on SWI images
and predict motor and cognitive outcomes.
1 INTRODUCTION
Hypoxic-ischaemic (HI) is a type of neonatal brain
damage caused by oxygen deprivation and limited
blood flow, and it is an important cause of perinatal
death or neurodevelopmental (motor, cognitive,
behavioural and speech impairments) impairment in
newborns worldwide (Nadeem et al., 2011; Massaro
et al., 2015). Due to the complexity of neonatal brain
damaged by HI, traditional methods of diagnosing
hypoxic-ischeamic encephalopathy (HIE) results are
time-consuming and inefficient (Macleod et al.,
2020). Therefore, the application of an automatic
method will be useful to streamline the procedure for
specialists to diagnose an early diagnosis.
Magnetic resonance imaging (MRI) has become
the standard for the assessment and study of neonatal
HI injury and developmental abnormalities (Midiri et
al., 2021). Susceptibility weighted image (SWI) is
increasingly used in clinical practice because of its
sensitivity to haemorrhage and calcification (Mittal et
al., 2009; Sehgal et al., 2005). SWI images of infants
with HIE may be useful biomarkers for diagnosis and
a
https://orcid.org/0000-0002-9154-5182
outcome prediction (Zhang et al., 2019). Quantitative
analysis of deep medullary venous structures in SWI
images were used to assess the severity of HI injury
(Kim et al., 2020), and the first-order texture
parameters derived from SWI were employed to
distinguish between infants with HIE and infants
without HIE. An approach (Li et al., 2019) combined
the SWI images and magnetic resonance
spectroscopy (MRS) for early diagnosis in infants
with HIE. Another approach of automatic detection
for infants injured by HI was offered (Wu et al.,
2017), and the Hessian eigenvalue of the vessels in
SWI images was applied to classify the 48 infants
with HIE and 10 infants without HIE based on a
scoring system suggested by Kitamura (Kitamura et
al., 2011). In (Citraro et al., 2017), they developed an
extended 3D local binary pattern to distinguish the
images of a three-dimensional SWI dataset of infants
with HIE based on their oxygenation status. In our
previous work (Tang et al., 2020), balanced datasets
of SWI images of newborns with HIE and the
neurological outcomes of these infants at age 24
months were used for classification, as well as the
Tang, Z., Mahmoodi, S., Darekar, A. and Vollmer, B.
Hypoxic-Ischaemic Encephalopathy Prognosis using Susceptibility Weighted Image Analysis based on Histogram Orientation Gradient.
DOI: 10.5220/0010856800003123
In Proceedings of the 15th International Joint Conference on Biomedical Engineering Systems and Technologies (BIOSTEC 2022) - Volume 4: BIOSIGNALS, pages 57-62
ISBN: 978-989-758-552-4; ISSN: 2184-4305
Copyright
c
2022 by SCITEPRESS – Science and Technology Publications, Lda. All rights reserved
57

motor and cognitive outcomes for regression analysis.
From the above study, we see that there are two major
issues in SWI analysis in the context of neonatal HIE:
(a) unbalanced data and (b) segmentation and
extraction of different brain regions.
In the present paper, we propose an automatic
framework to detect neonatal hypoxic-ischaemic
brain injury by extracting the HOG features of the
brain and vessels in SWI images to analyse SWIs of
HIE infants. Then, an image registration technique
(Avants et al., 2009) is used to identify the brain
regions by matching the SWIs with a brain template.
The HOG is utilised to extract features of these brain
regions. All extracted feature vectors as the input are
fed into kNN and random forest algorithms for
classification of HIE infants with developmental
outcome at age 24 months.
2 DATA ACQUISITION
This use of anonymised, routinely collected clinical
data have been granted an ethical approval from the
Health Research Authority (HRA), Health and Care
Research Wales (IRAS ID 279072; REC reference
20/HRA/0260), and the National Research Ethics
Service London, City & East (IRAS ID 143392; REC
reference 13/LO/1948).
3 METHODS
In this study, 42 infants with neonatal HIE born at
gestational age >36+6 weeks who underwent
hypothermia treatment were scanned using a 1.5T
Siemens Symphony MRI scanner. The scan included
proton density, T1-weighted, T2-weighted, turbo
inversion recovery and SWI. SWI data was acquired
using a flow-compensated, spoiled gradient echo
(FLASH) sequence, with the following pulse
sequence parameters: TR/TE/flip angle = 50 ms/40
ms/12°, voxel size = 0.9 × 0.9 × 2 mm
3
, bandwidth =
70 Hz/pixels.
The participants in this study were scanned at a
mean age of 7.8 days (min 1 day, max 34 days) after
birth. Assessment of cognitive, motor, and language
development with the Bayley Scales of Infant and
Toddler Development 3 (Bayley-3; Edmonds et al.,
2020) were done at age 24 months.
The composite scores calculated from Bayley-3, a
standardised tool used to assess neurodevelopment,
including cognitive, language and motor of infants
aged from 1–42 months (Edmonds et al., 2020), are
used. Bayley-3 composite scores have a mean of 100
and a standard deviation (SD) of 15. In the case of a
Bayley-3 composite score within less than one SD of
the mean (>85), development is considered age-
appropriate; mild delay based on a composite score
greater than 1–1.5 SD below the mean (77.5–85), and
moderate or severe delays if the score is more than
1.5 SD below the mean (<77.5). In our research, the
focus is on cognitive and motor development.
Bayley-3 outcome data could be obtained for 29
children on the cognitive scale and 28 children on the
motor scale (some children were unable to complete
the motor tasks because of impaired motor function).
3.1 Image Processing
We applied an active contour model (Kass et al.,
1988) for the brain segmentation to remove the skull,
eyes and the background from the SWI images to
reduce the noise in the images as shown in Figure
1(b).
3.2 Feature Extraction of HOG
This section must be in one column. As SWI images
can sensitively capture the blood vessels and vascular
structures in the brain (Reichenbach, 2020), we
employ the Histogram of Oriented Gradients (HOG)
feature descriptors for object detection (Dalal and
Triggs, 2005). HOG is a powerful feature extraction
technique that calculates the occurrences of gradient
orientation in local parts of an image. Before
proceeding with the calculation of HOG feature
vectors, we crop the SWI images into an image of
110×130 pixels (110 pixels width and 130 pixels
height) to avoid the effect of redundant HOG features
from the background in SWI images, as shown in
Figure 1. Then, the first step of HOG is to calculate
the gradient of each pixel. We denote I(x, y) to be the
SWI image and use a Sobel kernel of size (3×3) to
obtain the horizontal and vertical gradients of each
pixel. The gradient is composed of magnitude and
angle from SWI image using following formulae:
𝑀
𝑥,𝑦
=
𝐺
+𝐺
(1
)
𝜃=
𝐴
𝑟𝑐𝑡𝑎𝑛
𝐺
𝐺
(2
)
Here, 𝐺
and 𝐺
are the gradients of each pixel in
x and y direction. M(x, y) denotes the magnitude and
𝜃 denotes gradient direction for the pixel. After
obtaining the gradient (including magnitude and
direction) of each pixel, the cropped SWI images are
BIOSIGNALS 2022 - 15th International Conference on Bio-inspired Systems and Signal Processing
58
divided into 10×10 pixels to form a cell. For each cell,
a histogram with four bins and an angle range of 45
degrees is developed. Finally, one cell is formed into
a block. The histogram vector and the normalization
process can be calculated as follows:
𝑣
= {𝑏
,𝑏
,…,𝑏
}
(3)
𝑣
’
=
𝑣
/
‖
𝑣
‖
+𝜀
(4)
where 𝑏 is the value of each bin, ε is a small positive
value used for regularization to avoid division by
zero.
For each SWI image of each infant with HIE, the
total length of HOG features is 4×11×13 = 572. We
sum up the HOG features of each SWI image
belonging to the same infant with neonatal HIE to
create a feature vector, 𝑉
, describing the image,
and then the feature vector for each infant is
normalised. Figure 1 shows HOG of SWI image with
HIE.
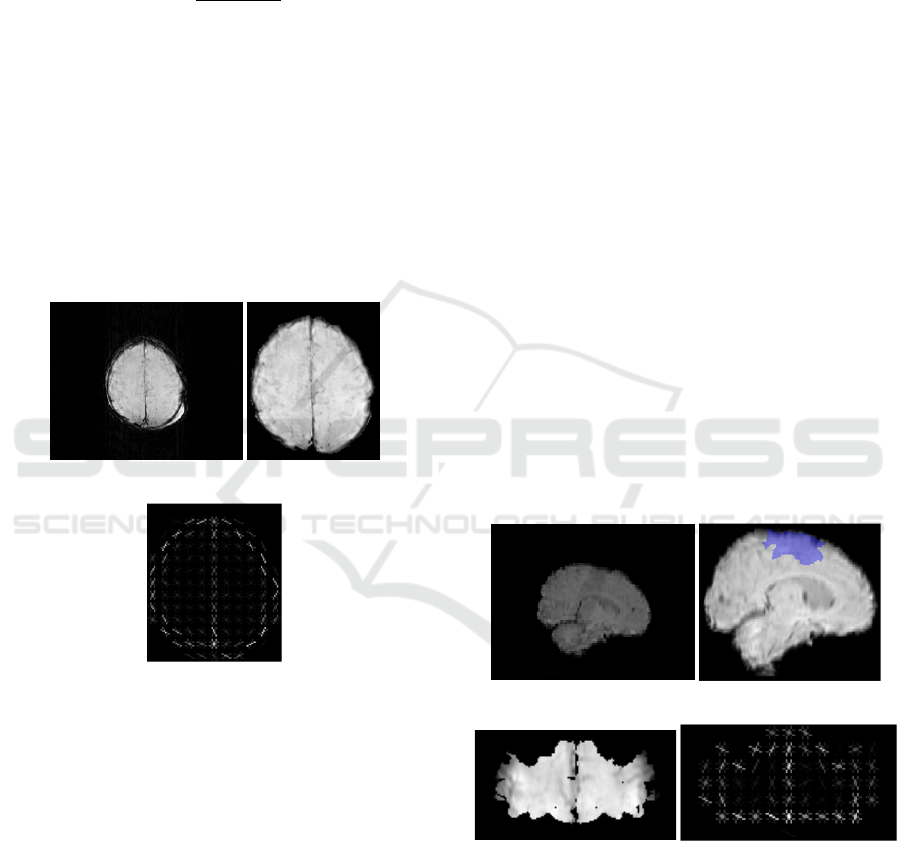
(a) (b)
(c)
Figure 1: (a) Original SWI image (b) Cropped image after
active contour (c) HOG image.
3.3 Image Registration
In order to look for the brain regions affected by
hypoxic-ischaemic, we register the atlas, including
the average intensity image, the tissue density maps,
the structure density maps, and the maximum
probabilistic maps and labels, as a reference template
with the SWIs to identify individual lopes in SWIs.
The brain template, LPBA40/AIR, (https://
resource.loni.usc.edu/resources/atlases-downloads/)
is selected for this study. The image registration of
SWI datasets is carried out using Advanced
Normalisation Tools (ANTs) (Avants et al., 2009),
which has the best quality for registration of brain
magnetic resonance images. We convert all SWI
images of each infant in our dataset into 3D brain
images to be registered. The strategy on ANTs
registration programme for which we opt for, is to
map the SWI images to the template brain images
using similarity transform and obtain the registered
SWI images.
The LPB40/AIR template provides a standard
normalised space containing 56 brain structures and
partition labels, such as frontal lobe and parietal lobe
(Shattuck et al., 2008). Since SWI images of each
infant with neonatal HIE are transformed/registered
into a template brain of an atlas based on an image
registration method, we map the 56 labels of the
maximum probabilistic maps onto the new registered
SWI images for analysis. We eventually consider the
primary motor area, premotor area, and
supplementary motor area of 3D images to explore
the relationship between the SWI features in these
areas and motor outcomes at 24 months of age. To
explore the relationship with cognitive outcomes
frontal lobe, parietal lobe and temporal lobe of the
brain as a 3D brain were examined. As shown in
Figure 2(b), the area covered in blue represents the
motor area. The motor areas of the brain in SWI
images are therefore selected by registering SWI
images to the template brain and the motor areas are
left in the 3D image with the rest of the brain being
ignored (i.e. set to zero).
(a) (b)
(c) (d)
Figure 2: (a) Original brain image. (b) Brain image after
registration and motor area covered by blue (c) 2D image
of motor area (d) HOG of motor area.
Finally we consider the 3D motor region images
as slices and compute HOG feature vector 𝑉
associated with the motor region. In a similar fashion,
we select frontal, parietal and temporal lobes for
Hypoxic-Ischaemic Encephalopathy Prognosis using Susceptibility Weighted Image Analysis based on Histogram Orientation Gradient
59

cognitive regions of the brain by using the
aforementioned registration method. Then by only
considering these three lobes on the 3D SWIs and
ignoring the rest of the brain, we measure the HOG
feature vectors 𝑉
associated with these three
lobes.
4 RESULT
4.1 Classification for Motor Outcome
For the 28 infants with HIE who were assessed with
Bayley-3 scales, 25 infants have normal motor
development (scores>85), two infants have mild
motor delay (scores between 77.5–85), and one has
severe motor delay (score<77.5). The normal group
with normal motor outcomes and the abnormal group
with mild motor delays and severe motor delays are
used as two classes for classification.
We employ HOG feature vectors 𝑉
and
𝑉
for each infant of two classes as training data.
kNN and RF classifications are performed based on
these feature vectors.
Likewise, balanced data based on three infants
with delayed motor scores and three infants with
normal motor scores randomly selected from a group
of 25 infants with normal motor scores has been used
for classification. By repeating the above process ten
times with random selections from normal group, the
mean and standard deviation of classification
accuracies are calculated. Leave-one-out strategy is
employed here, and final accuracy is reported in
Table 1.
4.2 Classification for Cognitive
Outcome
29 infants, of which 25 have normal cognitive
outcome (scores>85), three had mild cognitive delay
(scores between 77.5–85) and one had severe
cognitive delay (scores <77.5), are partitioned by two
groups: the normal group with normal cognitive
outcomes and the abnormal group with mild and
severe cognitive delay outcomes. Here, we use HOG
feature vectors 𝑉
and 𝑉
for each infant with
cognitive outcome as an input of kNN and RF
classifications.
Again, we utilise the balanced data, in which four
infants with delayed cognitive scores and four infants
with normal cognitive scores were randomly selected
from the 25 infants in the normal cognitive score
group to measure the performance of kNN and RF
classification with a leave-one-out strategy. By
repeating ten times the aforementioned classification,
the mean and standard deviation of final accuracy is
computed in Table 1.
4.3 Experimental Result
The classification analysis based on the motor
outcome and cognitive outcome of infants with HIE
all are a two class tasks: normal group and abnormal
group. HOG feature vectors from whole brain 𝑉
and from different functional areas, including motor
area 𝑉
and cognitive regions of the brain 𝑉
,
are fed to kNN and RF classification for comparison.
All classification performances are compared to our
previous work (Tang et al., 2020), which means we
extract features from motor area and frontal, temporal
and parietal lobes by using the method (Tang et al.,
2020) to classify.
Table 1: Classification performance comparison.
Features kN
N
RF
Motor
outcome
Whole
brain
Tang et
al., 2020
48.33±9.46 69.91±18.92
𝑉
55.01±8.05 63.33±7.03
Motor
area
Tang et
al., 2020
41.52±16.14 68.83±14.59
𝑉
61.67±15.81 71.67±11.24
Cognitive
outcome
Whole
brain
Tang et
al., 2020
53.75±15.64 61.25±13.75
𝑉
53.75±13.24 70.00±6.45
Frontal+
temporal+
parietal
lobes
Tang et
al., 2020
56.25±13.5 62.5±10.2
𝑉
57.5±8.74 76.25±10.9
Table 1 shows the different classification results
using features from different strategies. For motor
development outcome, features from (Tang et al.,
2020) still produce better accuracy than HOG features
represented by vector 𝑉
in whole brain area. But
in the motor area of the brain, the classification
performance of feature vector 𝑉
using HOG
feature descriptor exceeds that of features in (Tang et
al., 2020). Compared with methods (Tang et al.,
2020), HOG features we propose in this paper
perform higher accuracy in both whole brain area and
motor area of the brain for cognitive outcome. From
Table 1, HOG features obtained from only the motor
areas show better classification accuracies for HIE
motor development outcome prognosis in SWI
BIOSIGNALS 2022 - 15th International Conference on Bio-inspired Systems and Signal Processing
60
images. Also the feature vectors generated by HOG
descriptors in frontal, parietal and temporal lobes for
cognitive regions of the brain are effective in
classifying infants with cognitive outcome in SWI
images.
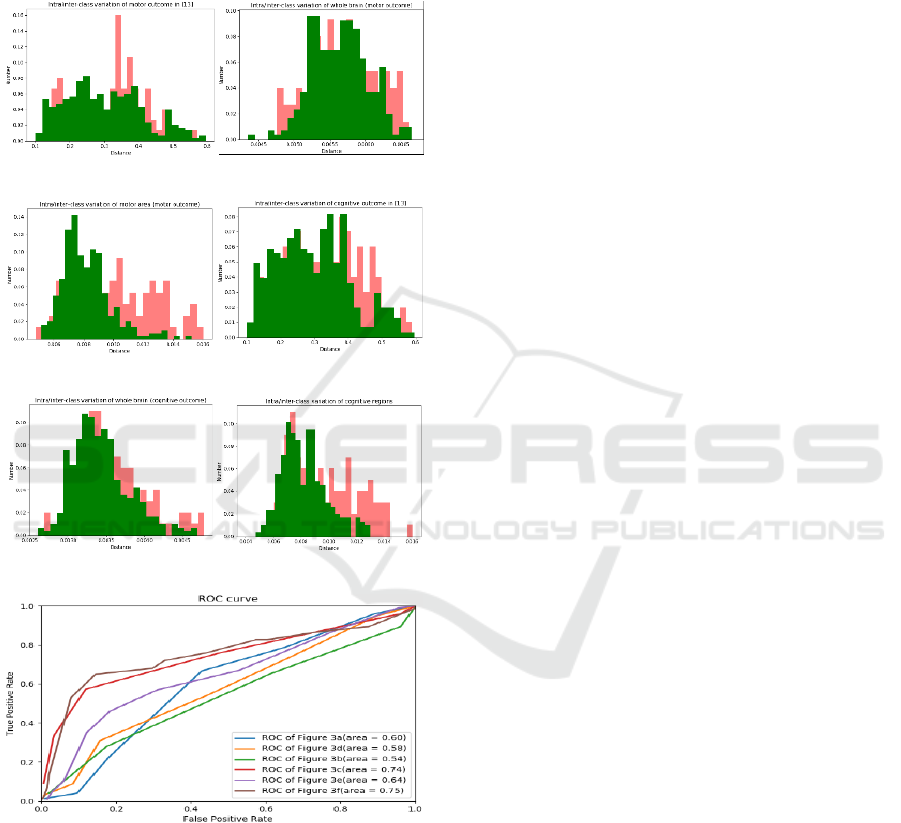
Figure 3 shows the inter/intra- class variations for
two normal and abnormal groups for motor outcome
(a) (b)
(c) (d)
(e) (f)
(g)
Figure 3: Inter/intra-class variations associated with motor
outcome for: (a) features obtained from (Tang et al., 2020);
(b) HOG features of whole brain with motor outcome; (c)
HOG features of motor area. Inter/intra-class variations
associated with cognitive outcome for: (d) features obtained
from (Tang et al., 2020); (e) HOG features of whole brain
with cognitive outcome; (f) HOG features of cognitive
regions. (g) ROC curves of above inter/intra- class
variations plots.
(Figure 3(a, b and c)), and cognitive outcome (Figure
3(d, e and f)). The green histograms represents the
intra-class variation for infants in the same group and
the red histograms show the inter-class for infants
from two different groups. Histograms of features
extracted using methods in (Tang et al., 2020) (figure
3(a and d)) and using methods in this paper (figure
3(b, c, e, and f)) are normalised to the area below each
histogram. As shown in figure 3(a and d), the two
histograms are highly overlapped. Figure 3(b)
presents the inter- and intra- class variation
histograms of HOG feature vectors from whole brain
area between normal and abnormal groups in infants
with motor outcome, and furthermore figure 3(c)
shows the inter- and intra-class variations of HOG
features from motor area of brain. Figure 3(e) shows
the inter/intra-class variation histograms of HOG
features from whole brain area between normal and
abnormal groups in infants with cognitive outcome,
while figure 3(f) shows the variations of HOG
features from cognitive regions. The Receiver
Operator Characteristic (ROC) curves corresponding
to the inter- and intra- class variations are shown in
figure 3(g). As observed from figure 3(c and f), the
overlap between two histograms and the areas under
the ROC curves (brown and red curves) illustrate a
better performance after using image registration to
extract the HOG features of motor areas and cognitive
areas.
5 CONCLUSIONS
In this paper, a HOG feature extraction method for
detection of neonatal hypoxic-ischeamic brain injury
in SWI images has been used. We design a HOG
feature descriptor to gain feature vectors to classify
HIE SWI images along with kNN and random forest
classifiers into normal and abnormal groups based on
motor and cognitive assessments of infants with HIE
at age 24 months. In addition, we map our SWI
images to a brain template containing different
function regions by an image registration algorithm to
obtain motor and cognitive regions of the brain. Then
HOG feature vectors of motor and cognitive regions
are used for classification to help us identify which
areas of the brain are responsible for abnormal
outcome. Compared to our previous work (Tang et al.,
2020), we achieve outstanding performance in the
classification experimentations on HIE infants with
regards to motor development outcome by using
HOG features of motor areas of the brain in SWI
images, 71.67±11.24, and similarly HOG features of
frontal, temporal and parietal lobes of the brain show
Hypoxic-Ischaemic Encephalopathy Prognosis using Susceptibility Weighted Image Analysis based on Histogram Orientation Gradient
61

better classification performance for cognitive
outcome, 76.25±10.9. In the future, we plan to
explore the relationship between other regions of the
brain and assessment outcome at two years of age.
One interesting future work is to combine our
previous method (Tang et al., 2020) with the method
presented in this paper to improve the performance of
our system.
REFERENCES
Nadeem, M., Murray, D. M., Boylan, G. B., Dempsey, E.
M., & Ryan, C. A. (2011). Early blood glucose profile
and neurodevelopmental outcome at two years in
neonatal hypoxic-ischaemic encephalopathy. BMC
Pediatrics, 11(1), 1–6.
Massaro, A. N., Evangelou, I., Fatemi, A., Vezina, G.,
Mccarter, R., Glass, P., & Limperopoulos, C. (2015).
White matter tract integrity and developmental
outcome in newborn infants with hypoxic‐ischemic
encephalopathy treated with hypothermia.
Developmental Medicine & Child Neurology, 57(5),
441-448.
Mittal, S., Wu, Z., Neelavalli, J., & Haacke, E. M. (2009).
Susceptibility-weighted imaging: Technical aspects
and clinical applications, part 2. American Journal of
Neuroradiology, 30(2), 232–252.
Sehgal, V., Delproposto, Z., Haacke, E. M., Tong, K. A.,
Wycliffe, N., Kido, D. K., & Reichenbach, J. R. (2005).
Clinical applications of neuroimaging with
susceptibility‐weighted imaging. Journal of Magnetic
Resonance Imaging: An Official Journal of the
International Society for Magnetic Resonance in
Medicine, 22(4), 439–450.
Macleod, R., O’Muircheartaigh, J., Edwards, A. D.,
Carmichael, D., Rutherford, M., & Counsell, S. J.
(2020). Automatic Detection of Neonatal Brain Injury
on MRI. In Medical Ultrasound, and Preterm,
Perinatal and Paediatric Image Analysis (pp. 324–
333). Springer, Cham.
Midiri, F., La Spina, C., Alongi, A., Vernuccio, F., Longo,
M., Argo, A., & Midiri, M. (2021). Ischemic hypoxic
encephalopathy: The role of MRI of neonatal injury and
medico-legal implication. Forensic Science
International, 110968.
Zhang, X., Zhang, Y., & Hu, Q. (2019). Deep learning
based vein segmentation from susceptibility-weighted
images. Computing, 101(6), 637–652.
Kim, H. G., Choi, J. W., Han, M., Lee, J. H., & Lee, H. S.
(2020). Texture analysis of deep medullary veins on
susceptibility-weighted imaging in infants: Evaluating
developmental and ischemic changes. European
Radiology, 30(5), 2594–2603.
Li, X., Zhang, W., Liu, D., & Zeng, Y. W. (2019). Effect of
3.0 T magnetic resonance SWI and MRS on early
diagnosis of neonatal HIE and regression analysis of
related predictive factors. Journal of Hainan Medical
University, 25(1), 75–78.
Wu, S., Mahmoodi, S., Darekar, A., Vollmer, B., Lewis, E.,
& Liljeroth, M. (2017, July). Feature extraction and
classification to diagnose hypoxic-ischemic
encephalopathy patients by using susceptibility-
weighted MRI images. In Annual Conference on
Medical Image Understanding and Analysis (pp. 527–
536). Springer, Cham.
Kitamura, G., Kido, D., Wycliffe, N., Jacobson, J. P.,
Oyoyo, U., & Ashwal, S. (2011). Hypoxic-ischemic
injury: Utility of susceptibility-weighted imaging.
Pediatric Neurology, 45(4), 220–224.
Citraro, L., Mahmoodi, S., Darekar, A., & Vollmer, B.
(2017). Extended three-dimensional rotation invariant
local binary patterns. Image and Vision Computing, 62,
8–18.
Tang, Z., Mahmoodi, S., Dasmahapatra, S., Darekar, A., &
Vollmer, B. (2020, July). Ridge detection and analysis
of susceptibility-weighted magnetic resonance imaging
in neonatal hypoxic-ischaemic encephalopathy. In
Annual Conference on Medical Image Understanding
and Analysis (pp. 307–318). Springer, Cham.
Edmonds, C. J., Helps, S. K., Hart, D., Zatorska, A., Gupta,
N., Cianfaglione, R., & Vollmer, B. (2020). Minor
neurological signs and behavioural function at age 2
years in neonatal hypoxic ischaemic encephalopathy
(HIE). European Journal of Paediatric Neurology, 27,
78–85.
Kass, M., Witkin, A., & Terzopoulos, D. (1988). Snakes:
Active contour models. International Journal of
Computer Vision, 1(4), 321–331.
Reichenbach, J. R. (2020). Susceptibility weighted
imaging. In Neuroimaging Techniques in Clinical
Practice (pp. 165–187). Springer, Cham.
Dalal, N., & Triggs, B. (2005, June). Histograms of oriented
gradients for human detection. In 2005 IEEE Computer
Society Conference on Computer Vision and Pattern
Recognition (CVPR'05) (Vol. 1, pp. 886–893). IEEE.
Avants, B. B., Tustison, N., & Song, G. (2009). Advanced
normalization tools (ANTS). Insight j, 2(365), 1-35.
Shattuck, D. W., Mirza, M., Adisetiyo, V., Hojatkashani,
C., Salamon, G., Narr, K. L, & Toga, A. W. (2008).
Construction of a 3D probabilistic atlas of human
cortical structures. Neuroimage, 39(3), 1064–1080.
BIOSIGNALS 2022 - 15th International Conference on Bio-inspired Systems and Signal Processing
62
