
BER based Assessment of Spectral and Energy Efficiency in a
Two-tier Heterogeneous Network
Jasmin Musovic
1a
, Adriana Lipovac
2b
and Vlatko Lipovac
2c
1
Communications Regulatory Agency, Sarajevo, Bosnia and Herzegovina
2
Dept. of Electrical Engineering and Computing, Univ. of Dubrovnik, Dubrovnik, Croatia
Keywords: BER, Heterogeneous Network, Spectral Efficiency, Energy Efficiency.
Abstract: In this paper, we analyze an arbitrary heterogeneous cellular network applying stochastic geometry, and
propose a modified model for assessing network spectral and energy efficiency. With this regard, we
recognize that, in practice, determining Signal-to-Noise-and-Interference Ratio (SINR) as the key
performance indicator, requires complex field test equipment, which might not be available or affordable.
Therefore, we propose here a simple model that is based on the relatively easy measurable Bit-Error Rate
(BER), whose degradation caused by various impairments is considered here as if it was due to the according
additive white Gaussian noise (AWGN), thus abstracting any specific non-AWGN distortion. The proposed
analytical model is verified by ns3 software network simulator, whose test results are found to match the
corresponding estimated values. This indicates that both spectral and energy efficiencies of small-cell
networks are higher than in larger-cell networks, even more for heterogeneous two-tier networks.
1 INTRODUCTION
It has been quite a while since it has become evident
that homogeneous cellular network architecture
cannot adequately fulfil the fast growing users’
demand for capacity and Quality- of Service (QoS)
(Parkvall, 2008), as well as efficient spectrum and
energy consumption.
Starting with the fourth generation (4G) mobile
networks, it has become evident that smaller cells
enhance the network performance, and off-loads the
macro network from excessive traffic. So, for
example, simple plug-and-play installed femto cells
are more profitable than macrocells, due to reduced
backhaul costs and less transmitted power required in
small cells.
Specifically, state-of-the-art Radio Access
Systems (RAS) encompass cells of different classes
to make up a Heterogeneous Cellular Network
(HetNet), which includes at least two same-class
groups – tiers (Slamnik, 2016; Slamnik, 2017).
The actual explosive growth of data traffic implies
severe demand on energy efficiency (EE), so with the
4G Long-Term Evolution (LTE) and its extension
LTE Advanced (LTE-A), as well as with the
incoming 5G HetNets, transmission performance
enhancements include reduction of the distance
between the transmitting and the receiving antennas.
With respect to EE of wireless access networks,
the metrics is focused (Bousia, 2014 – ETSI TS
2011)) on the energy per information [J/b], enriched
by some QoS-related features (ETSI TR 2021) to
improve HetNet’s capacity and coverage, which both
depend on Signal-to-Interference-plus-Noise Ratio
(SINR).
Therefore, we investigate various HetNet
performance scenarios, but using Bit-Error Rate
(BER) rather than SINR at each User Equipment
(UE) (Mukherjee, 2014) within the serving tier area
of a single BS, and a single candidate-serving BS.
We will pursue BER analysis towards network
spectral efficiency (SE) and EE. Concretely, instead
of the classic hexagonal-grid based cellular network
composition with a BS-cantered each cell (Baccelli,
1997 – Baccelli, 2001); we used stochastic geometry
to capture randomness in network topology (Baccelli,
1997 – Brown 2000).
With this regard, the Herne topology is modelled
through Poisson Point Process (PPP) (Mukherjee,
2014), which describes irregular placements of BSs
within a real network, better than the classic
hexagonal-grid model (Baccelli, 1997).
116
Musovic, J., Lipovac, A. and Lipovac, V.
BER based Assessment of Spectral and Energy Efficiency in a Two-tier Heterogeneous Network.
DOI: 10.5220/0010852600003121
In Proceedings of the 10th International Conference on Photonics, Optics and Laser Technology (PHOTOPTICS 2022), pages 116-122
ISBN: 978-989-758-554-8; ISSN: 2184-4364
Copyright
c
2022 by SCITEPRESS – Science and Technology Publications, Lda. All rights reserved
Although the PPP-based topology analysis is not
new (Baccelli, 1997; ElSawy, 2013; Dhillon, 2012),
it was not long ago when the PPP-distributed BSs
were introduced in various Herne (Brown, 2000),
(Dhillon, 2012 – Heath, 2013) and MIMO inclusive
network scenarios.
In Section II, we firstly provide a short basic
theoretical review, specifically considering
performance limits and related trade-off between SE
and EE. The short-term BER, SE and EE based
analytical model is presented as applicable for large
Honest who’s serving and candidate-serving BSs
have random distribution in the actual serving tier
area. Finally, the analytical model is verified in
Section III by presenting the test results obtained by
means of ns3 simulation tool that provided the short-
term BER values for all UEs of the network under
test. Conclusions are summarized in Section IV.
2 ANALYSIS
Complex relationship between SE and EE of
multiuser radio networks is determined by
compromises involving throughput, overall system
energy, frequency resources distribution, traffic flow
patterns, acceptable erroneous protocol data unit
rates, and achieved vs. target QoS level.
Generally, SE of wireless communication
networks is the ratio of the transmission rate R [b/s]
to the bandwidth B [Hz] that is needed to achieve R
(Musovic, 2021).
Moreover, the radio channel EE [b/J] is the ratio
between the energy per bit Eb and the noise spectral
density N0, i.e. EE expresses the count of information
bits per energy unit.
So, the Shannon formula for radio channel
capacity C [b/s] originally depending on channel
bandwidth B and mean power P
S
, can be expressed by
SE and EE as it follows (Musovic, 2021):
𝐶=𝐵𝑙𝑜𝑔
1
=𝐵𝑙𝑜𝑔
1
=
= 𝐵 𝑙𝑜𝑔
1𝑆𝐸𝐸𝐸
(1)
Specifically, for transmission over the Additive-
White-Gaussian-Noise (AWGN) channel, having
given P
S
and B, where we consider EE as the ratio
C/B, (1) implies that:
𝑆𝐸 = log
1𝑆𝐸∙𝐸𝐸
(2)
Thus, we can explicitly express EE as a function
of SE:
𝐸𝐸 =
2
1
𝑆𝐸
(3)
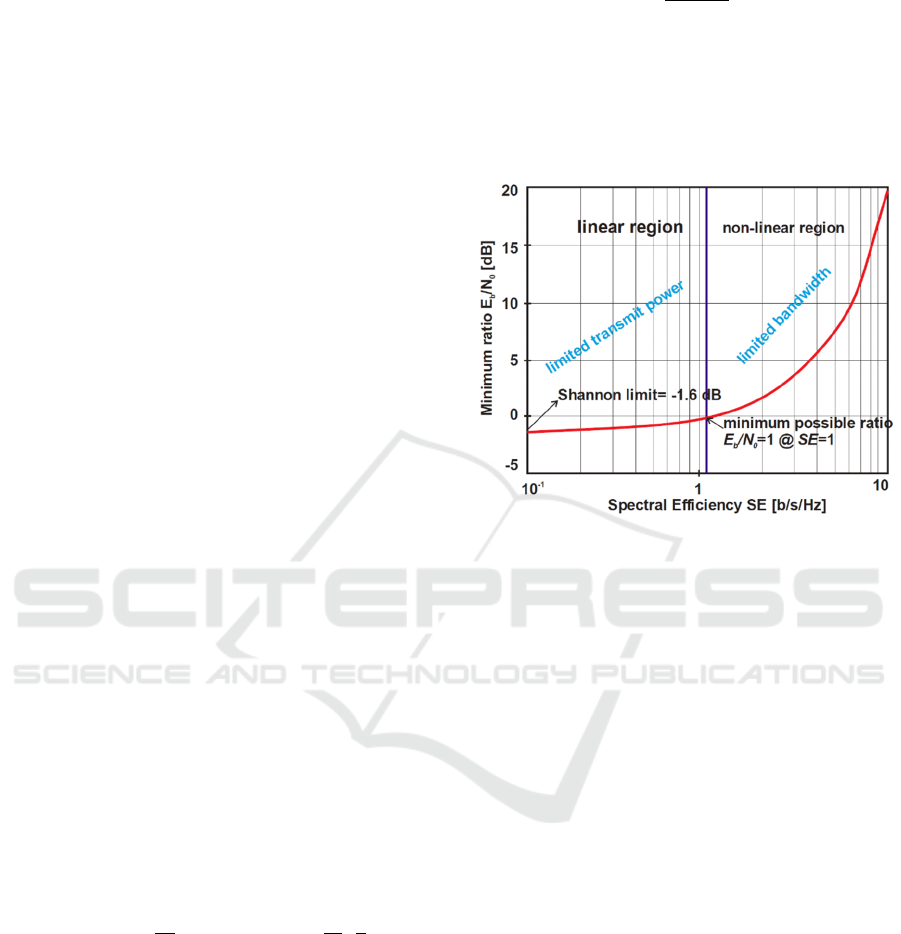
In the utmost simple case of a single-BS and a
single-UE wireless network, (3) enables the analysis
of SE vs. EE relationship in linear and non-linear
power and energy regions, Figure 1, thus aiming to
enable considerably enlargements of throughput and
data rate (Musovic, 2021).
Figure 1: EE vs E
b
/N
0
relationship.
From these considerations, it is obvious that
increasing data rate requires significantly larger
received signal power (Musovic, 2021).
This implies the BS-to-UE distances of the order
of tens of meters, whereas still in the linear-region
tolerating considerably larger values (but with
considerably smaller SE, due to EE reduction by
propagation impairments.)
In the non-linear-region, however, considerably
larger EE can be achieved, as stronger received
signals enable reduction of cell dimensions as low as
tens of meters, with the variety of cell classes
comprising: micro, nano, pico and femto cells. These
enable close-to-uniform EE distribution,
considerably larger SE and thus the throughput and
rational coverage with still good enough EE,
especially in areas crowded with active users, and
considerably lower electromagnetic radiation
(Musovic, 2021).
So far, the HetNet overall efficiency was analyzed
by considering both SE and EE, and determining
SINR for each UE within the k-tier of HetNet having
N
T
tiers overall (Musovic, 2021).
Each tier (e.g. k-th) is modeled by a homogeneous
PPP Φ
k
, with the transmit power P
k
, BSs density λ
k
,
and the SINR threshold τ
k
(often referenced as “bias”)
at UE, respectively.
BER based Assessment of Spectral and Energy Efficiency in a Two-tier Heterogeneous Network
117
2.1 BER based Analytical Model
Degraded SINR usually implies constellation symbol
errors, and thereby SINR is often tested, which
requires complex equipment to measure the noise and
inter-symbol interference (ISI) (Lipovac, 2021).
Instead, estimating BER, can be an alternative, i.e. an
easy-to-measure performance trade – off “currency”,
rather than SINR (where by “easiness”, we consider
the possibility to estimate BER in-service, simply by
counting the retransmissions at the physical/MAC
layer whose count determines the Block-Error ratio
(BLER). Then an appropriate model can be applied to
estimate BER from BLER.
This could be useful in practice encompassing
various phases of a product related research,
development, manufacturing, and finally its
exploitation of a product in LTE and 5G New Radio
environment.
Let us review the classical BER expression as a
function of Signal-to-Noise Ratio (SNR), for the M-
QAM signal transmission over AWGN channel
(Rumnay, 2013):
−
⋅
⋅=
1
3
log
4
2
M
SNR
Q
M
BER
(4)
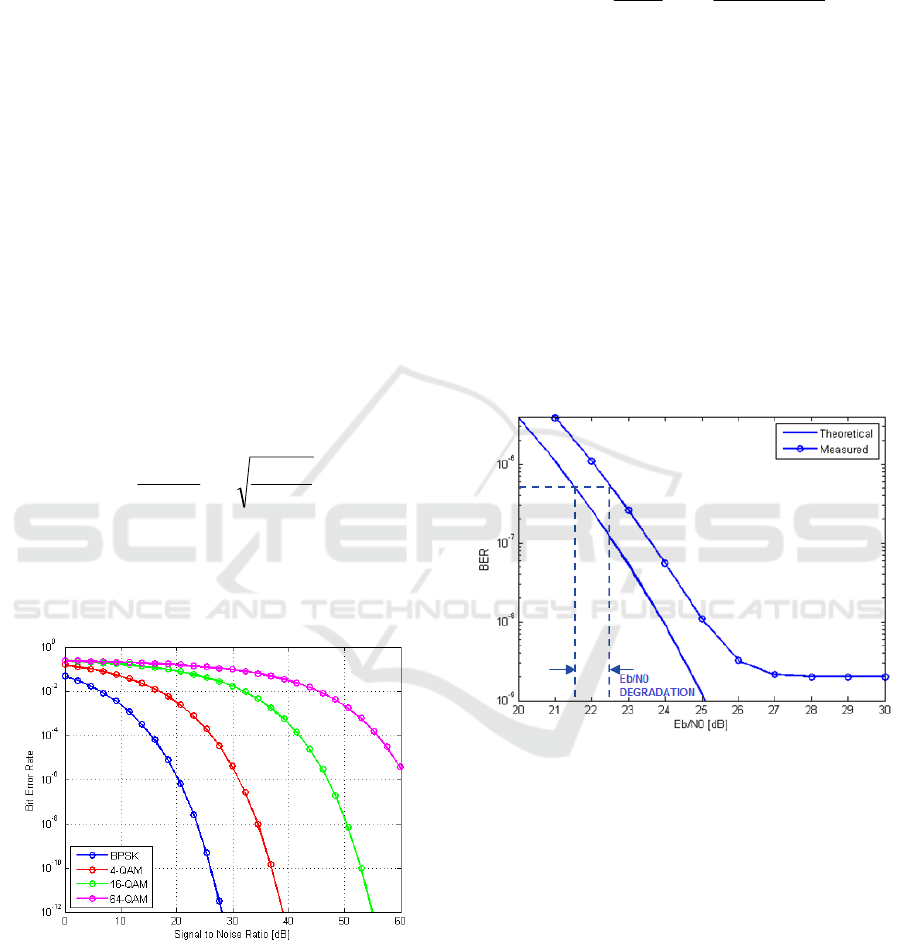
where Q stands for the Gaussian tail function,
represented by the “waterfall” - steep curves in Fig.
2, which visualize the threshold effect that is
immanent to digital radio receivers.
Figure 2: Waterfall BER vs SNR curves (for Nyquist BW).
Furthermore, it is quite often that in various
propagation environments, specifically in very small
cells, presuming strong received signals (i.e. high
SNR) is realistic, which implies successful
elimination of the time-dispersion-caused inter-
symbol interference (ISI) by long-enough cyclic
prefix (CP) (Lipovac, 2021).
This practically reduces SINR to SNR, so (4)
implies that:
2
2
1
4
log
3
1
⋅−
=≈
−
MBER
Q
M
SNRSINR
(5)
where
1−
Q
denotes the inverse function of the
Gaussian tail.
In addition, it is quite justifiable to consider the
radio interference to be a dominant impairment,
which (as a sum of enough many mutually
independent RF interfering signals, and according to
the Central Limit Theorem), is a Gaussian random
variable.
Moreover, applying link abstraction, any
distortion, be it additive or not, or non-Gaussian, can
be considered equivalent to that much additive
Gaussian noise which would produce the same BER
degradation, i.e. shift the BER(SNR) curves from Fig.
2 to the right for the adequate SNR degradation, which
is in Fig. 3 expressed as the ratio of E
b
to N
0
.
Figure 3: AWGN abstraction of non-AWGN impairments.
With this regard, we can justifiably assume
successful CP-aided mitigation of channel time
dispersion, i.e. that the standard CP is long enough
(e.g. as the “normal” one in LTE) to eliminate the vast
majority of error bursts mostly arising from multipath
propagation, and retain only sporadic bit errors that
mostly occur sporadically in residual bursts (to be
scattered by interleaving, anyway) (Lipovac, 2021).
Finally, as the simple and common BER tests
have been “ex-communicated” from the LTE (and 5G
as well) transmission performance specifications for
network operators, in favor of BLER (Rumnay,
2013), therefore, in order to estimate BER in-service,
we need to adopt a certain relationship between
BLER and BER.
PHOTOPTICS 2022 - 10th International Conference on Photonics, Optics and Laser Technology
118

However, although the common binomial
distribution well statistically describes mutually
independent bit error occurrences within a data block
(e.g. the LTE code-block), in this case, we could
consider that the appropriate error generating model
should still preserve (moderate) mutual dependability
among the individual bit-error occurrences. This
conforms to the statistical model of sampling
without replacement, well described by the hyper-
geometric distribution of errors within an errored data
block (containing one or more erroneous bits)
(Lipovac, 2021):
2.2 Spectral and Energy Efficiency
Model
The tiers are ranked in ascending order according to
the density of access points: λ
1
≤ λ
2
...λ
k−1
≤ λ
k
. For
any specific λ
k
, the count of access points of tier k
i
(i=1,2,…,N
T
) within the covered area 𝒜 [m
2
] is a
Poisson random variable with mean 𝒜∙𝜆
,
independent of other tiers. Moreover, all k-tier access
points transmit with power P
k
.
Each downlink is modeled as Rayleigh fading
channel, with the BS-transmitted power 𝑃
and the
UE-received power 𝑃
at R
i
distance from BS.
In this model, we have chosen the path-loss
exponent to be equal to 4 (Slamnik, 2016), and that
macro BSs do not transmit during the Almost Blank
Subframes (ABS) (Slamnik, 2017).
For each tier, we consider the frequency reuse
factor of unity, and the RF band of one channel
skipped between the two same-standard tiers, which
implies that for a particular UE connected to tier k, all
interfering BSs are within that tier (k), with the
exception of the serving one.
In the considered scenario, each UE is allowed to
access only the BSs in tiers 1,2,...,K
open
from Open
Access (OA) macro/femto cells, whereas the Closed
Subscriber Group (CSG) femto cells are mostly not
allowed to serve those users under consideration [8].
So, a certain HetNet would be represented by the
count of tiers: N
T
= 3 and the count of OA tiers: N
open
= 2, with tier 1 representing the macro cells, tier 2
standing for the OA femto cells, and tier 3 for the
CSG femto-cells.
Furthermore, we assume maximal allowed BS-
transmitted power (for the actual tier).
Now, let us analyze the above explored
relationship between the network SE and the total
power so that the distribution of BSs within the tiers
is in the form of PPP.
In addition, we suppose that a particular BS b
k
of
any serving tier k
i
transmits only to a subset of users
U
b
served by b
k
∈Φ
k
.
Let us consider the SINR 𝛤
𝑢
for the specific
user u
b
∊U
b
, expressed by BER, according to (5).
Then the spectral efficiency SE
k
of the link from
b
k
to any target u
b
is:
[]
{}
⋅
⋅
−
+⋅≈
=+⋅=
−
2
2
1
2
2
4
log
3
1
1logE
)(1logE
MBER
Q
M
uΓSE
bk
𝑏∈Φ,𝑃
𝑈
=𝑢
=
1
|
𝑈
|
,𝑢
∈𝑈
(6)
The proposed analytical model provides the
spectral efficiency SE
k
for each tier (k=1…N
T
), as
well as the one - SE
TOT
for the whole HetNet.
Furthermore, the selection of serving or
candidate-serving cells according to the LTE-A
standard is mostly based on the pico-cell BSs range
extension to enable traffic load balancing, and
prevent inter-cell RF interference in the areas with
evident or expected signal overlapping coverage
(Musovic, 2021).
The mean levels of the UE-received pilot
originating by the candidate-serving macro and pico
BSs, were used for selecting the optimal small-cell
tier to serve a particular UE, according to two
schemes:
Firstly, we consider the macro tier i to be the
serving tier, and the pico tier j to be the candidate-
serving tier, otherwise it is the pico tier j to serve the
UE, whereas the macro tier i is the candidate-serving
tier (Mukherjee, 2014).
In the following, with R
i
and R
j
, we denoted the
distances between the UE and the candidate-serving
(i.e. the nearest) macro BS, and femto BS,
respectively.
As we plan to simply model the HetNet SE we
adopt that the instantaneous transmitted signal power
of any macro BS is considered a random variable
ranging from zero during ABS state, or to 𝑃
otherwise. Furthermore, we denote the instantaneous
transmit power of the serving BS by 𝑃
.
Firstly, we adopt that a certain UE of an arbitrary
location is being served by the micro tier i, whose
SINR Γ
i
is greater than the threshold γ with the
probability 𝒫
.
Secondly, we consider that a certain UE is being
served by the micro tier i, whereas the probability of
the UE being served by the pico tier with appropriate
SINR, is denoted as 𝒫
.
BER based Assessment of Spectral and Energy Efficiency in a Two-tier Heterogeneous Network
119
Thereby, from (1) and (2), SE
i
and SE
j
can be
expressed as:
𝒫
=𝒫𝛤
𝛾∥ℛ
=𝑟
,ℛ
=𝑟
(7)
𝒫
=𝒫𝛤
𝛾∥ℛ
=𝑟
,ℛ
=𝑟
(8)
Integrating the (exponential) probability density
functions of distances between the UE and the serving
tier i, as well as from the candidate-serving tier j,
provides 𝑆𝐸
and 𝑆𝐸
, as well as the overall HetNet
spectral efficiency as it follows:
𝑆𝐸
=𝑆𝐸
𝑆𝐸
(9)
3 TEST RESULTS
The above presented analytical model is software
implemented using ns3 network simulator.
Our preliminary test results are aimed to just
verify the proposed concept, whereas the follow-up
tests of this kind can be repeated as many times as
needed.
Five rounds of according simulations were made,
with the BER results in particular, enhanced by
statistical data averaging. Finally, the three
considered scenarios were tested:
- single-tier, 5 macro BSs, BS power: 40 W,
- single-tier 250 pico BSs, BS power: 0.25W,
- two-tier 5 macro + 250 pico BSs.
The set up data for the simulation are presented in
Table 1.
Table 1: Parameters used in ns3 simulations.
Parameter Value
LTE code-block maximal size (L) 6144 Bytes
Count of macro cell BSs 5
Maximal output transmit power of the
macro-cell BS
40W
Maximal output transmit power of the
small-cell BS
250mW
Count of small-cell BSs 250
Population density per m
2
3.8·10
-4
Maximal distance between BSs in the
macro cell
500m
Maximal distance between BSs in the
small cell
50m
Count of resource blocks with
the LTE 5MHz channel bandwidth
25
Center of the frequency operating band: 2.1GHz
LTE channel bandwidth 5MHz
Furthermore, based on the set up values given in
Table 1, in Table 2, are the obtained simulation
results.
Table 2: Simulation results (after averaging).
BER SINR SE[b/s/Hz] EE[b/J]
0.0378 11.98 17.28 0.53
0.0550 11.06 15.96 1.04
0.0659 10.55 15.22 1.65
0.0813 9.86 14.22 3.09
0.0921 9.45 13.63 4.45
0.0996 9.16 13.22 5.75
Accordingly, the proposed analytical model is
graphically represented in Fig. 4, reflecting various
exemplar scenarios that we considered. Coming out
of the presented curves, it is evident that SE of the
entire HetNet of interest grows exponentially with
transmit power ratio, when small cells are
implemented surrounding a typical macro cell.
However, it is quite different with only a single macro
tier, where SE does not change with transmit power
ratio.
Figure 4: Spectral efficiency vs. relative transmit power and
cell range expansion bias (theta).
Therefore, more pico cells in the network
inevitably imply higher spectral efficiency, which
complies to the expected values obtained by the
proposed analytical model.
Accordingly, the diagrams in Fig. 5(a) and (b)
represent SE and EE, respectively, resulting from
simulations of the three above reviewed scenarios and
parameters’ values in Table 1:
PHOTOPTICS 2022 - 10th International Conference on Photonics, Optics and Laser Technology
120
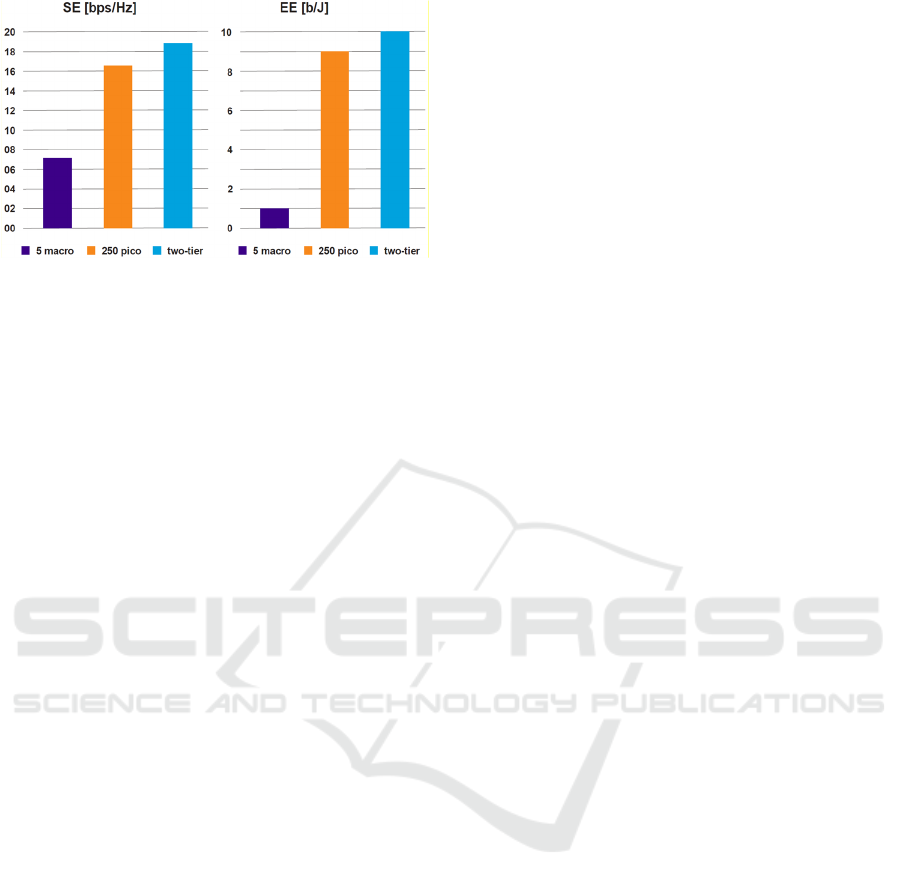
(a) (b)
Figure 5: Simulation results for: a) SE, b) EE.
In both above diagrams, it can be seen that the
two-tier scenario exhibited the most efficient network
performance.
Furthermore, the small-cell scenario (250 pico
BSs) came out to be more efficient than what was
achieved with macro cells (5 BSs), while still
preserving the same count and layout of users.
Finally, considering various transmit power in the
pico tier with the macro-tier transmit power
remaining constant, SE shows growing trend with
respect to the ratio of transmit powers.
4 CONCLUSIONS
Instead of SINR, we proposed the simpler-to-measure
BER as the key performance indicator, by abstracting
the performance degradation due to various
(generally non-AWGN) impairments, by the
according AWGN ones which have the same effect
on BER as any specific distortion.
It came out that inserting small cells into HetNets
of any distribution of BSs, significantly improved
both the energy and spectral efficiency.
So, with smaller distances in between BSs and
UEs of contemporary networks – e.g. LTE and LTE-
A, the trend is rationalization and optimization of
signal coverage by reinforcing it in the areas of
increased traffic.
Such a strategy seems to be appropriate in the
tested exemplar environments, but needs to be
enhanced and fine-tuned with other sophisticated
tests taking into account other impairments e.g.: RF
interference, traffic patterns, bandwidth and channel
allocation etc., whose management is aimed enable
the projected QoS level, complexity reduction, and
fair distribution.
REFERENCES
Parkvall, S., Dahlman, E., Furuskar, A., Jading, Y., Olsson,
M., Wanstedt, S. and Zangi, K., LTE-advanced-
evolving LTE towards IMT-advanced, In IEEE 68th
VTC, 2008, pp. 1–5.
Slamnik, N., Okic, A. and Musovic, J., Conceptual radio
resource management approach in LTE heterogeneous
networks using small cells number variation. In IEEE
XI International Symposium (BIHTEL) 2016; pp. 1-5.
Slamnik, N., Musovic, J., Okic, A., et al., An approach to
analysis of heterogeneous networks’ efficiency, In
XXVI IEEE International Conference ICAT, 2017, pp.
1–5.
Bousia, A., Kartsakli, E., Antonopoulos, A., Alonso, L. and
Verikoukis, C., Energy efficient schemes for base
station management in 4G broadband systems. In
Broadband Wireless Access Networks for 4G: Theory,
Application, and Experimentation, 2014, pp. 100-120,
IGI Global.
Imran, MA., Alonso-Rubio, J., Auer, G., et al., Most
suitable efficiency metrics and utility functions. In
EARTH Project Report, 2011, pp. 1-89.
ETSI TS 102 706 Standard, Environmental engineering
(EE) measurement method for energy efficiency of
wireless access network equipment, V1.2.1, 2011.
Available online: https://etsi.org (Accessed on 30th
January 2021).
ETSI TR 103 117, Environmental engineering (EE);
principles for mobile network level energy efficiency,
v1.1.1, 2012. Available online: https://etsi.org
(Accessed on 30th January 2021).
Mukherjee, S., Analytical modeling of heterogeneous
cellular networks. Cambridge University Press; 2014.
ISBN 978-1-107-05094-5.
Andrews, J.G., Baccelli, F. and Ganti, R.K., A tractable
approach to coverage and rate in cellular networks. In
IEEE Transactions on communications, 59(11), 2011,
pp.3122-3134.
Baccelli, F., Klein, M., Lebourges, M. and Zuyev, S.,
Stochastic geometry and architecture of communication
networks. In Telecommunication Systems, 7(1), 1997,
pp. 209-227.
Baccelli, F. and Błaszczyszyn, B., On a coverage process
yaranging from the Boolean model to the Poisson-
Voronoi tessellation with applications to wireless
communications. In Advances in Applied Probability,
2001, pp. 293-323.
ElSawy, H., Hossain, E. and Haenggi, M., Stochastic
geometry for modeling, analysis, and design of multi-
tier and cognitive cellular wireless networks: A survey.
In IEEE Communications Surveys & Tutorials, 2013,
15(3), pp. 996-1019.
Brown, T.X., Cellular performance bounds via shotgun
cellular systems. In IEEE J. Sel. Areas Commun., 2000,
18(11), pp.2443-2455.
Dhillon, H.S., Ganti, R.K., Baccelli, F. and Andrews, J.G.,
Modeling and analysis of K-tier downlink
heterogeneous cellular networks. In IEEE J. Sel. Areas
Commun., 2012, 30(3), pp.550-560.
BER based Assessment of Spectral and Energy Efficiency in a Two-tier Heterogeneous Network
121

Dhillon, H.S., Ganti, R.K. and Andrews, J.G., Load-aware
modeling and analysis of heterogeneous cellular
networks. In IEEE Trans. Wirel. Commun., 2013,
12(4), pp.1666-1677.
Mukherjee, S., Distribution of downlink SINR in
heterogeneous cellular networks. In IEEE J. Sel. Areas
Commun., 2012, 30(3), pp.575-585.
Madhusudhanan, P., Restrepo, J.G., Liu, Y., et al., Multi-
tier network performance analysis using a shotgun
cellular system. In IEEE GLOBECOM, 2011, pp. 1-6.
Heath, R.W., Kountouris, M. and Bai, T., Modeling
heterogeneous network interference using Poisson
point processes. In IEEE Trans. Signal Process., 2013,
61(16), pp.4114-4126.
Musovic, J., Lipovac, V. and Lipovac, A., Stochastic
Geometry-Based Analysis of Heterogeneous Wireless
Network Spectral, Energy and Deployment Efficiency,
Electronics, vol. 10, no. 7, p. 786, Mar. 2021.
Lipovac, V., Lipovac, A. and Modlic, B., PHY, MAC, and
RLC Layer Based Estimation of Optimal Cyclic Prefix
Length, Sensors, vol. 21, no. 14, p. 4796, Jul. 2021
[Online]. Available: http://dx.doi.org/10.3390/s2114
4796
Rumnay, M., LTE and the Evolution of 4G Wireless;
Design and Measurements Challenges, 2nd edition,
John Wiley & Sons, UK, 2013.
PHOTOPTICS 2022 - 10th International Conference on Photonics, Optics and Laser Technology
122
