
Callus Thickness Determination Adjuvant to Tissue Oximetry
Imaging
Gennadi Saiko
1,2 a
1
Swift Medical Inc., 1 Richmond St. W., Toronto, Canada
2
Ryerson University, Toronto, Canada
Keywords: Diabetic Foot Ulcer, Oximetry, Turbid Tissues.
Abstract: Introduction: Corns and calluses are thickened skin due to repeated friction, pressure, or other irritation.
While in many cases, calluses are harmless, if not removed timely, they may lead to skin ulceration or
infection. Thus, the removal of calluses is an essential part of surgical debridement. Often, healthcare
professionals experience problems with their identification. This study aims to develop an approach for
callus thickness determination using hyperspectral imaging. Methods: Based on the two-layer tissue model
developed by Yudovsky D et al., 2010, we have developed a computationally simple way of extracting the
epithelial thickness from spectral measurements of skin reflection. We have performed a numerical
evaluation of the proposed algorithm: generated the reflectance spectrum using the two-layer model, added
noise, and reconstructed the epidermal thickness L using the proposed method. To evaluate performance,
we have used the following parameters: thickness of the epithelium: 0.1-2mm, dermal blood concentration:
0.2%, 3%, and 7%, blood oxygen saturation: 60%, 80%, and 99%. Results: We have found that the model
reasonably well extracts epidermal thickness L in the 0.1-1.5mm range. Beyond that, the reflectance signal
does not bring information about underlying layers. The most significant factor, which impacts estimation,
is the scattering coefficient of the epidermis. Other factors can be mainly ignored. Conclusions: The
proposed model can be easily implemented in image processing algorithms for hyperspectral/multispectral
imaging systems.
a
https://orcid.org/0000-0002-5697-7609
1 INTRODUCTION
Corns and calluses are thickened skin areas due to
repeated friction, pressure, or other irritation. They
are created by the accumulation of undifferentiated
keratinocytes in the outermost layer of skin. Though
the cells of calluses are dead, they are resistant to
mechanical and chemical impacts due to extensive
networks of cross-linked proteins and hydrophobic
keratin intermediate filaments containing many
disulfide bonds. Calluses are the natural reaction to
irritation of the palmar or plantar skin. Too much
friction occurring too fast for the skin to develop a
protective callus will cause a blister or abrasion
instead.
Several risk factors like foot deformities (e.g.,
bunions, hammertoe) and not wearing socks or
protective gloves facilitate callus formation.
While in many cases, calluses are harmless, if
not removed timely, they may lead to skin ulceration
or infection, which is of particular importance for
patients with diabetes. They can also cause the
patient to try offload the affected painful area,
placing excessive stress on the asymptomatic side.
Thus, the removal of calluses is an essential part
of surgical debridement. However, in many cases,
healthcare professionals experience problems with
their identification. While corns are typically clearly
visible, calluses are often unsightly. Consequently,
some areas of dead skin can be missed during
debridement.
Therefore, a clinical tool that will help identify
suspected areas would be of great clinical utility.
In (Yudovsky, 2010) the authors proposed
estimating blood saturation, melanin content, and
epidermis thickness from spectral diffuse reflectance
measurements. Using Monte Carlo simulations, the
authors solved the radiative transfer equation and
applied an inverse method to retrieve physiological
parameters. However, the technique is suitable
Saiko, G.
Callus Thickness Determination Adjuvant to Tissue Oximetry Imaging.
DOI: 10.5220/0010852400003123
In Proceedings of the 15th International Joint Conference on Biomedical Engineering Systems and Technologies (BIOSTEC 2022) - Volume 2: BIOIMAGING, pages 147-152
ISBN: 978-989-758-552-4; ISSN: 2184-4305
Copyright
c
2022 by SCITEPRESS – Science and Technology Publications, Lda. All rights reserved
147

mainly for a single-point assessment and cannot be
extended to imaging geometry due to computational
complexity.
This problem is closely related to the maximal
detection depth problem discussed analytically
(Saiko, 2012) and using Monte Carlo (Saiko, 2014).
This study aims to develop an approach for
callus thickness determination using hyperspectral or
multispectral imaging
2 METHODS
2.1 Tissue Model
The skin is a multi-layer structure. Typically, it is
subdivided into three primary layers: epidermis,
dermis, and subcutaneous tissue. However, each of
these layers can be split into several respective sub-
layers.
However, considering the spectrum's visible
range, the light penetration depth does not exceed
2mm, and subcutaneous tissue does not contribute
much to the reflectance. Thus, in this case, we can
consider the skin as a two-layer structure: the
bloodless epidermis and underlying, blood-
containing tissue, which has optical properties of the
dermis.
We will approximate the epidermis as a slab of
thickness L
1
. In the normal case, the epidermis is not
more than 100-120μm thick; however, it can be
several millimeters thick in the callus. Such as light
does not penetrate more than 2mm into the dermis;
we can approximate it as a semi-infinite layer.
2.2 Optical Tissue Model
Thus, we can model the skin as a two-layer
structure, where a slab with optical parameters (
μ
a1
,
μ
'
s1
) and thickness L
1
covers a semi-space with
optical parameters (
μ
a2
,
μ
'
s2
). Here and after that,
indexes 0, 1, and 2 refer to the air, epidermal, and
underlying tissues, respectively. Thus, our ultimate
goal will be to find L
1
from optical measurements.
In (Yudovsky, 2009) the authors investigated
such model using a two-flux Kubelka-Munk
approach with mismatched external boundary and
matched interlayer interface and found that the
reflectance of such a two-layer model can be
expressed as
11 1 2 1 2
((,) (,)) (,)R RRn Rn Rn
ωω ω
−− −
′
=−+
(1)
Here R
_
(n,
ω
) is the reflectance of the semi space
with the index of refraction n and reduced albedo
ω
(
''
/( )
s
sa
ω
μμμ
=+
), and R' is the "reduced
reflectance," which varies in the range from 0 to 1.
The reflectance of the semi space with
mismatches boundary can be written as (Saunderson,
1942)
01 10
01
10
(1 )(1 )
1
d
d
rrR
Rr
rR
−
−−
=+
−
(2)
Here r
01
is the specular reflectance for the light
coming from air to the tissue, r
10
is the specular
reflectance of the light coming from the tissue into
the air, R
d
is the diffuse reflectance of the tissue. The
diffuse reflectance of the semi space with optical
properties (
μ
a
,
μ
'
s
) can be found using the Kubelka-
Munk (K-M) model
2
1
d
Ra a=− −
(3)
Where
()/aSKS=+
. In (van Gemert, 1987),
the authors expressed K-M absorption and scattering
coefficients K and S through μ
a
and μ'
s
.
While the reduced reflectance R' can be found
analytically, a semi-empirical approach (Yudovsky,
2009) with fitting parameter a gives more accurate
predictions of tissue reflectance
1
1
tanh(Y )
1/ (1 1/ )tanh(Y )
R
αα
′
=
+−
(4)
Here
'
1111
Y( )
as
L
ζμ μ
=+
(5)
where
ζ
is the root of the characteristic equation
1
2
ln((1 ) / (1 ))
ζ
ω
ζζ
=
+−
(6)
2.3 Physiological Considerations
In the general case, the skin contains melanin
located in the bottom, basal layer of the epidermis.
However, there are two considerations why we can
ignore its impact in the case of callus. Firstly,
calluses are mainly located on plantar surfaces (sole
and palm), which are melanin-free. Secondly, for
other body locations, one can expect that the skin's
normal processes are disrupted, so most likely, the
skin will not form melanin protection in the case of
the callus/corn. Thus, we can ignore melanin, which
significantly simplifies our calculations.
BIOIMAGING 2022 - 9th International Conference on Bioimaging
148

In this case, we have the epidermal slab with
quite universal optical characteristics, which are not
affected by a skin type, and thus, should have low
interpatient variability. So, we can tabulate its
optical properties (
μ
a1
,
μ
'
s1
).
The optical properties of the dermis are a little
bit more tricky case. In the spectrum's visible range,
they will be affected by blood, namely its
concentration and composition (oxygenation). For
the normal dermis, blood concentration is typically
considered to be close to 3%. However, a callus may
hide blood pools in some cases, where the blood
concentration will be obviously higher. Furthermore,
oxygenation of the blood varies from 97-99% for the
arterial blood up to 60% for the venous blood. In the
general case, the light samples both arterial and
venous compartments, so the measured SO2 is
somewhere between these values. However, to test
the method, it is better to check the whole range.
2.4 Algorithm
The method can be described as the following:
1. Measure R at several wavelengths
2. Tabulate parameters (
μ
a1
,
μ
'
s1
) and seed
realistic n,
α
and (
μ
a2
,
μ
'
s2
), e.g., healthy tissue
3. Calculate R
d
(
ω
1
) and R
d
(ω
2
) using the K-M
model (Eq.3)
4. Calculate R_(n
, ω
1
) and R_( n
, ω
2
) using Eq.2
5. Calculate R':
2
12
(, )
'
(, ) (, )
RRn
R
Rn Rn
ω
ωω
−
−−
−
=
−
6. Calculate Y
1
by solving Eq.4
7. Using tabulated values (
μ
a1
,
μ
'
s1
) and
ζ
from
Eq.6, find L
1
using Eq.5.
8. Update Y
1
, and recalculate R.'
9. Calculate R
2
:
1
2
'
1'
RRR
R
R
−
=
−
10. Calculate R
d2
by reversing Eq.2
11. Calculate K and S and then update (
μ
a2
,
μ
'
s2
)
12. Repeat steps 3-11 with updated (
μ
a2
,
μ
'
s2
) if
required
2.5 Parameters
2.5.1 Absorption
In the absence of melanin, the epidermis absorption
can be modeled as the background absorption of
human flesh (Jacques, 1996):
1,aafl
μμ
=
,
where
7 3.255
,
7.84 10
afl
μλ
−
=×
[mm
-1
]. Here, the wavelength
λ is measured in [nm].
The absorption of the dermis can be modeled as
a combination of background-, oxyhemoglobin-, and
deoxyhemoglobin related absorption
2,
,2 ,
(1 )
(2* (1 2)* )
aafl
aHbO aRHb
c
cSO SO
μμ
μμ
=− +
++−
(7)
Here c is the blood concentration in the dermis,
SO2 is the oxygen blood saturation, HbO2 and RHb
refer to oxyhemoglobin and deoxyhemoglobin,
respectively. Absorption coefficients for
oxyhemoglobin- and deoxyhemoglobin are well
known (Prahl, 2002). Blood typically occupies
around 0.2-0.6% of the physical volume of the
dermis (Lister, 2012). However, other groups report
much higher values: up to 7% (Jacques, 1996).
2.5.2 Scattering
The reduced scattering coefficient for dermis and
epidermis also follows a power law (Mourant,
1998):
'
k
s
μ
λ
−
∝
, with k=1.3. Therefore, we can
set a reference value at a particular wavelength and
simulate its dependence on the wavelength with this
power law. In particular, we can assign values at
633nm (Meglinski, 2002) for the living epidermis
(
μ
'
s
=9mm
-1
) and reticular dermis (
μ
'
s
=5mm
-1
), which
represent the bulk of the tissue in healthy epidermis
and dermis, respectively. However, for callus
assessment, we can expect that the bulk of the callus
is similar to the stratum corneum (
μ
'
s
=14mm
-1
).
Thus, we can write
41.3
1
'6.110
s
μ
λ
−
=×
and
41.3
2
'2.210
s
μ
λ
−
=×
, respectively.
2.5.3 Index of Refraction
The index of refraction measurements in the human
skin was summarized in (Bashkatov, 2011). The
measurements in the visible spectrum range give
their values from 1.433 to 1.449 for the epidermis
(Ding, 2006). In particular, we can set 1.448, 1.447,
and 1.433 for 442, 532, and 633nm, respectively.
The dermis contains more water. Thus, its index of
refraction is slightly (typically by 0.01-0.05 (Ding,
2006)) less, which will result in almost negligible
scattering on the dermis/epidermis interface (<<1%).
Thus, we will ignore this difference and set n
2
=n
1
.
2.5.4 Noise
To make our synthetic spectrum more realistic, we
have added noise to the simulated spectra. If we
consider a consumer-grade camera with an 8-bit
Callus Thickness Determination Adjuvant to Tissue Oximetry Imaging
149
depth, we can estimate that the measurement's
experimental error for this camera is
8
1/ (2 1) 0.004−≈
. Based on these assumptions, the
realistic noise is
σ
=0.001. However, we have added
Gaussian noise with
μ
=0 and
σ
=0.004.
2.6 Test Scenarios
Four optical parameters (
μ
a1
,
μ
'
s1
,
μ
a2
,
μ
'
s2
) can
characterize the two-layer K-M model. These
parameters can be further described by five tissue
parameters: power-law values for (
μ
a1
,
μ
'
s1
,
μ
'
s2
),
blood concentration c, and blood oxygenation, SO2.
The most uncertain parameters in the experiment
are the scattering coefficient of the epithelium
(
μ
'
s
=9mm
-1
or 14mm
-1
for living epidermis and
stratum corneum, respectively), blood concentration
in the dermis, c (0.2-7%), and blood oxygen
saturation, SO2 (60-99%).
We will keep other parameters (
μ
a1
,
μ
'
s2
) fixed:
7 3.255
1
7.84 10
a
μλ
−
=×
and
41.3
2
'2.210
s
μ
λ
−
=×
,
respectively.
2.6.1 Seed Parameters
We have seeded the algorithm with the following
parameters: scattering coefficient of the epithelium'
μ
'
s1
=14mm
-1
(stratum corneum), blood concentration
in the dermis, c =3%, and blood oxygen saturation
SO2=80%.
2.6.2 Test Parameters
We have selected the following values to evaluate
the model: the scattering coefficient of the
epithelium
μ
'
s1
=9mm
-1
and 14mm
-1
. Blood
concentration: 0.2%, 3%, and 7%. Oxygen
saturation: 60%, 80%, and 99%.
The epithelium's thickness, L
1,
was 100, 200,
400, 600, 800, 1000, 1500μm.
3 RESULTS
We have performed a numerical evaluation of the
proposed algorithm. For these purposes, we
generated the reflectance spectrum using the two-
layer model (Eq.1), added noise and reconstructed
the thickness L
1
using steps 2-7.
We sampled reflectance at 470, 540, and 630 nm
to measure epidermal thickness, processed them
using the algorithm, extracted L
1
for each
wavelength, and averaged them to get a single value
L
1
. To calculate statistical values (mean and standard
deviation), we repeated them five times for each
thickness for each parameter set.
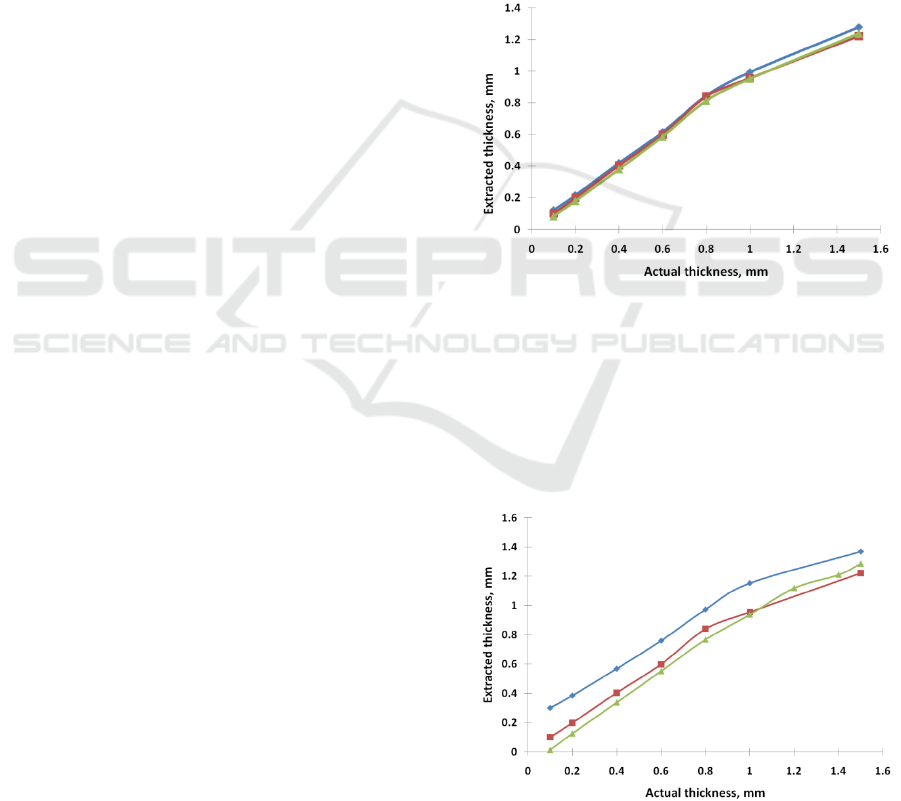
3.1 Dependence on Oxygenation
The dependence of the extracted thickness as a
function of the actual thickness for various blood
oxygenations (60, 80, 99%) is depicted in Fig. 1.
Other test parameters were as following
scattering coefficient of the epithelium 14mm
-1
,
blood concentration: 3%.
It can be seen that the oxygenation barely
impacts the results.
Figure 1: The extracted thickness as a function of the actual
thickness for various SO2 (60 (green triangle), 80 (red
square), and 99 (blue rhomb) %).
μ
'
s1
=14mm
-1
, c= 3%.
3.2 Dependence on Blood Content
The dependence of the extracted thickness as a
function of the actual thickness for various blood
concentrations (0.2, 3.0, and 7.0 %) is depicted in
Figure 2: The extracted thickness as a function of the
actual thickness for various blood concentrations (0.2
(blue rhomb), 3.0 (red square), and 7.0 (green triangle) %).
μ
'
s1
=14mm
-1
, SO2= 80%.
BIOIMAGING 2022 - 9th International Conference on Bioimaging
150
Fig. 2. Other test parameters were as following
scattering coefficient of the epithelium 14mm
-1
,
blood oxygenation: 80%.
3.3 Dependence on Scattering
Coefficient
The dependence of the extracted thickness as a
function of the actual thickness for various scattering
coefficients of the epithelium (14mm
-1
and 9mm
-1
) is
depicted in Fig. 3.
Other test parameters were as following
blood concentration: 3%., blood oxygenation: 80%.
Figure 3: The dependence of the extracted thickness as a
function of the actual thickness for various scattering
coefficients of the epithelium (14mm
-1
(blue rhomb) and
9mm
-1
(red square)). c=3%, SO2= 80%.).
3.4 Maximal Detected Thickness
To detect the maximal thickness, which can be
identified by our method, we have performed
emulation of reflectance spectra for tissues with
maximal blood content (7%). In this case, we can
expect that the impact of the underlying layer will be
maximal.
Figure 4: The dependence of the extracted thickness as a
function of the actual thickness for maximal blood
concentrations (c= 7.0 %).
μ
'
s1
=14mm
-1
, SO2= 80%.
The dependence of the extracted thickness as a
function of the actual thickness for maximal blood
concentrations (c= 7.0 %) is depicted in Fig. 4.
Other test parameters were as following: scattering
coefficient of the epithelium 14mm
-1
, blood
oxygenation: 80%.
4 DISCUSSION
We have found that the model reasonably well
extracts epidermal thickness L for the range of
thicknesses 0.1-1.5mm. Beyond that, the reflectance
signal does not bring information about underlying
layers. In this case, the epidermis can be viewed as a
semi-infinite layer.
We have found that SO2 barely impacts results.
So, in realistic scenarios, it can be ignored.
Blood content slightly impacts results.
Underestimation of the blood content pushes the
graph up (overestimates the thickness slightly).
Overestimation of the blood content pulls the curve
down (underestimate the thickness slightly).
However, its effect for L>0.4mm is relatively small
and can be discarded for estimation purposes. For
L<0.3mm, the error can be >40%. However, it
should be noted that our lower case scenario (0.2%)
is significantly smaller than our seed value (3%). In
realistic settings, it could be expected that the seed
value could be selected closer to actual values, so its
effect can be ignored.
The most significant factor, which impacts
estimation, is the scattering coefficient of the
epidermis. 30% error in evaluating the scattering
coefficient (9mm
-1
instead of 14mm
-1
) leads to a
significant underestimation of the thickness. It
should be noted that for 0.1-0.8mm thickness, it can
be corrected using the optical path:
1_ 1_
''
actual s actual perceived s seed
LL
μμ
≈
However, in
realistic conditions, one can expect that the callus
consists of dead cells primarily, so it should not be
an issue. However, this strong dependence
underscores the importance of using realistic
numbers.
The obtained maximal detection depth
estimation agrees with the assessment of maximal
defect detection depth developed in (Saiko, 2021)
and elaborated in (Saiko, 2022a).
Speaking of the extension of the model to other
scenarios, it should be mentioned that we excluded
melanin from our model (see Section 2.3 for details).
In most other cases it cannot be ignored. If
Callus Thickness Determination Adjuvant to Tissue Oximetry Imaging
151

necessary, the melanin can be accounted for by a
quasi-two layer model (Saiko, 2022b).
In the future, we plan to validate this approach in
phantom experiments.
5 CONCLUSIONS
We have proposed an approach for optical callus
thickness determination. Numerical simulations
show that it can accurately detect epidermis
thickness up to 1.5mm. Due to its computational
simplicity, it can be easily implemented in image
processing algorithms for multispectral and
hyperspectral imaging systems
REFERENCES
Yudovsky D, Pilon L, 2010, Rapid and accurate
estimation of blood saturation, melanin content, and
epidermis thickness from spectral diffuse reflectance.,
Appl Opt. 49(10):1707-19.
Saiko G, Douplik A, 2012, Real-Time Optical Monitoring
of Capillary Grid Spatial Pattern in Epithelium by
Spatially Resolved Diffuse Reflectance Probe, J.
Innov. Opt. Health Scie. 05 (02): 1250005.
Saiko G, Pandya A, Schelkanova I, Sturmer M, Beckert
RJ, Douplik A, 2014, Optical Detection of a Capillary
Grid Spatial Pattern in Epithelium by Spatially
Resolved Diffuse Reflectance Probe: Monte Carlo
Verification, IEEE J Sel. Top. Quant Electronics,
20(2): 7000609
Yudovsky D, Pilon L, 2009, Simple and accurate
expressions for diffuse reflectance of semi-infinite and
two-layer absorbing and scattering media. Appl Opt.;
48(35):6670-83.
Saunderson JL, 1942, Calculation of the color of
pigmented plastics, J Opt Soc Amer, 32(12):727–736.
Van Gemert MJC, Star WM, 1987, Relations between the
Kubelka-Munk and the transport equation models for
anisotropic scattering, Lasers Life Scie, 1(98): 287–
298.
Jacques SL, Origins of tissue optical properties in the
UVA, visible, and NIR regions, in Advances in
Optical Imaging and Photon Migration, R. R. Alfano
and J. G. Fujimoto, eds. (Optical Society of America,
1996), Vol. 2, pp. 364–370
Prahl S, Optical absorption of hemoglobin, World Wide
Web: http://omlc.ogi.edu/spectra/hemoglobin/
hemestruct/ index.html, 2002.
Lister T, Wright PA, Chappell PH, 2012, Optical
properties of human skin, JBO 17(9): 090901
Mourant JR, Freyer JP, Hielscher AH, Eick AA, Shen D,
Johnson TM, 1998, Mechanisms of light scattering
from biological cells relevant to noninvasive optical-
tissue diagnostics, Appl Opt, 37(16): 3586–3593.
Meglinski IV, Matcher SJ, 2002, Quantitative assessment
of skin layers absorption and skin reflectance spectra
simulation in the visible and near-infrared spectral
regions, Physiol. Meas. 23, 741-753.
Bashkatov AN, Genina EA, Tuchin VN, 2011, Optical
properties of skin, subcutaneous, and muscle tissues:
A review, J. Innov Opt Health Scie 4(1): 9-38.
Ding H, Lu JQ, Wooden WA, Kragel PJ, Hu X-H, 2006,
Refractive indices of human skin tissues at eight
wavelengths and estimated dispersion relations
between 300 and 1600 nm, Phys. Med. Biol. 51, 1479-
1489.
Saiko G, Douplik A, Contrast Ratio during Visualization
of Subsurface Optical Inhomogeneities in Turbid
Tissues: Perturbation Analysis. In Proc of the 14th Int
Joint Conf on Biomed Eng Systems and Technologies
(BIOSTEC 2021) - v 2: BIOIMAGING, 94-102, DOI:
10.5220/0010374100940102
Saiko G, Douplik A, Visibility of capillaries in turbid
tissues: an analytical approach, SN Comp. Scie
(submitted)
Saiko G, Improved optical tissue model for tissue
oximetry imaging applications, Adv Exp Med Biol
(submitted)
BIOIMAGING 2022 - 9th International Conference on Bioimaging
152
