
Feature-level Approach for the Evaluation of Text Classification Models
Vanessa Bracamonte, Seira Hidano, Toru Nakamura and Shinsaku Kiyomoto
KDDI Research, Inc., Saitama, Japan
Keywords:
Feature Importance Visualization, Text Classification Models, Model Evaluation, Case Studies.
Abstract:
Visualization of explanations of text classification models is important for their evaluation. The evaluation of
these models is mostly based on visualization techniques that apply to a datapoint level. Although a feature-
level evaluation is possible with current visualization libraries, existing approaches do not yet implement ways
for an evaluator to visualize how a text classification model behaves for features of interest for the whole data
or a subset of it. In this paper, we describe and evaluate a simple feature-level approach that leverages existing
interpretability methods and visualization techniques to provide evaluators information on the importance
of specific features in the behavior of a text classification model. We conduct case studies of two types of
text classification models: a movie review sentiment classification model and a comment toxicity model.
The results show that a feature-level explanation visualization approach can help identify problems with the
models.
1 INTRODUCTION
The use of machine learning models for text classi-
fication has increased in recent years. Text classifi-
cation models can be used to predict the sentiment
of movie reviews and the toxicity of user comments,
for example. These models can show high accuracy
when they are evaluated, but they can nevertheless
have specific problems. In one real life example, a
model for predicting the toxicity of user comments
(Jigsaw, 2018) assigned a higher toxicity score to
neutral comments when they included words such as
“black,” “woman” or “gay” (Jessamyn, 2017). The
problem was discovered by an independent evaluator,
and it led to efforts to improve these models (Dixon
et al., 2018).
Different types of users need to evaluate the per-
formance of a model, and a number of tools have been
developed to address this need. There are evaluation
tools that can work with multiple types of models and
data (Zhang et al., 2019; Wexler et al., 2020). Spe-
cific tools for the evaluation of NLP models and text
data have also been developed (Tenney et al., 2020;
Hoover et al., 2020). The visualization techniques
used in these tools allow the evaluator to locate and in-
spect individual datapoints, and to review the predic-
tion results of a model. NLP model evaluation tools
such as LIT (Tenney et al., 2020) can also leverage
model interpretability methods (e.g local gradients (Li
et al., 2016) and LIME (Ribeiro et al., 2016)) to pro-
vide visualization of the importance of features to the
prediction of a datapoint.
The objective of these visualization approaches is
to provide information to the evaluator that will help
them decide whether the model is performing well or
if it has problems. However, evaluation of individ-
ual datapoints or instances and their prediction out-
comes provides only a partial view of the behavior
of the model. In particular for text data, identifying
if there are patterns of problems related to specific
features becomes difficult with datapoint-level eval-
uation approaches. In models for image data, similar
features in a group of individual datapoints may re-
veal a pattern (Liu et al., 2019; Chen et al., 2021). For
example, if incorrect predictions of an image classifi-
cation model share a predominant color, then it may
indicate that the model behaves incorrectly for images
of that color. On the other hand, the complexity of
dealing with text data is such that there are not only a
great number of features, but that these features have
semantic meaning, meaning in context and relation-
ships within text. For text, these complexities have to
be taken into consideration (Rohrdantz et al., 2012;
Stoffel et al., 2015). Therefore, patterns such as the
ones identified in groups of images cannot be easily
identified from groups of text datapoints. It would
be difficult for an evaluator to know whether a model
behavior problem with a feature identified in one dat-
apoint exists as a general pattern for the model.
164
Bracamonte, V., Hidano, S., Nakamura, T. and Kiyomoto, S.
Feature-level Approach for the Evaluation of Text Classification Models.
DOI: 10.5220/0010846900003124
In Proceedings of the 17th International Joint Conference on Computer Vision, Imaging and Computer Graphics Theory and Applications (VISIGRAPP 2022) - Volume 3: IVAPP, pages
164-170
ISBN: 978-989-758-555-5; ISSN: 2184-4321
Copyright
c
2022 by SCITEPRESS – Science and Technology Publications, Lda. All rights reserved

A complementary approach, that allows an evalu-
ator to center the exploration on features of interest,
could provide additional information to identify such
patterns. We define this feature-level approach as one
that centers on features as opposed to datapoints, but
also considers the context of those features. In this pa-
per, we describe and evaluate such an approach. We
developed a prototype for testing the approach and
conducted two case studies: an evaluation of a movie
review sentiment classification model, and a compar-
ison of two toxic comment classification models. The
results indicate that a feature-level visualization ap-
proach could be a useful complementary approach to
help identify problems in text classification models.
2 RELATED WORK
Current tools and libraries for machine learning mod-
els exploration and evaluation make use of a num-
ber of datapoint-level (also known as instance-level
or instance-centric) visualization approaches (Yuan
et al., 2021). This includes, for example, visualiza-
tion of individual datapoints (image, tabular or text
data), features in the datapoint and prediction results.
It also includes model performance metrics visualiza-
tion such as confusion matrices and plotting of predic-
tion results. There are a number of existing tools for
exploring machine learning models that implement
this approach. For text data, one example is the What-
If tool (Wexler et al., 2020), a model evaluation tool
that can be used for exploring different types of mod-
els and data. It provides functions to apply these visu-
alizations to a subset of the evaluation data, through
filtering by labels such as the output and by features,
and the results are visualized at the datapoint level.
Techniques for visualizing explanations of predic-
tions of models for text are also applied at the dat-
apoint level. LIT (Tenney et al., 2020) is an explo-
ration tool specifically for NLP models. The tool pro-
vides some functions to search for words in a text,
but the visualization of results is provided at the dat-
apoint level. It provides salience map visualization
functions to represent feature importance in a data-
point, calculated using interpretability methods such
as LIME (Ribeiro et al., 2016) and local gradients
(Li et al., 2016). Salience maps are one of the most
frequently used visualization for the results of inter-
pretability methods. In the application of this visual-
ization technique for text, the features of a datapoint
are highlighted in different opacity to indicate the im-
portance of features for the predicted result, and/or
different colors to indicate the prediction class. This
type of visualization is included in most interpretabil-
ity method libraries that handle text data models such
as LIME (Ribeiro et al., 2016), SHAP (Lundberg and
Lee, 2017) and Interpret-Text (InterpretML, 2021). In
addition to the salience map, the most important fea-
tures in a datapoint are sometimes visualized as a bar
chart (Ribeiro et al., 2016), or a force plot (Lundberg
and Lee, 2017).
The type of data affects the usefulness of the data-
point level visualization for finding patterns of error
in the model which are related to features. In im-
age data, the information can be processed by compo-
nents (Biederman, 1987), and the evaluator can iden-
tify, for example, the subjects and objects in the im-
age, their characteristics, or the predominant colors
of the image. This characteristic of image data has
been useful to identify, for example, if the errors of a
machine learning model are biased towards people of
color (Barraza et al., 2019): if the majority of erro-
neously classified photos in an image classifier corre-
sponded to dark skin subjects, then visualizing the im-
ages in a group would reveal this pattern. A number
of tools make take advantage of image pattern iden-
tification. LabelInspect (Liu et al., 2019) provides a
function to visualize images where a model prediction
was different from the assigned label, and the evalua-
tor could distinguish a problem at a glance. OoDAna-
lyzer (Chen et al., 2021) identifies out-of-distribution
samples and provides a visualization of the group of
images. In the case study evaluation, an evaluator
could identify a ”light-colored dogs and dark-colored
cats” pattern in the misclassifications.
It may be easy for an evaluator to gather some
idea of potential problems from glancing at an im-
age or a group of images. However, an equivalent
task would be much more difficult in the case of text,
where patterns cannot be distinguished at a glance.
For the same reason, side-by-side comparison visual-
ization of two or more prediction explanations may be
more effective for image data. It would be difficult for
the evaluator to find differences at a glance with this
type of visualization for text, in particular for longer
documents.
There are tools that center the model exploration
on features or provide functions for feature-level ex-
ploration in addition to datapoint-level. For example,
Prospector (Krause et al., 2016) allows interactive di-
agnostic of the impact of features on predictions, for
tabular data. There are also proposals for feature-
level visualization for text data. The Text Classifi-
cation Analysis Process proposes examining feature
rankings for text classification with the use of word
clouds (Stoffel et al., 2015). FeatureInsight (Brooks
et al., 2015) focuses the visualization on features from
misclassified texts to support the identification of new
Feature-level Approach for the Evaluation of Text Classification Models
165

feature. The tool uses a list style of visualization
to reduce cognitive load, but this approach loses the
context of the feature. The approach by the Man-
ifold tool (Zhang et al., 2019) is the closest to our
proposal. The tool provides functions for visualizing
feature distributions and feature-wise comparison for
text data. However, it does not provide visualization
of explanations from interpretability methods. In ad-
dition, feature lists are created based on frequency but
it does not provide functions to flexibly explore fea-
tures that are not in the top list.
3 FEATURE-LEVEL
VISUALIZATION APPROACH
Feature-level visualization of explanations could pro-
vide the evaluator of a text classification model with
information that would help them understand if there
are patterns in the errors of a model which are related
to a feature of interest. For this purpose, the evaluator
would need (1) to find features of interest in the data,
(2) to know the context of each occurrence of that fea-
ture, and (3) to inspect how the model behaves with
respect to that feature.
We illustrate these needs with an example. An
evaluator might be interested in knowing if a model
that predicts the toxicity of a user comment is pre-
dicting a higher toxicity score when the text con-
tains words related to race, gender or disabilities (Jes-
samyn, 2017). The evaluator would then need to
know the context of a feature when the feature (word)
has multiple meanings. The process requires the eval-
uator to review the text in order to distinguish the
meaning of a word. For example, an evaluator may be
interested in instances where the word “black” is used
to refer to a person, but they may not be interested
in instances where the word has a different meaning,
such as for example in the phrase “black humor.”
Feature-level visualization could be a way to com-
plement current evaluation approaches to address the
needs described. The approach we propose is simple,
and relies on a combination of existing techniques for
text visualization.
Top Features in the Data or in a Subset of the Data.
To visualize the most important features in a subset
or the whole data. Unlike the list top features in in-
dividual datapoints that is provided in the visualiza-
tion of the result of interpretability methods such as
LIME (Ribeiro et al., 2016), a dataset-wide list could
provide the evaluator with a better perspective of the
model behavior.
Feature Importance Plots. One way to visualize the
importance of a feature of interest in multiple data-
points could be through scatter plots. This type of plot
could work to show the importance score of a feature
of interest in the whole dataset, or in a subset of it.
Feature-wise Comparison. Feature importance plots
could be paired with a comparison function, that
would allow to visualize the importance of multiple
features of interest in the data. This type of function
would allow the evaluator to compare, for example,
how a model behaves for the words “woman” and
“man” (or any other contrastive pair of features), in
the texts that contain these words.
Keyword-in-Context Visualization. Information re-
trieval techniques such as concordance and keyword-
in-context (KWIC) visualization (Fischer, 1966) are
specifically designed for the purpose of finding and
visualizing text in context. These techniques can help
the evaluator review the context of the feature of in-
terest.
4 EVALUATION
In this section, we present the results of two case stud-
ies used to evaluate the proposed feature-level visual-
ization approach. We first describe the prototype de-
veloped for conducting the case study evaluations.
4.1 Prototype
We developed a prototype to test the proposed ap-
proach. We implemented the following feature-level
functions: a feature search with filters, top features in
the search results, KWIC data list to view the search
results and a feature importance scatter plot with com-
parison options. The data inputs are (a) a labeled
dataset of text data (evaluation data), (b) the predic-
tion results from the model being evaluated (model re-
sults), (c) all features of the dataset, and (d) the impor-
tance scores corresponding to those features, which
are a result of the interpretability method used. The
data was pre-process as follows: the evaluation data
was tokenized to obtain the features that would be the
input to the text classification model. A text classi-
fication model was used to obtain prediction results
with the tokenized data (features) as input. Similarly,
the selected interpretability method was used to gen-
erate explanations (importance scores for each fea-
ture) of the text classification model predictions, us-
ing the same tokenized data. The detail of the data,
model(s) and interpretability method used in the eval-
uation is described in each case study. Figure 1 shows
the overview of the prototype.
The scatter plot was complemented by summary
information of the feature importance scores. We
IVAPP 2022 - 13th International Conference on Information Visualization Theory and Applications
166

Tes t data
(Text)
Features
Importance
scores
Prediction
results
ML model
Interpretability
method
Input Data Prototype
Search
Top explanation
features
🔍
KWIC List
Feature importance
scatter plot
Figure 1: Prototype overview.
also implemented visualization of model performance
metrics, salience in the form of text highlights and
comparison between models.
The required data for the case studies was pro-
cessed beforehand: (a) the labeled dataset of text data
(evaluation data), (b) model prediction results, (c) fea-
tures and their importance scores. The approach is
agnostic with regards to how the feature importance
scores are calculated. Therefore, they can be calcu-
lated in different ways, for example with post hoc in-
terpretability methods. For the case studies, we calcu-
lated SHAP importance scores, using the method by
Chen et al. (Chen et al., 2019).
4.2 Movie Review Sentiment
Classification Case Study
In this case study, we evaluated a sentiment classifi-
cation model. The objective of the evaluation was to
identify whether there is bias in the model, in partic-
ular related to gender.
4.2.1 Setup
For this case study, we trained a CNN model to pre-
dict the sentiment of a movie review. The model was
a CNN Keras model trained and tested on the Large
Movie Review dataset (Maas et al., 2011). The CNN
model had an accuracy of 88.9%. We did not fine-
tune the model or develop it to be intentionally “bad”
in any particular sense. We also did not know if the
models had problems beyond what we could gather
from the accuracy metrics. Since the focus was gen-
der bias, we used a subset of movie reviews that con-
tained gender-related words as the evaluation data.
4.2.2 Model Evaluation
We found different problems with the model with re-
spect to gender, but here we focus on one case. The
model accuracy for the evaluation data was 93.98%,
but the word “women” appeared as a top negative fea-
ture in the overview (Figure 3). We searched for the
word women to inspect its behavior in the model. The
feature importance scatter plot showed that the ma-
jority of occurrences of this feature contributed to a
negative classification.
Figure 4 shows the plot, the importance score of
the word women is indicated in orange. We then
compared the word women with the word men, to
investigate if there were any differences. The plots
showed a difference in how the model handled the dif-
ferent gender-related features, in particular when we
included only false negative results (Figure 4).
In addition, the KWIC result list showed that the
context for the use of the word women was not always
negative for this subset of the data (Figure 2).
From these results we observe that the model
could exhibit problems when the review includes the
word women. We conducted a simple test of this re-
sult by replacing the word in a short text (”It was inter-
esting to see the people in the movie react to the ongo-
ing crisis”). When the word people was replaced with
the word women, the output of the model changed
from positive to negative.
4.3 Comment Toxicity Classification
Case Study
We evaluated two models used to categorize the level
of toxicity in social media comments, focusing on
words related to identity.
4.3.1 Setup
The models we evaluated were pre-trained Keras
models developed by ConversationAI (Conversation
AI, 2020) as part of a project to help identify unin-
tended bias in text classification models. The differ-
ence between the models is that one has been trained
with unbiased data based on race, gender and other
identities; we use the names original and debiased to
refer to these models. The details of how the models
were trained and on which data are found in (Conver-
sation AI, 2020). We used a subset of comments in
the Wikipedia Talk Labels: Toxicity Dataset (Thain
et al., 2017), which consists of user comments from
Wikipedia (English version, labeled as toxic or non-
toxic, as the evaluation data. The subset contained
words related to identities.
4.3.2 Model Evaluation
We started by exploring the model results on differ-
ent filter conditions. Filtering out low character count
comments resulted in the word gay appearing as a top
toxic feature. We searched for that word to view how
Feature-level Approach for the Evaluation of Text Classification Models
167
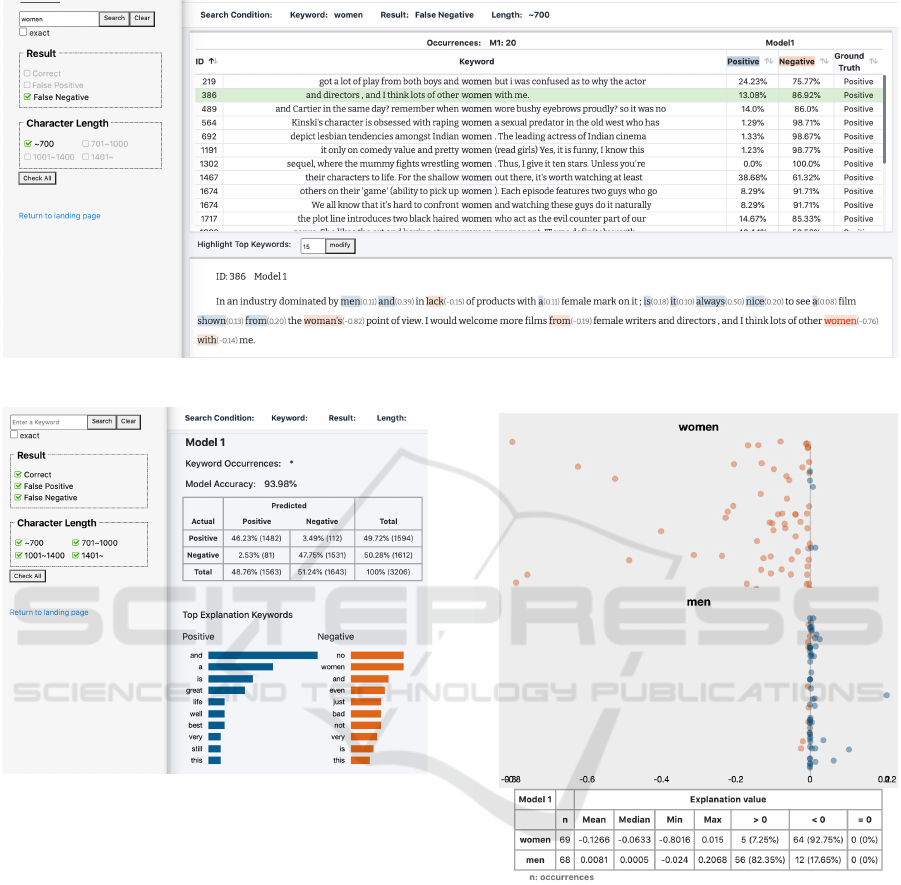
Figure 2: Movie review sentiment classification case study: Concordance list view of results that include the word “women”.
Figure 3: Movie review sentiment classification case study:
Model performance and top explanation features for the
dataset. Accuracy is high, but the word “women” appears
as a top negative feature.
the two models handled it. The overview of the search
results (Figure 5) showed that the word appeared as a
top feature for both models and that the models had a
similar performance for that subset of data.
On the other hand, the feature importance scatter
plot showed that the scores were more dispersed in
the original model compared to the debiased model.
For the original model, the plot showed that the word
gay contributes more often to a toxic score than in
the debiased model, where the scores are closer to the
neutral point. Figure 6 shows this result, where the
toxic scores are indicated in blue. This result visual-
izes that the model on the right (debiased, Figure 6)
was debiased on the word gay compared to the origi-
nal toxicity model.
Figure 4: Movie review sentiment classification case study:
Plot of importance scores for “women” compared to “men”
in false negative prediction results.
4.4 Limitations
As mentioned before, a feature-level visualization
approach to model evaluation would necessarily be
complementary to other techniques, and not meant to
be the only approach. In addition, there are the fol-
lowing limitations. First, to be able to visualize any
feature in all datapoints the implementation requires
that the explanations are generated at the initializa-
tion point or beforehand. Second, as with most visu-
alization techniques for text classification, we focused
IVAPP 2022 - 13th International Conference on Information Visualization Theory and Applications
168
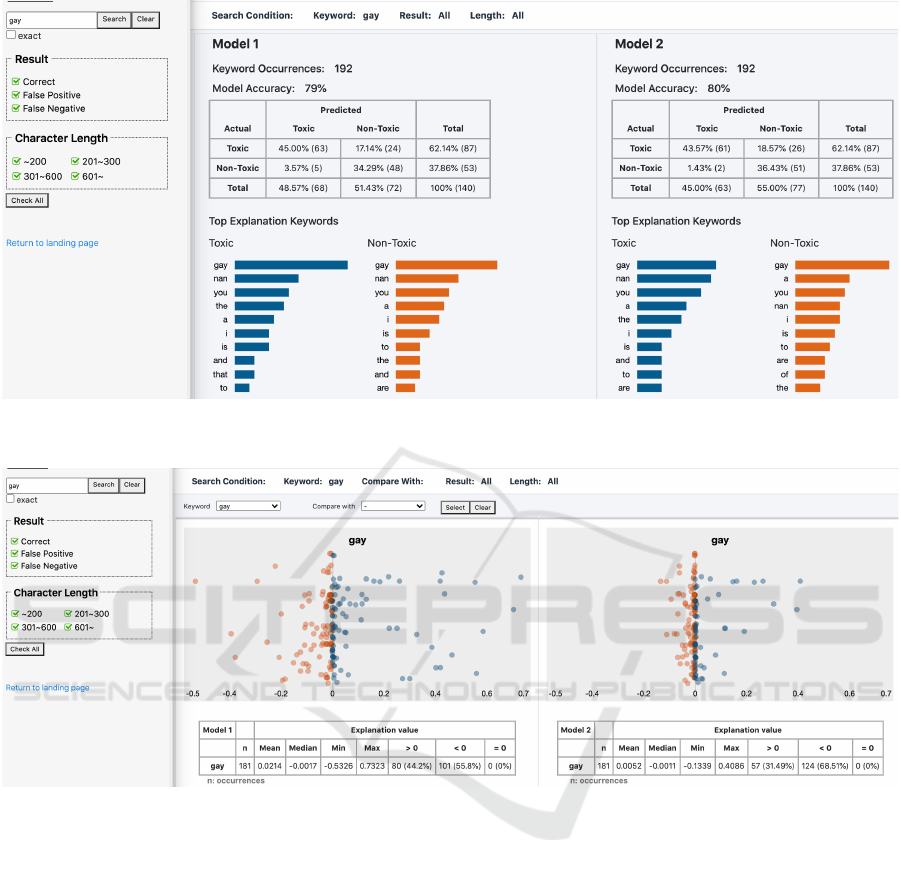
Figure 5: Toxicity models case study: Features for the original (left) and debiased (right) toxicity models for a subset of the
data filtered by character length. The word “gay” appears as a top toxic feature in the original model.
Figure 6: Toxicity models case study: Plot of importance scores for “gay” compared in the original toxicity model (left) vs.
the debiased model (right). The scores are less dispersed in the debiased model.
only binary classification results. Third, different in-
terpretability methods could result in different out-
comes so the results of the case studies could differ.
However, the approach could also be used to compare
between the results of interpretability methods for a
particular feature. Finally, we rely on a combination
established visualization techniques for text and on
existing model interpretability libraries. Future work
should consider new visualization techniques.
5 CONCLUSION
Visualization approaches for the exploration and eval-
uation of text classification models and their explana-
tions focus on presenting information about individ-
ual datapoints. In this paper, we propose that a simple
feature-level visualization approach could help evalu-
ators understand how the model behaves for features
of interest. Specifically, we describe an approach that
leverages existing techniques to visualize the most
important features in the data, the overall importance
of a feature in the model and the context of that fea-
ture in the text. We built a prototype to test this ap-
proach, and used it in two case study evaluations.
The results showed that the feature-level approach
can help identify problems in text classification mod-
els related to specific features. Future work should
consider evaluating whether there are other feature-
level visualizations techniques that could be applied
to complement existing evaluation approaches for text
classification models.
Feature-level Approach for the Evaluation of Text Classification Models
169

REFERENCES
Barraza, R., Eames, R., Balducci, Y. E., Hinds, J., Hooger-
werf, S., Horvitz, E., Kamar, E., Krones, J., Lovejoy,
J., Mohadjer, P., Noah, B., and Nushi, B. (2019). Er-
ror Terrain Analysis for Machine Learning: Tools and
Visualizations. page 4.
Biederman, I. (1987). Recognition-by-components: A the-
ory of human image understanding. Psychological Re-
view, 94(2):115–147.
Brooks, M., Amershi, S., Lee, B., Drucker, S. M., Kapoor,
A., and Simard, P. (2015). FeatureInsight: Visual sup-
port for error-driven feature ideation in text classifica-
tion. In 2015 IEEE Conference on Visual Analytics
Science and Technology (VAST), pages 105–112.
Chen, C., Yuan, J., Lu, Y., Liu, Y., Su, H., Yuan, S., and Liu,
S. (2021). OoDAnalyzer: Interactive Analysis of Out-
of-Distribution Samples. IEEE Transactions on Visu-
alization and Computer Graphics, 27(7):3335–3349.
Chen, J., Song, L., Wainwright, M. J., and Jordan, M. I.
(2019). L-Shapley and C-Shapley: Efficient Model
Interpretation for Structured Data. In International
Conference on Learning Representations.
Conversation AI (2020). Unintended Bias Analysis.
Dixon, L., Li, J., Sorensen, J., Thain, N., and Vasserman, L.
(2018). Measuring and Mitigating Unintended Bias
in Text Classification. In Proceedings of the 2018
AAAI/ACM Conference on AI, Ethics, and Society,
pages 67–73. ACM.
Fischer, M. (1966). The KWIC index concept: A retrospec-
tive view. American Documentation, 17(2):57–70.
Hoover, B., Strobelt, H., and Gehrmann, S. (2020).
exBERT: A visual analysis tool to explore learned rep-
resentations in Transformer models. In Proceedings of
the 58th Annual Meeting of the Association for Com-
putational Linguistics: System Demonstrations, pages
187–196, Online. Association for Computational Lin-
guistics.
InterpretML (2021). Interpret-Text - Alpha Release.
Jessamyn (2017). I tested 14 sentences for ”perceived tox-
icity” using Perspectives. Least toxic: I am a man.
Most toxic: I am a gay black woman. Come on
https://t.co/M4TF9uYtzE.
Jigsaw (2018). Unintended bias and names of frequently
targeted groups.
Krause, J., Perer, A., and Ng, K. (2016). Interacting with
Predictions: Visual Inspection of Black-box Machine
Learning Models. In Proceedings of the 2016 CHI
Conference on Human Factors in Computing Systems,
CHI ’16, pages 5686–5697, New York, NY, USA. As-
sociation for Computing Machinery.
Li, J., Chen, X., Hovy, E., and Jurafsky, D. (2016). Vi-
sualizing and Understanding Neural Models in NLP.
In Proceedings of the 2016 Conference of the North
American Chapter of the Association for Computa-
tional Linguistics: Human Language Technologies,
pages 681–691, San Diego, California. Association
for Computational Linguistics.
Liu, S., Chen, C., Lu, Y., Ouyang, F., and Wang, B. (2019).
An Interactive Method to Improve Crowdsourced An-
notations. IEEE Transactions on Visualization and
Computer Graphics, 25(1):235–245.
Lundberg, S. M. and Lee, S.-I. (2017). A Unified Ap-
proach to Interpreting Model Predictions. In Guyon,
I., Luxburg, U. V., Bengio, S., Wallach, H., Fergus, R.,
Vishwanathan, S., and Garnett, R., editors, Advances
in Neural Information Processing Systems 30, pages
4765–4774. Curran Associates, Inc.
Maas, A. L., Daly, R. E., Pham, P. T., Huang, D., Ng, A. Y.,
and Potts, C. (2011). Learning Word Vectors for Sen-
timent Analysis. In Proceedings of the 49th Annual
Meeting of the Association for Computational Lin-
guistics: Human Language Technologies, pages 142–
150. Association for Computational Linguistics.
Ribeiro, M. T., Singh, S., and Guestrin, C. (2016). ”Why
Should I Trust You?”: Explaining the Predictions
of Any Classifier. In Proceedings of the 22nd
ACM SIGKDD International Conference on Knowl-
edge Discovery and Data Mining, KDD ’16, pages
1135–1144, New York, NY, USA. ACM.
Rohrdantz, C., Hao, M. C., Dayal, U., Haug, L.-E., and
Keim, D. A. (2012). Feature-Based Visual Sentiment
Analysis of Text Document Streams. ACM Trans. In-
tell. Syst. Technol., 3(2):26:1–26:25.
Stoffel, F., Flekova, L., Oelke, D., Gurevych, I., and Keim,
D. A. (2015). Feature-Based Visual Exploration of
Text Classification. In Symposium on Visualization in
Data Science (VDS) at IEEE VIS 2015.
Tenney, I., Wexler, J., Bastings, J., Bolukbasi, T., Co-
enen, A., Gehrmann, S., Jiang, E., Pushkarna, M.,
Radebaugh, C., Reif, E., and Yuan, A. (2020). The
Language Interpretability Tool: Extensible, Interac-
tive Visualizations and Analysis for NLP Models.
arXiv:2008.05122 [cs].
Thain, N., Dixon, L., and Wulczyn, E. (2017). Wikipedia
talk labels: Toxicity.
Wexler, J., Pushkarna, M., Bolukbasi, T., Wattenberg, M.,
Vi
´
egas, F., and Wilson, J. (2020). The What-If
Tool: Interactive Probing of Machine Learning Mod-
els. IEEE Transactions on Visualization and Com-
puter Graphics, 26(1):56–65.
Yuan, J., Chen, C., Yang, W., Liu, M., Xia, J., and Liu,
S. (2021). A survey of visual analytics techniques
for machine learning. Computational Visual Media,
7(1):3–36.
Zhang, J., Wang, Y., Molino, P., Li, L., and Ebert, D. S.
(2019). Manifold: A Model-Agnostic Framework
for Interpretation and Diagnosis of Machine Learn-
ing Models. IEEE Transactions on Visualization and
Computer Graphics, 25(1):364–373.
IVAPP 2022 - 13th International Conference on Information Visualization Theory and Applications
170
