How Does AI Play Football?
An Analysis of RL and Real-world Football Strategies
Atom Scott
1 a
, Keisuke Fujii
2 b
and Masaki Onishi
1 c
1
National Institute of Advanced Industrial Science and Technology (AIST), Tsukuba, Japan
2
Graduate School of Informatics, Nagoya University, Nagoya, Japan
Keywords:
Deep Reinforcement Learning, Football, Agent-Based Simulation, Network Theory.
Abstract:
Recent advances in reinforcement learning (RL) have made it possible to develop sophisticated agents that
excel in a wide range of applications. Simulations using such agents can provide valuable information in
scenarios that are difficult to scientifically experiment in the real world. In this paper, we examine the play-
style characteristics of football RL agents and uncover how strategies may develop during training. The learnt
strategies are then compared with those of real football players. We explore what can be learnt from the use
of simulated environments by using aggregated statistics and social network analysis (SNA). As a result, we
found that (1) there are strong correlations between the competitiveness of an agent and various SNA metrics
and (2) aspects of the RL agents play style become similar to real world footballers as the agent becomes more
competitive. We discuss further advances that may be necessary to improve our understanding necessary to
fully utilise RL for the analysis of football.
1 INTRODUCTION
Over the last decade there has been an increase in
interest towards analytics in football (soccer), and
many other team-sports. Increasing compute power
and data has added to the effectiveness of statistical
analysis and more importantly, allowed for compute-
intensive and data-intensive machine learning meth-
ods. Many success stories have been well doc-
umented in mainstream publications such as “The
Numbers Game” (Anderson and David, 2013), “Bas-
ketball on Paper” (Oliver, 2020) and perhaps most
well known, “Moneyball” (Lewis, 2004). As a result,
a growing number of sports teams now adopt special-
ist roles for analytics. If we assume such trends are
to continue, it is likely both compute power and the
amount of available data will exponentially increase
in forthcoming years. However, it will remain nearly
impossible to collect real-world sport data in a scien-
tific manner where variables can be controlled. This
can not be helped since top level sports are highly
competitive in nature and leave very little room for
experimentation. To solve this problem, agent-based
a
https://orcid.org/0000-0003-2500-1096
b
https://orcid.org/0000-0002-4580-4868
c
https://orcid.org/0000-0001-5487-4297
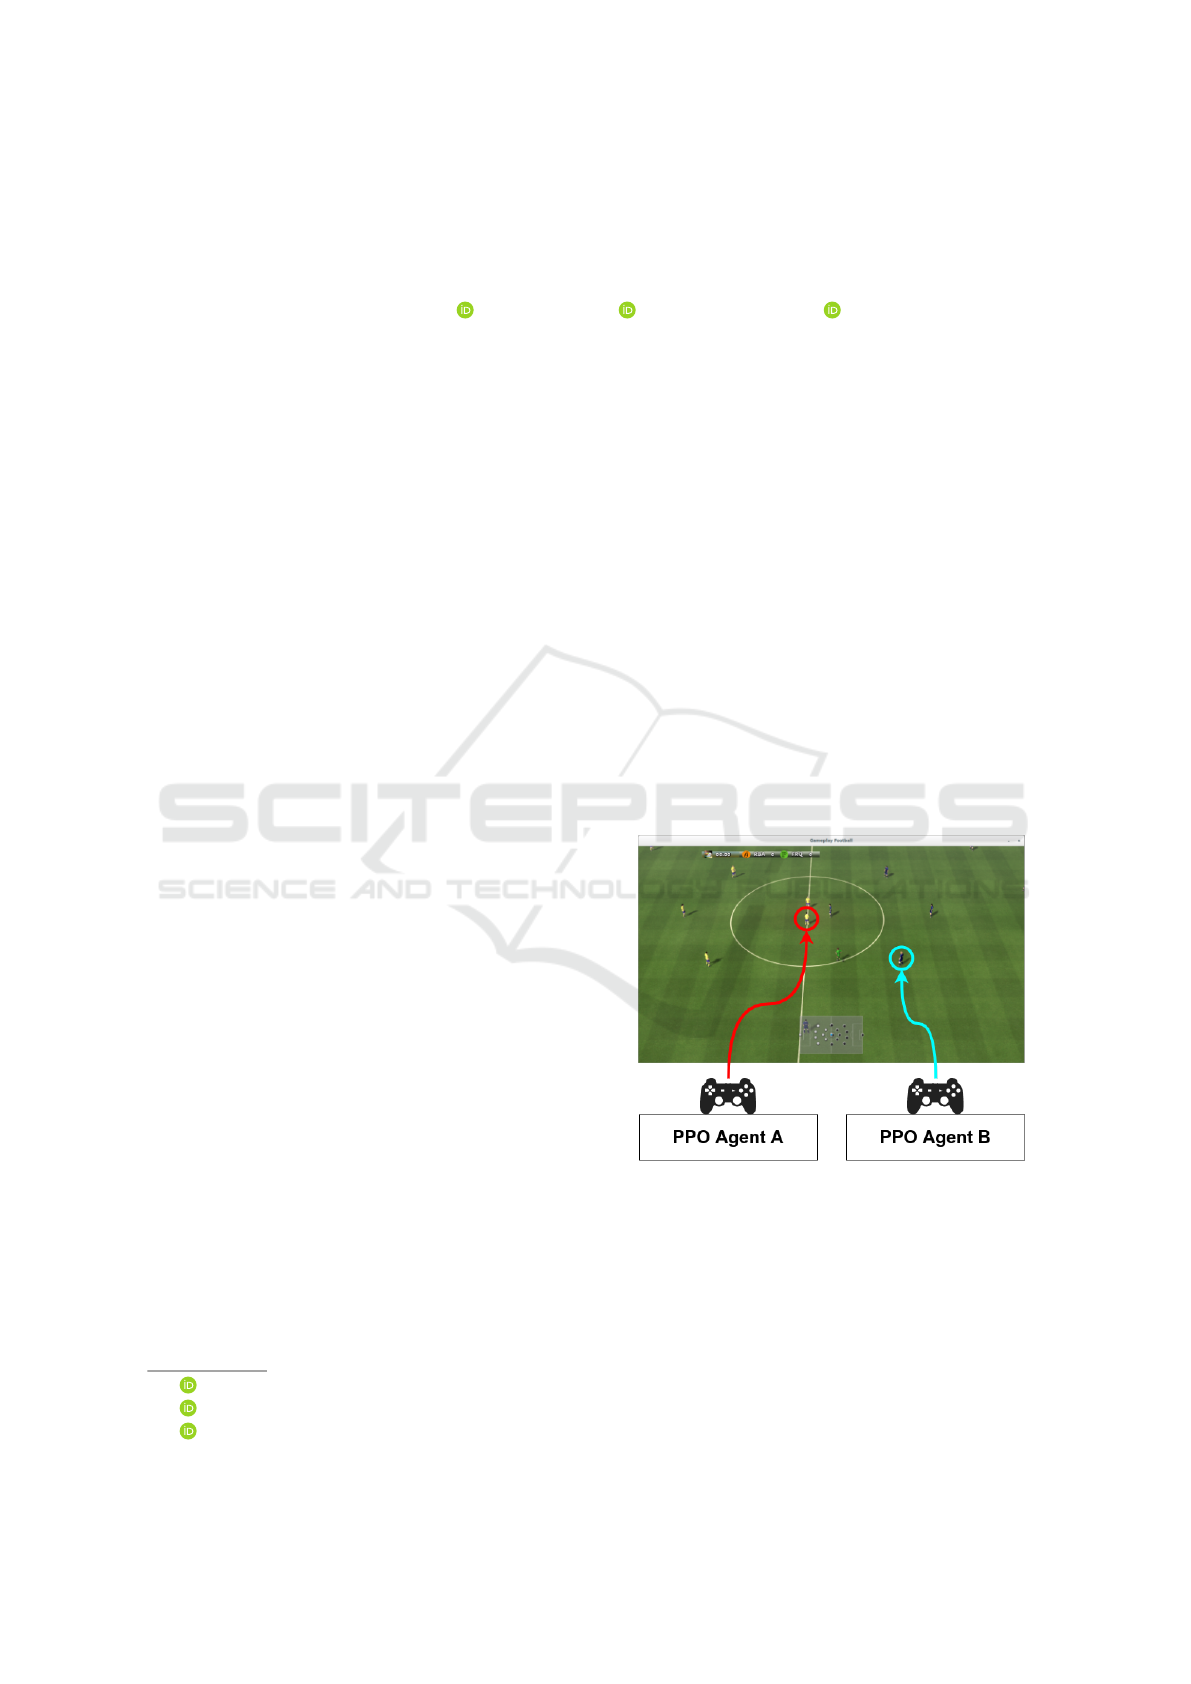
Figure 1: A representation of the agent setup where a
single RL agent is used to control a single active player
of a team. The illustration shows an image of the ren-
dered environment (Kurach et al., 2019) with arrows
pointing to the active-players. Active players can be
switched in-game to and from non-active players that are
controlled via another in-game rule based system.
simulation (ABS) can be used as a test-bed to simu-
late various scenarios in a scientific manner.
Recently, deep reinforcement learning (RL) meth-
ods have shown it is possible to train agents, from
scratch, that outperform human experts in both tra-
42
Scott, A., Fujii, K. and Onishi, M.
How Does AI Play Football? An Analysis of RL and Real-world Football Strategies.
DOI: 10.5220/0010844300003116
In Proceedings of the 14th International Conference on Agents and Artificial Intelligence (ICAART 2022) - Volume 1, pages 42-52
ISBN: 978-989-758-547-0; ISSN: 2184-433X
Copyright
c
2022 by SCITEPRESS – Science and Technology Publications, Lda. All rights reserved

ditional (Silver et al., 2016; Silver et al., 2017) and
modern games (Mnih et al., 2013; Vinyals et al.,
2019a; Berner et al., 2021). These breakthroughs,
coupled with increasingly sophisticated simulation
environments, are a promising new direction of anal-
ysis in sports. Therefore in this paper, we examine
the characteristics of football playing RL agents and
uncover how strategies may develop during training.
Out of the many team sports that exist we choose to
focus on football due to its popularity and the avail-
ability of a sufficient simulation environment (see §2
for more detail). We use the Google Research Foot-
ball environment (Kurach et al., 2019) to train football
playing RL agents in a single agent manner. Fig. 1
illustrates a representation of the training setup we
used. Another problem concerning the use of ABS
is that the domain gap between RL-agents and real-
world football players is not clear. To gain a bet-
ter understanding of this domain gap, we compared
the characteristics of football strategies in RL agents
and real-world football players. In summary, the main
contributions of the study are as follows:
• We compared the characteristics of football play-
ing RL agents (Kurach et al., 2019) in various
training processes and real-world football players
for the first time, thus verifying simulations as a
practical approach for football analysis.
• We found that more competitive RL agents have
a more similar and well-balanced passing strat-
egy to real-world footballers in comparison to less
competitive RL agents.
• We analyzed how the football strategies of RL-
agents evolve as the competitiveness of the agent
increases. Strong correlations were found be-
tween many aggregated statistics / social network
analysis and the competitiveness of the agent.
The outline of this paper is as follows. §2 provides
background on agent-based simulation, deep RL and
football analytics. §3 and §4 discuss the preliminar-
ies and methods used to train deep RL-agents and the
metrics used to analyse playing characteristics. We
present results and discussions in §5. Finally, we
summarise our conclusions and future work in §6.
2 RELATED WORKS
2.1 Agent-Based Simulation
Agent-based simulation (ABS) is a computationally
demanding technique for simulating dynamic com-
plex systems and observing “emergent” behaviour.
With the use of ABS, we can explore different out-
comes of phenomena where it is infeasible to conduct
research testing and hypothesis formulations in real
life. In the context of football we can use ABS to
examine effects of different formations on match out-
comes or study various play styles using millions of
simulated football games. The availability of good
simulation environments are critical to ABS. Fortu-
nately, football has received a lot of attention in this
field thanks to the long history of the RoboCup simu-
lation track (Itsuki, 1995). In recent years, many other
simulation environments have also been introduced
(Liu et al., 2019; Cao and Lin, 2020; Liu et al., 2021).
Amongst others, the Google Research Football envi-
ronment (Kurach et al., 2019) stands out as an inter-
esting test-bed. Kaggle has held a competition with
over a thousand teams participating
1
and researchers
have already started to develop methods to analyze
football matches using Google Research Football via
graphical tools (Pinciroli Vago et al., 2020) or RL in-
spired metrics (Garnier and Gregoir, 2021). Therefore
we choose to use the Google Research Football envi-
ronment to conduct our simulations. It reproduces a
full football match with all of its usual regulations and
events, as well as player tiredness, misses, etc. We list
an overview of available simulation environments in
Table 1).
2.2 Deep Reinforcement Learning
Deep RL is a subset of RL that combines the tradi-
tional reinforcement learning setup, in which agents
learn optimal actions in a given environment, with
deep neural networks. There have been many remark-
able examples of agents trained via deep RL outper-
forming experts. A remarkable example of this is
Deepmind’s AlphaGo (Silver et al., 2016). Its suc-
cessors AlphaZero (Silver et al., 2018) and Muzero
(Schrittwieser et al., 2020) achieved a superhuman
level of play in the games of chess, shogi and go
solely via self-play.
In contrast to the single-player, deterministic, per-
fect information setup for the classical games men-
tioned above, football is a highly stochastic imperfect
information game with multiple players that construct
a team. Although these characteristics have made it
difficult to learn through self-play, recent works have
shown promising results in similar categorised games
such as DotA and StarCraft. For example, OpenAI
Five (Berner et al., 2021) scaled existing RL systems
to unprecedented levels, while performing “surgery”
to utilise thousands of GPUs over multiple months.
On the other hand, AlphaStar (Vinyals et al., 2019b)
1
https://www.kaggle.com/c/google-football
How Does AI Play Football? An Analysis of RL and Real-world Football Strategies
43

Table 1: An overview of various football simulation environments.
Environment Description
RoboCup Soccer (Itsuki,
1995)
An 11 vs 11 soccer simulator. Agents receive noisy input from virtual
sensors and perform some basic commands such as dashing, turning or
kicking.
MuJoCo 2 vs 2 (Liu et al.,
2019)
A 2 vs 2 football environment with simulated physics built on MuJoCo
(Todorov et al., 2012). Uses relatively simple bodies with a 3-dimensional
action space.
Unity 2 vs 2 (Cao and Lin,
2020)
A 2 vs 2 football environment built on unity. Two types of players with
slightly different action spaces are available.
Google Research (Kurach
et al., 2019)
An 11 vs 11 soccer environment built on GameplayFootball. Simulates
a full football game and includes common aspects such as goals, fouls,
corners, etc.
Humanoid (Liu et al., 2021) A 2 vs 2 football environment with simulated physics built on MuJoCo
(Todorov et al., 2012) designed to embed sophisticated motor control of
the humanoid. Physical aspects such as the radius of the ball and goal size
are adjusted in proportion to the height of the humanoid.
populated a league consisting of agents with distinct
objectives, and introduced agents that specifically try
to exploit shortcomings in other agents and in the
league. This allowed agents to train while continually
adapting strategies and counter-strategies.
As for research directly related to football, Robot
soccer (Itsuki, 1995) has been one of the longstanding
challenges in AI. Although this challenge has been
tackled with machine learning techniques (Riedmiller
et al., 2009; Macalpine and Stone, 2018), it has not
yet been mastered by end-to-end deep RL. Nonethe-
less, baseline approaches for other simulation envi-
ronments mostly utilise deep RL. (Liu et al., 2019)
used a population-based training with evolution and
reward shaping on a recurrent policy with recurrent
action-value estimator in MuJoCo Soccer. Whereas
(Cao and Lin, 2020) showed that RL from hierarchi-
cal critics was affected in the Unity 2 vs 2 environ-
ment. Proximal Policy Optimization (PPO) (Schul-
man et al., 2017), IMPALA (Espeholt et al., 2018) and
Ape-X DQN (Horgan et al., 2018) were provided as
benchmark results for Google Research Football (Ku-
rach et al., 2019). Finally a combination of imitation
learning, single and multi-agent RL and population-
based training was used in Humanoid Football (Liu
et al., 2021).
Many researchers have attempted to model the be-
haviour of players by predicting the short term future
contrary to the long-term horizon goal approach us-
ing deep RL (Le et al., 2017; Felsen et al., 2018; Yeh
et al., 2019). Such research offers important insights
into what architectures/time horizons/rewards may be
effective.
2.3 Football Analytics
Football has been considered to be one of the most
challenging sports to analyze due to the number
of players, continuous events and low frequency of
points (goals). Therefore, it is only recently that
a data-driven approach has started to gain attention.
Nevertheless, numerous approaches, from the sim-
ple aggregation of individual/team play statistics (No-
vatchkov and Baca, 2013), to complex methods, such
as those that use gradient boosting to model the value
of actions (Decroos et al., 2018a). In general one can
observe two different types of analysis. The first fo-
cuses on evaluating the overall performance of a sin-
gle player or team. In this case, an action is usu-
ally valued then aggregated by either player or team.
(Decroos et al., 2018a) assigned values to on-ball ac-
tion actions by measuring their effect on the prob-
abilities that a team will score. In turn, (Fernan-
dez and Bornn, 2018) proposed a method to value
off the ball actions by estimating pitch value with
a neural network. The second category of analy-
sis is strategy or play style analysis. Methods such
as automatic formation (Bialkowski et al., 2016) or
tactic (Gyarmati and Anguera, 2015; Decroos et al.,
2018b) discovery fall into this category. Social net-
work analysis is also a well used method to anal-
yse interactions between players (Clemente et al.,
2016; Buld
´
u et al., 2018). Network metrics such
as betweenness, centrality and eccentricity are of-
ten used. (Pe
˜
na and Hugo, 2012) demonstrated that
winning teams presented lower betweenness scores.
Similarly, (Gonc¸alves et al., 2017) provided evidence
that a lower passing dependency for a given player
and higher intra-team well-connected passing rela-
tions may optimise team performance.
ICAART 2022 - 14th International Conference on Agents and Artificial Intelligence
44

3 PRELIMINARIES
3.1 Proximal Policy Optimization
To learn policies for agents to play Google Research
Football, we follow the original paper (Kurach et al.,
2019) and use Proximal Policy Optimisation (PPO)
(Schulman et al., 2017). PPO belongs to a fam-
ily of reinforcement learning called policy gradient
methods. These methods try to find an optimal be-
haviour strategy by alternating between optimising
a clipped surrogate objective function and sampling
data through interactions with the environment. The
objective function of PPO is denoted as follows,
(1)
J(θ) = E[min(
r(θ)
ˆ
A
θ
old
(s,a),
clip(r(θ),1 − ε,1 + ε)
ˆ
A
θ
old
(s,a))]
where
• r(θ) is the probability ratio between old and new
policies π
θ
(a|s)/π
θ
old
(a|s).
• π
θ
(a|s) is a policy, given parameter θ, state s and
action a.
• clip(r(θ), 1 − ε, 1 + ε) clips r(θ) to be in the range
of 1 + ε and 1 − ε.
•
ˆ
A(s,a) is an estimate of the advantage function
A(s,a) = Q(s,a) −V (s), given action-value func-
tion Q(s,a) and state-value function V (s).
Typically J(θ) is updated via stochastic gradient
ascent with an optimiser such as Adam(Kingma and
Ba, 2014).
3.2 TrueSkill
TM
Ranking System
To measure the competitiveness of the learned RL
agents, the TrueSkill
TM
ranking system (Herbrich
et al., 2007) was used. The TrueSkill
TM
ranking sys-
tem is a skill based ranking system that quantifies
a players’ rating using the Bayesian inference algo-
rithm. This system has been frequently used in many
different multiplayer games and sports applications
(Tarlow et al., 2014). Although It also works well
with N-player team games and free-for-all games, we
focus our attention on the simplest case, a two-player
match.
Each rating is characterised by a Gaussian distri-
bution with mean µ and standard deviation σ. These
values are updated based on the outcome of a game
with the following update equations,
µ
winner
← µ
winner
+
σ
2
winner
c
· v(
µ
winner
− µ
loser
c
,
ε
c
)
(2)
µ
loser
← µ
loser
+
σ
2
loser
c
· v(
µ
winner
− µ
loser
c
,
ε
c
) (3)
σ
winner
← σ
winner
· [1 −
σ
winner
c
2
· w(
µ
winner
− µ
loser
c
,
ε
c
)]
(4)
σ
loser
← σ
loser
· [1 −
σ
loser
c
2
· w(
µ
winner
− µ
loser
c
,
ε
c
)]
(5)
c
2
= 2β
2
+ σ
2
winner
+ σ
2
loser
(6)
where ε is a configurable parameter that should be ad-
justed accordingly to the likeliness of a draw, and β is
the variance of the performance around the skill of
each player. v and w are functions that are designed
so that weighting factors are roughly proportional to
the uncertainty of the winner/loser vs. the total sum
of uncertainties. We refer the reader to the original
paper (Herbrich et al., 2007) for further explanation.
Finally, a so-called conservative skill estimate can be
calculated by µ − k ∗ σ, where k is usually set to 3.
3.3 Social Network Analysis
To analyse the intelligence of coordinated RL agents
and compare their characteristics with real-world
data, an analysis framework that is not influenced by
physical differences between simulations and the real-
world is necessary. Passes do not rely on individ-
ual physical ability and is an important component
of teamplay. Therefore we focus on social network
analysis (SNA) of passes.
A pass network is a weighted directed graph that
considers the direction and frequency of passes be-
tween two players. It takes the form of an adjacency
matrix A and weight matrix W . A
i j
represents the
number of passes from player i to player j, and W
i j
is simply 1/A
i j
if i 6= j or 0 otherwise. Below, we
explain the three metrics used in this paper.
Closeness Centrality. Closeness is calculated by
computing the sum of all the geodesic (shortest) paths
between the node v and all other nodes w ∈ V in the
following equation.
(7)Closeness(v) =
1
∑
w∈V
σ
vw
where σ
vw
is defined as the shortest distance between
nodes v and w. This score indicates how easy it is for
a player to be connected with teammates. Therefore
a high closeness score indicates that a player is well-
connected within the team.
How Does AI Play Football? An Analysis of RL and Real-world Football Strategies
45
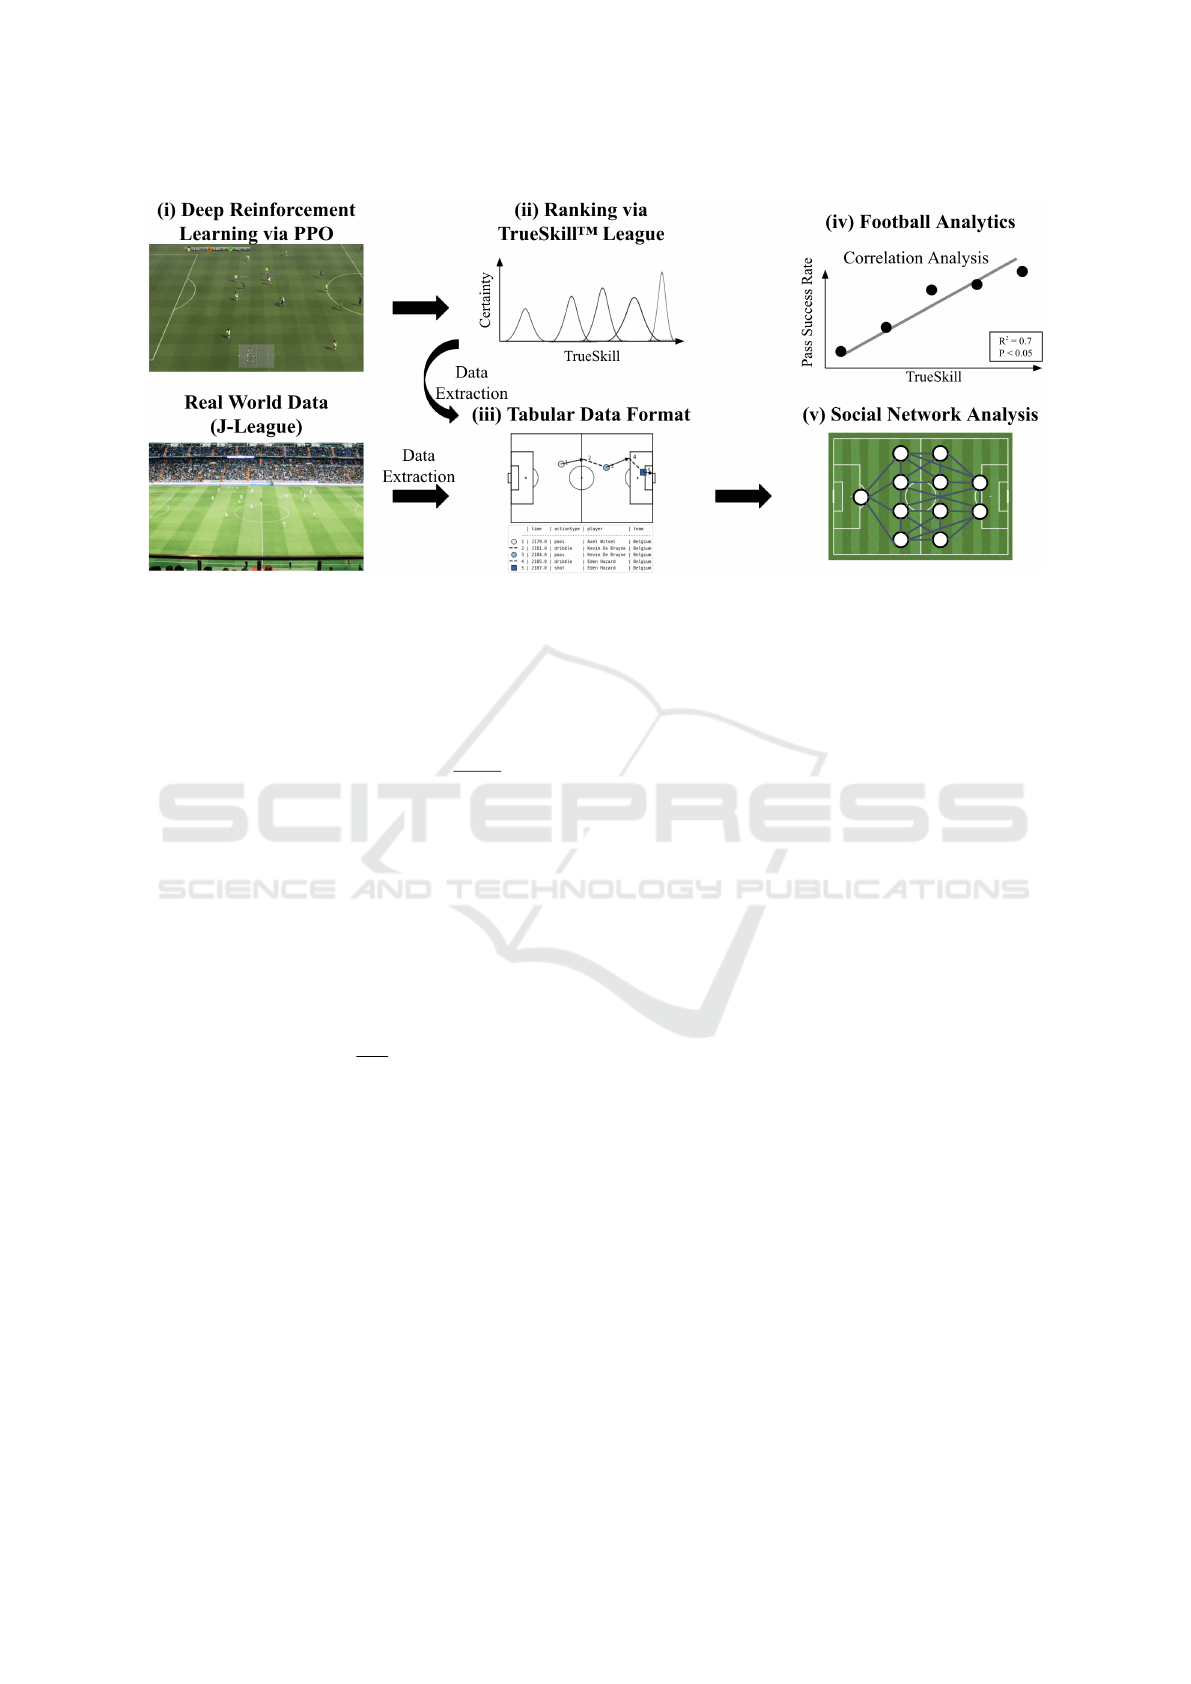
Figure 2: An overview of the proposed framework. Details for steps (i) - (iv) are detailed in §4.1, §4.1.2, §4.2, and §4.3
respectively. In (iii), data is converted to a tabular format inspired by SPADL (Decroos et al., 2019).
Betweenness Centrality. Betweenness is calculated
by counting the total numbers of geodesic paths link-
ing v and w and the number of those paths that inter-
sect a node n in the following equation.
(8)Betweeness(v) =
∑
s6=v∈V
∑
t6=v∈V
σ
st
(v)
σ
st
where σ
st
(v) is the number of shortest paths from
node s to node t that passes node v. This score in-
dicates how players acts as a bridge between passing
plays, high deviation within a team may indicate well-
balanced passing strategy and less dependence on a
single player.
Pagerank Centrality. Pagerank is calculated based
on the total number of passes a player made in the
following equation.
(9)Pagerank(v) = p
∑
v6=w
A
vw
L
out
w
Pagerank(w) + q
where p represents the probability a player will decide
not pass the ball and q can be thought of ”free popu-
larity”, both of which are heuristic parameters. These
parameters are set to p = 0.85 and q = 1 following
(Pe
˜
na and Hugo, 2012). A high pagerank score im-
plies that the player is a popular choice for other play-
ers to pass too.
4 PROPOSED ANALYSIS
FRAMEWORK
In this section, we present the details of our proposed
analysis framework, which is outlined in Fig. 2, and
the details regarding the setup of the subsequent ex-
periments. Our framework consists of five parts. In
the first part (i), we train agents using proximal policy
optimisation in the Google Research Football simu-
lation environment. (ii) Then, we rank the agents by
the TrueSkill ranking system. In the third part (iii),
we extract event data concerning on-the-ball actions
from the simulations and convert it into a tabular for-
mat. This format is similar to the Soccer Player Ac-
tion Description Language (SPADL) but simplified to
only include passes and shots. We also convert real-
world football data into the same format as well. Fi-
nally, we perform (iv) correlation analysis and (v) so-
cial network analysis on the obtained data.
4.1 Agent Training and Ranking
In order to train agents, we closely follow the setup
of the baseline agents for the Google Research Foot-
ball environment presented in (Kurach et al., 2019).
An agent will control a single active player at all
timesteps and has the ability to switch to control any
other player on the same team (excluding the goal
keeper). Non-active players are controlled via another
in-game rule based system. In this system, the be-
havior of the non-active players corresponds to simple
actions such as running towards the ball when not in
possession, or move forward together with the active
player when in possession. Hence, the players can be
regarded as being centrally controlled. In this paper
we consider multi-agent RL to be out of scope and
hope to pursue such a setup in the future.
ICAART 2022 - 14th International Conference on Agents and Artificial Intelligence
46
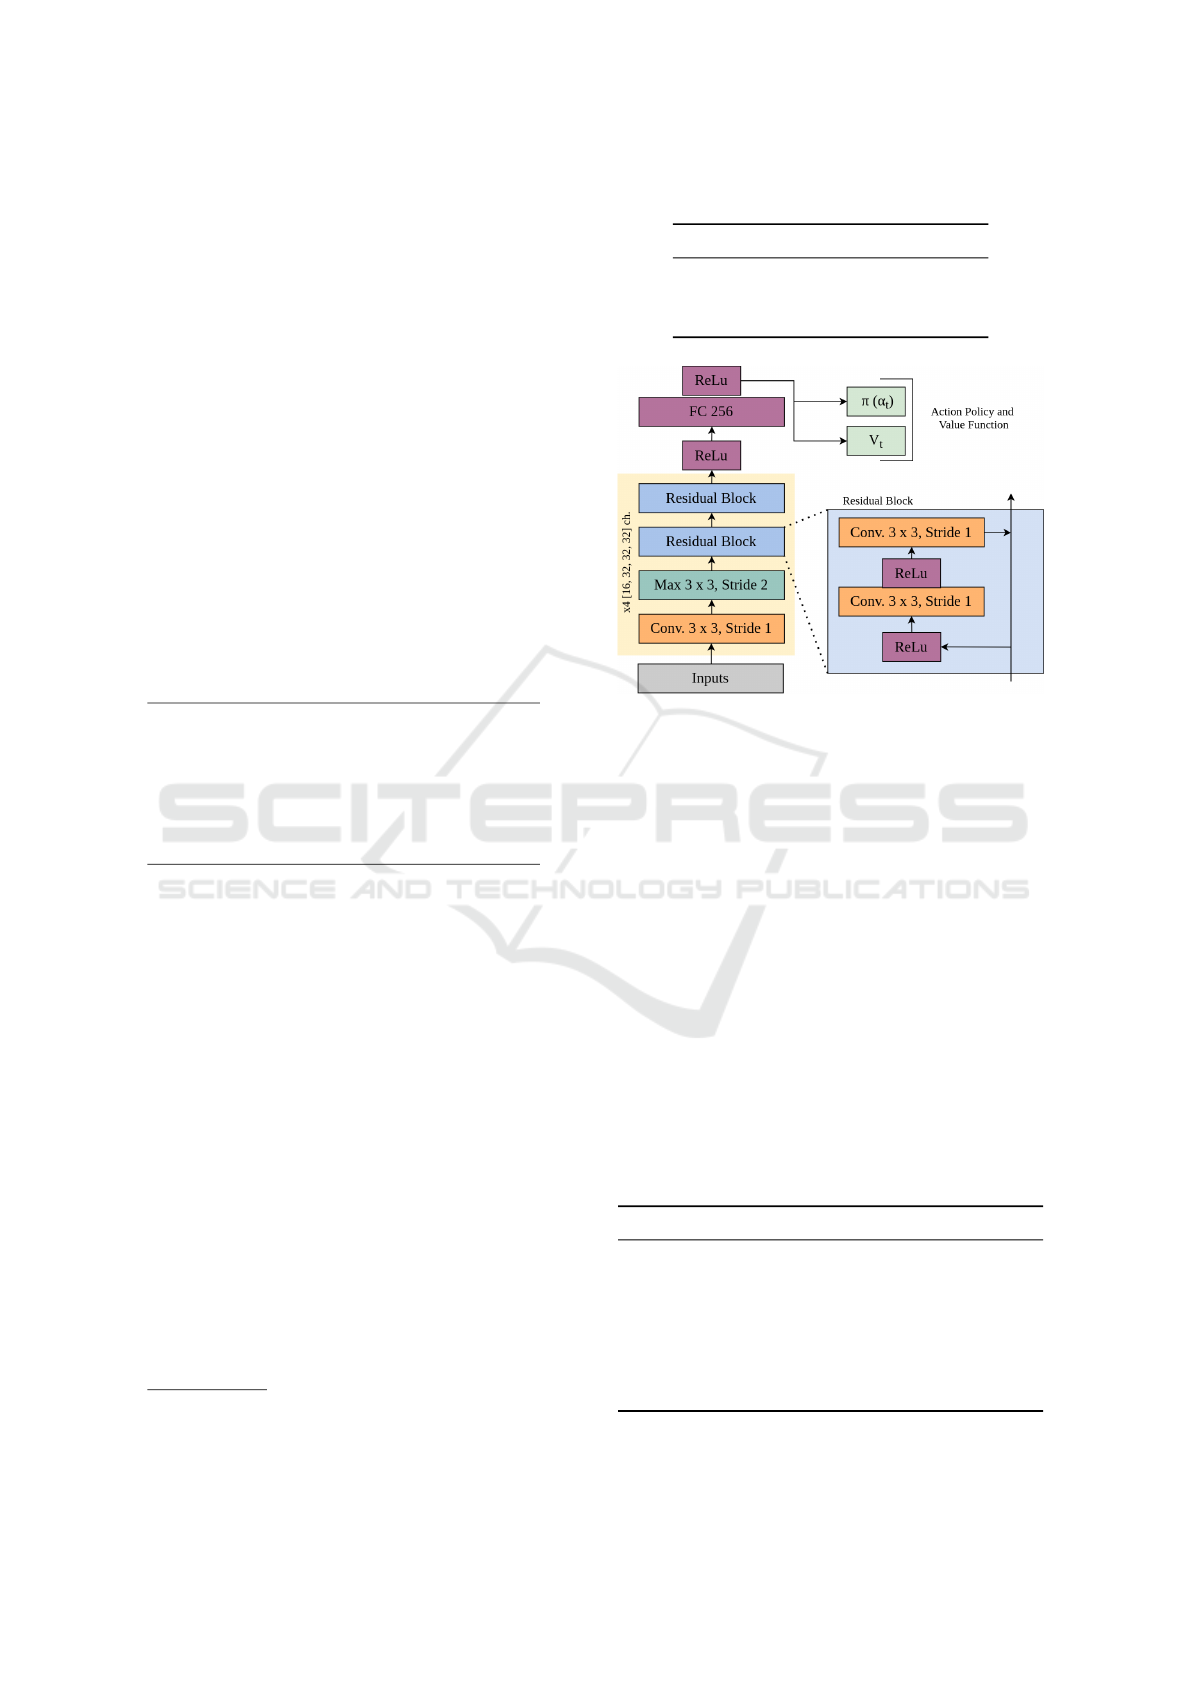
4.1.1 Deep RL Implementation
The training pipeline is as follows. First, we repro-
duce the results presented in (Kurach et al., 2019) by
using the same hyper-parameter/training setup. The
Deep RL agent uses the PPO algorithm (Schulman
et al., 2017) as described in §3.1, with an Impala pol-
icy (Espeholt et al., 2018). The architecture is avail-
able Fig. 3.
Each state of the simulation is represented by a
Super Mini Map (SMM) based on (Kurach et al.,
2019). The SMM consists of four 72 × 96 matrices,
each a binary representation of the locations of the
home team players, the away team players, the ball
and the active player, respectively. A visualisation
can be found in Fig. 4. The actions available
2
to the
central control agent are displayed in Table 2. Each
movement action is sticky, therefore once executed,
the action will persist until there is an explicit stop
action.
Table 2: Set of Actions.
Top Bottom Left
Right Top-Left Top-Right
Bottom-Left Bottom-Right Shot
Short Pass High Pass Long Pass
Idle Sliding Dribble
Stop-Dribble Sprint Stop-Moving
Stop-Sprint - -
Rewards are based on whether a goal is conceded,
scored, or neither. In addition to this goal-based re-
ward a small ”checkpoint” reward is used to aid the
initial development where goals are sparse. We refer
the reader to (Kurach et al., 2019) for a more in-depth
description of possible training setups.
Based on the above setup, in this paper, we started
by training for 50 million time-steps against the built-
in easy, medium and hard level bots. During this
phase, we noticed that the performance of the agents
had not converged. Therefore, we trained an extra 50-
million time-steps against the easy and medium bots
and an extra 150-million time-steps against the hard-
level bot. The average goal difference for the result-
ing agents at 50, 100 and 200 million time-steps is
presented in Table 3.
4.1.2 TrueSkill Ranking Implementation
To implement the TrueSkill ranking, we create a
round-robin tournament composed of 15 agents (5
from each setup, easy, medium and hard) using inter-
2
See https://git.io/Jn7Oh for a complete overview of ob-
servations and actions
Table 3: Average Goal Difference.
Bot Level 50M 100M 200M
Easy 5.66 8.20 -
Medium 0.93 2.35 -
Hard -0.08 1.25 2.81
Figure 3: An overview of the architecture used for the PPO
agents (Kurach et al., 2019). A stack of four previous
frames (see Fig. 4) is used as input.
mediate checkpoints saved at 20%, 40%, 60%, 80%
and 100% of training. In a single round-robin tour-
nament, each agent plays every other agent once. We
conducted a total of 50 round-robin tournaments, re-
sulting in a total of 5250 matches. Next, we use the
resulting scores of all 5250 matches to calculate a
TrueSkill rating for each agent. We show the top-3
/ bottom-3 ranked agents of the resulting leader-board
in Table 4. Notice the agents trained against the easy
level built-in bot ranks top 1, 2 and 3. This result
seems counter intuitive, since agents trained longer
against stronger built-in bots should be more compet-
itive. Therefore this suggests that there could be bet-
ter training strategies. However, exploring alternative
training strategies is out of scope for this work and
shall be left for future work.
Table 4: TrueSkill ratings top/bottom-3.
Ranking Bot Level Checkpoint % rating
1 Easy 80% 34.1
2 Easy 100% 31.5
3 Easy 40% 31.5
...
13 Easy 20% 8.3
14 Hard 20% 7.9
15 Medium 20% 7.0
How Does AI Play Football? An Analysis of RL and Real-world Football Strategies
47
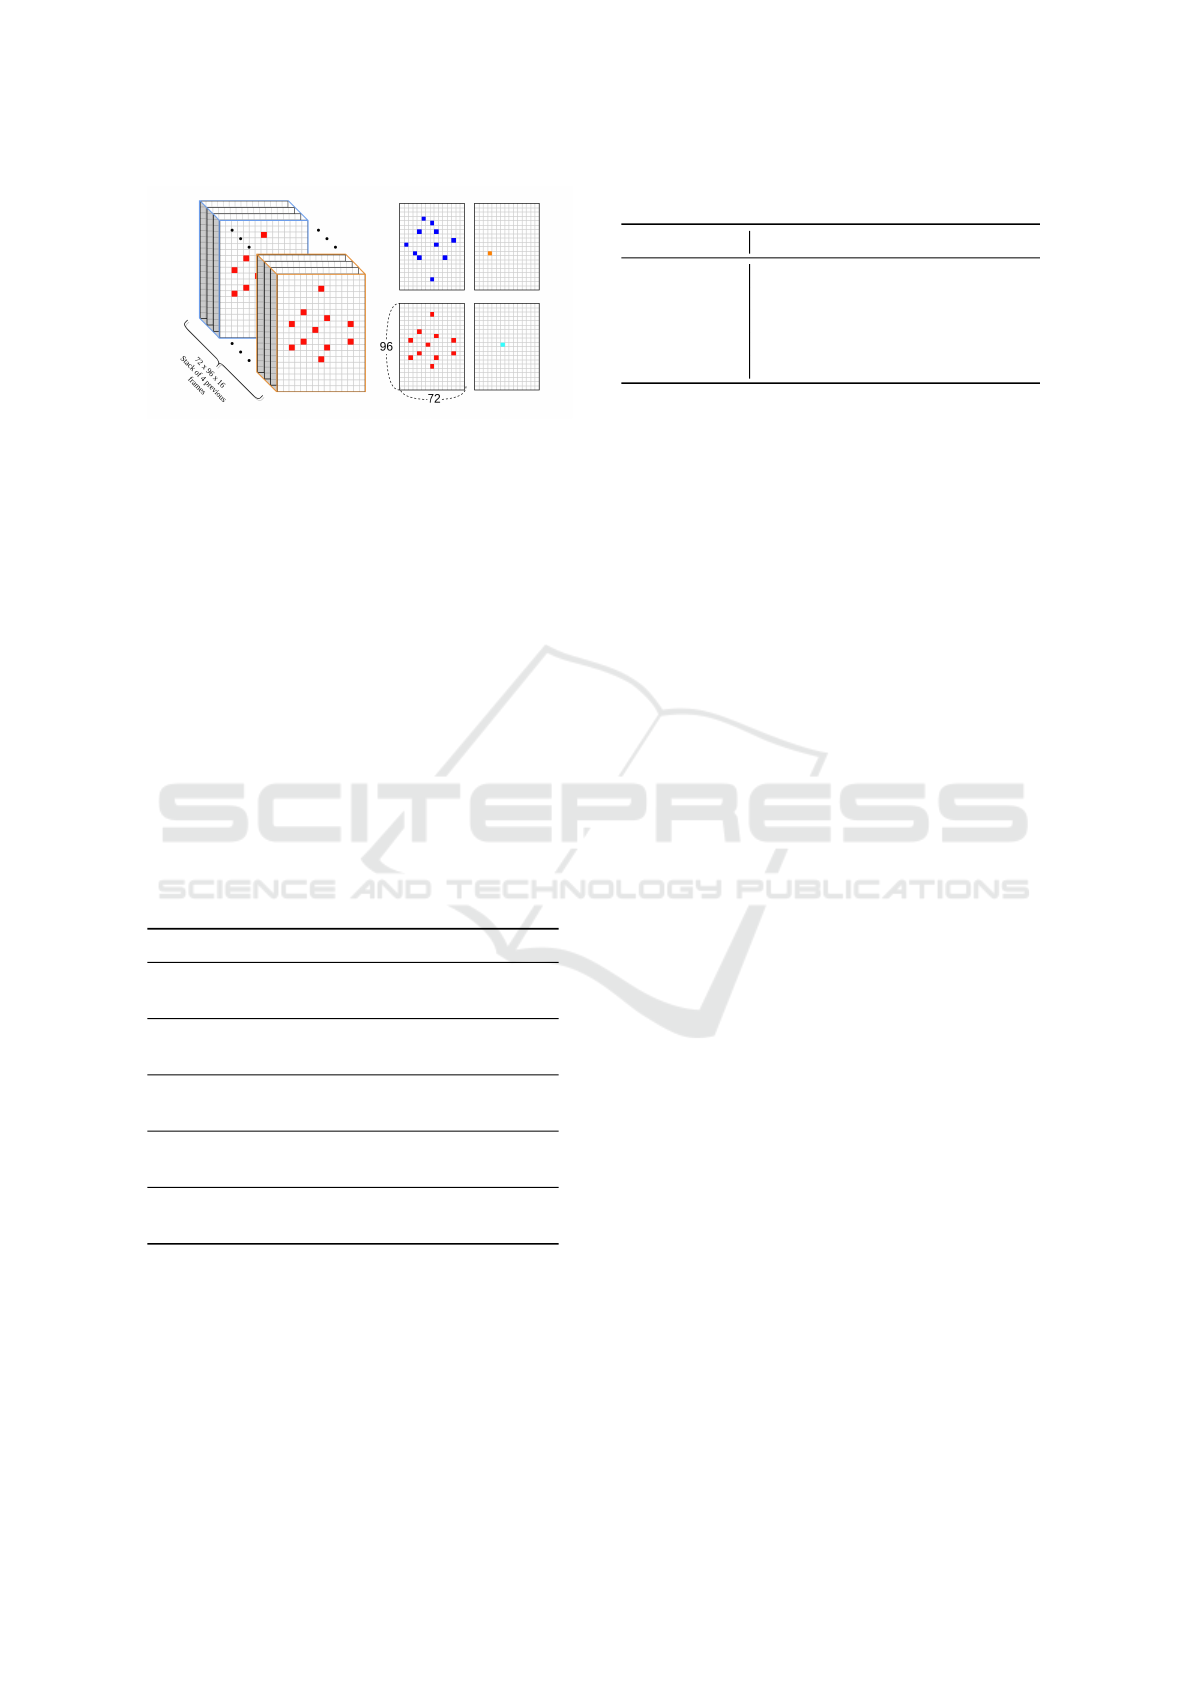
Figure 4: Overview of super mini map (Kurach et al., 2019).
Left: A stack of four previous frames used as input for the
CNN. Right: A visualisation of an example stacked mini
map representation.
4.2 Data Extraction
Action data and observation data are extracted from
the games saved when calculating TrueSkill ranking.
From this data, we extract all pass and shot actions
and programmatically label their results based on the
following events. For real-world football data, we use
event-stream data for three matches from the 2019-
2020 J1-League. The J1-League is the top division
of the Japan professional football league. The data
was purchased from DataStadium Inc. We show the
match results in Table 5. The three teams, Kashima
Antlers, Tokyo FC and Yokohama F Marinos were
chosen since they were the top-3 teams on the leader-
board at the time.
Table 5: Details of the real-world football data used.
Date Home Team Score Away Team
2019/04/14 FC Tokyo (1-3)
Kashima
Antlers
2019/04/28
Yokohama
F Marinos
(2-1)
Kashima
Antlers
2019/06/29 FC Tokyo (4-2)
Yokohama
F Marinos
2019/08/10
Kashima
Antlers
(2-1)
Yokohama
F Marinos
2019/09/14
Kashima
Antlers
(2-0) FC Tokyo
We also extract all pass and shot actions from
this data. The results format of both simulation and
real-world data is tabular and a simplified version of
SPADL (Decroos et al., 2019). An explanation of the
variables used in analysis is listed in Table 6.
Table 6: Explanation of variables used in analysis.
Variables Explanation
Shots Number of shot attempts.
Passes Number of pass attempts.
PageRank See §3.3 PageRank Centrality.
Closeness See §3.3 Closeness Centrality.
Betweenness See §3.3 Betweenness Centrality.
4.3 Data Analysis
Two types of football analysis are applied to the ex-
tracted data. We first focus on the finding statistics
and metrics that correlate with the agent’s TrueSkill
ranking. For this we calculate simple descriptive
statistics, such as number of passes/shots, and social
network analysis (SNA) metrics, such as closeness,
betweenness and pagerank. As explained in §3.3,
SNA was chosen because it describes the a team ball
passing strategy. Therefore it is sufficient for the anal-
ysis of central control based RL agents. We calculate
Pearson correlation coefficient and p-value for test-
ing non-correlation. The following criteria were used
to interpret the magnitude of correlation: values less
than 0.3 were interpreted as trivial; between 0.3 and
0.5 as moderate; between 0.5 and 0.7 as strong; be-
tween 0.7 and 0.9 as very strong; more than 0.9 as
nearly perfect. A p-value less than 0.05 is consid-
ered as statistically significant, any result above this
threshold will be deemed unclear.
Our second focus is the comparison of SNA met-
rics between RL agents and real-world football data.
By using SNA metrics, we can compare the ball pass-
ing strategy between RL agents and real-world foot-
ball data. To assure a fairness, we bootstrap N = 500
samples of passes from each team before generating
a pass network to analyse. We repeat this process 50
times. Then, we conduct normality tests to determine
that the distribution is Gaussian. Finally, we plot and
visually inspect the distribution.
5 RESULTS AND DISCUSSION
In this section, we show the results of the two types
of data analysis detailed in §4.3. The first is a correla-
tion analysis between descriptive statistics / SNA met-
rics and TrueSkill rankings. The second is a compara-
tive analysis which uses SNA metrics generated from
RL agents (Google Research Football) and real-world
football players (2019-2020 season J1-League).
ICAART 2022 - 14th International Conference on Agents and Artificial Intelligence
48
5.1 Correlation Analysis
For each team an agent controls, descriptive statistics
and SNA metrics were calculated using the variables
listed in Table 6. The Pearson correlation coefficients
are shown in Table 7.
Table 7: Correlation coefficients and p-values for each met-
ric. Metrics with very strong and nearly perfect correlation
are emphasised in bold.
Metric
Correlation
Coefficient
p-value
Total Passes -0.5 0.061
Total Shots 0.77 0.001
Successful Pass Pct 0.62 0.014
Successful Shot Pct 0.68 0.005
PageRank (std) 0.58 0.022
PageRank (mean) -0.05 0.848
PageRank (max) 0.48 0.068
PageRank (min) -0.91 0.001
Closeness (std) -0.54 0.036
Closeness (mean) -0.64 0.010
Closeness (max) -0.61 0.015
Closeness (min) -0.66 0.007
Betweenness (std) 0.65 0.009
Betweenness (mean) 0.72 0.002
Betweenness (max) 0.65 0.009
Betweenness (min) 0.0 0.0
As can be seen in Table 7, many of the descrip-
tive statistics and SNA metrics have a strong correla-
tion with TrueSkill rankings. We observe that ”Total
Shots” and ”Betweenness (mean)” have a very strong
positive correlation with TrueSkill rankings. On the
other hand, ”PageRank (min)” has a nearly perfect
negative correlation.
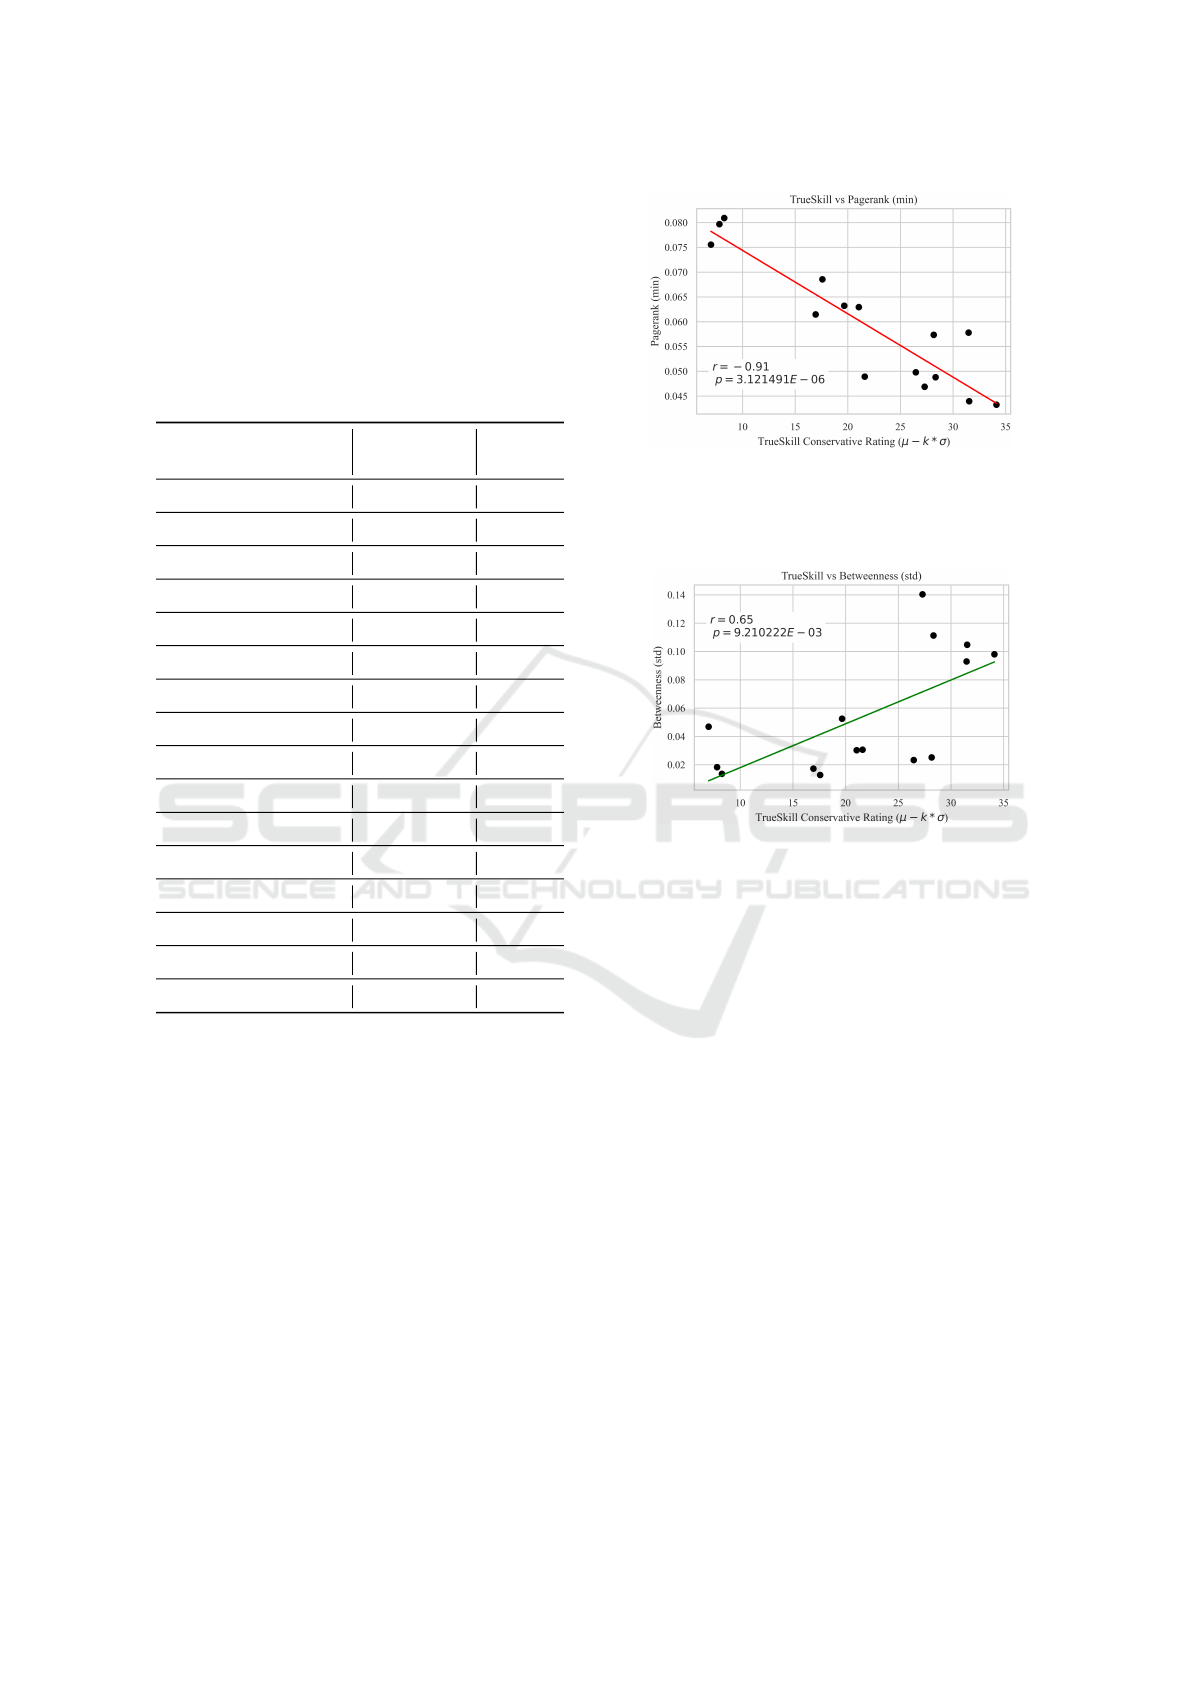
The metric with the largest overall correlation is
the pagerank aggregated by the minimum value in the
network (r = −0.91, p = 0.001). We present a scatter
plot of this metric in Fig. 5.
Since pagerank roughly assigns to each player the
probability that they will have the ball after a arbitrary
number of passes, the node with the minimum pager-
ank centrality is likely to be the goalkeeper, whom
we assume that the agent is quickly learning to keep
the ball away from. Another interesting finding is the
strong positive correlation with the standard deviation
Figure 5: Pagerank aggregated by the minimum value in the
network.
of betweenness (r = 0.65, p = 0.009). This metric is
also presented as a scatter plot in Fig. 6.
Figure 6: Betweenness aggregated by the standard devia-
tion.
A large variance in betweenness has been de-
mostrated to be related with a well-balanced pass-
ing strategy and less specific player dependence
(Clemente et al., 2016). It is fascinating that the
agents learn to prefer a well-balanced passing strat-
egy as TrueSkill increases. In general, most of the
metrics presented in Table 7 have either a negative or
positive moderate strong correlation with p < 0.05.
5.2 Comparative Analysis between
Simulated and Real-world Football
As exaplained in §4.2, for each of the five real world
football matches played by three teams, we calcu-
lated the distribution of SNA metrics. Distributions
were calculated by bootstrapping N = 500 samples
of passes 50 times. The same procedure was taken
for the matches played by the best and worst ranked
agents (see Table 4.1). In Fig. 7 we visualise each
of the three SNA metrics aggregated by two different
methods. Aggregation methods that showed strong
correlations in Table 7 were chosen. The total num-
ber of passes and shots per match can not be fairly
compared between RL-agents and real-world foot-
How Does AI Play Football? An Analysis of RL and Real-world Football Strategies
49
ballers because of different match lengths. In sum-
mary, a total of six variables were compared over
five agents/teams (worst RL agent, best RL agent, FC
Tokyo, Kashima Antlers and Yokohama F Marinos).
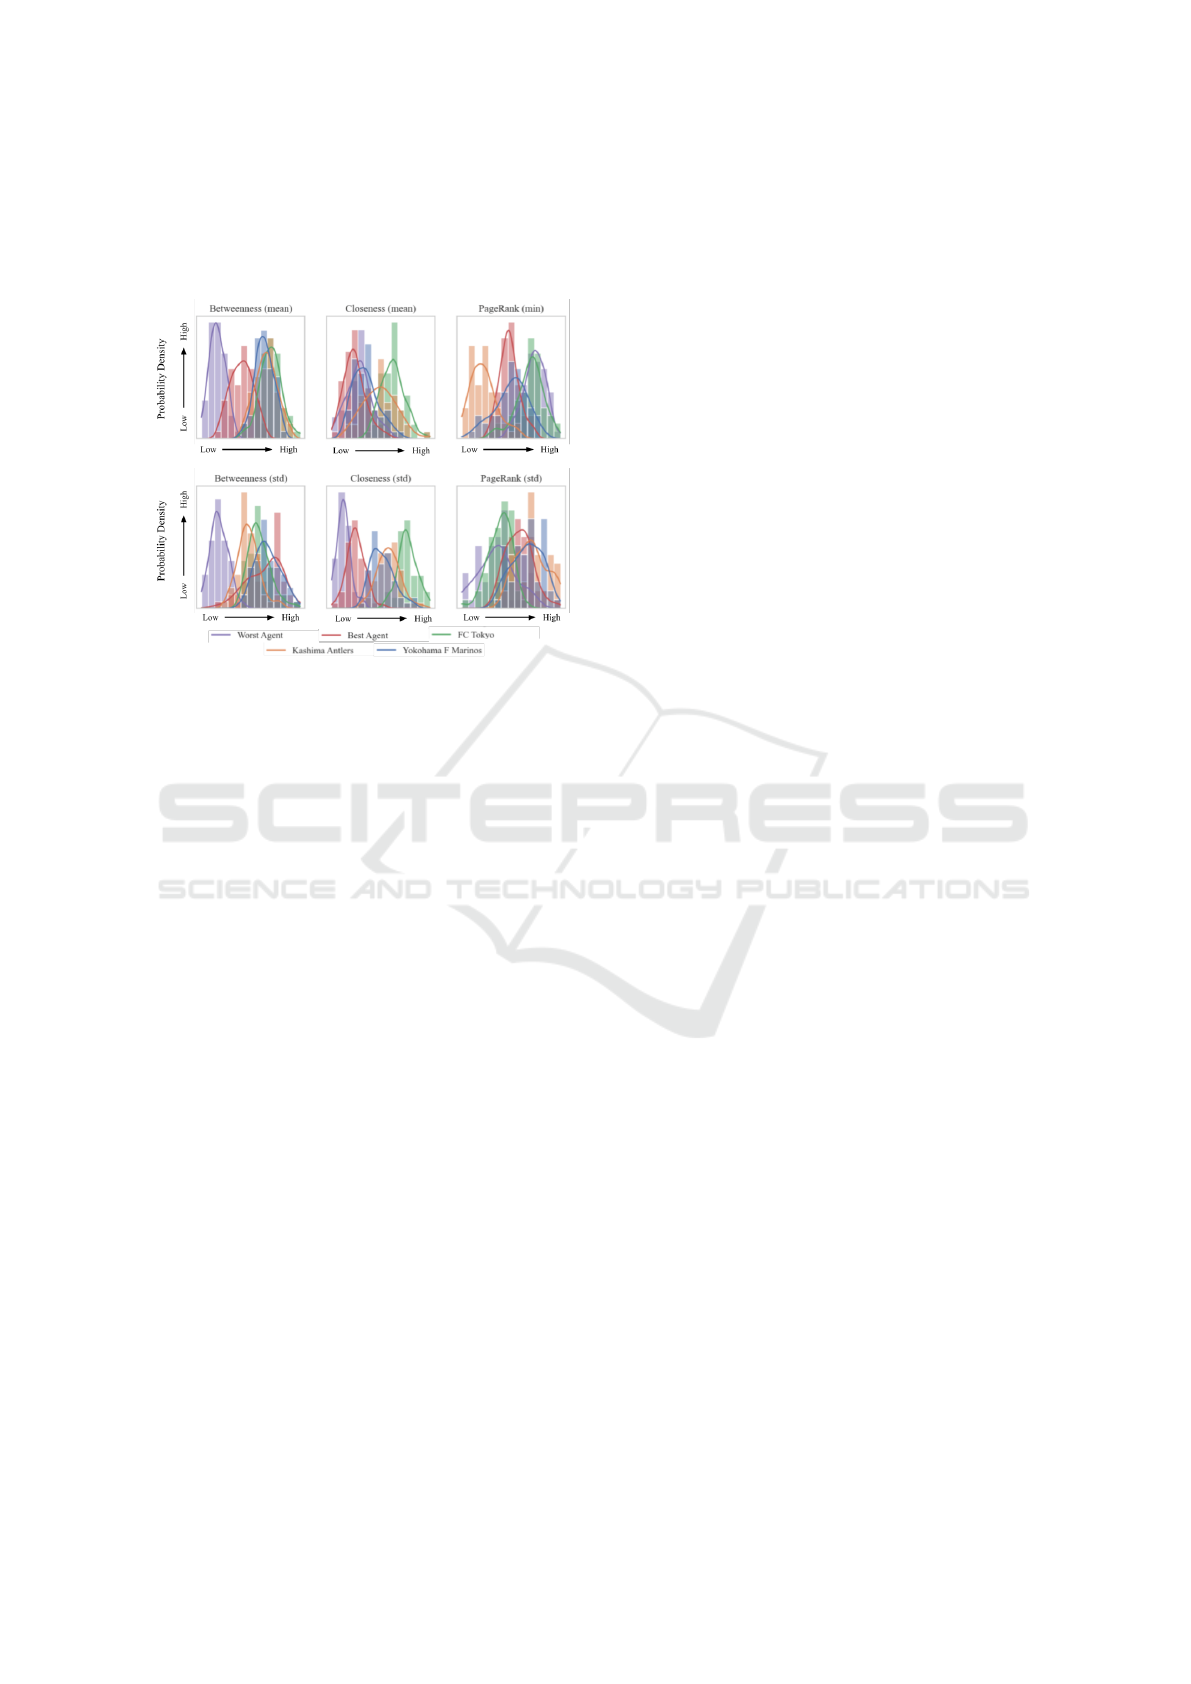
Figure 7: Comparison of SNA metrics between best/worst
agents and real-world football teams.
Observing this visualisation we can see that the
distribution of ”Betweenness (mean)”, ”Betweenness
(std)” and ”Closeness (std)” metrics for the worst
agent is distant from the others. The fact that the best
agent distribution of the same metric is much closer
to that of J League teams implies that agent has learnt
to play in a similar style through RL. However the
same cannot be said for the other metrics, ”Closeness
(mean)”, ”PageRank (std)” and ”PageRank (min)”.
From the perspective of football analysis, the dis-
tributions of ”Betweenness (std)” is very interesting.
Since a high deviation in betweenness may indicate
well-balanced passing strategy and less dependence
on a single player, we can hypothesise that agents are
learning to play a more well-balanced passing strat-
egy similar to real-world footballers.
Although it is difficult to interpret the results from
the PageRank and Closeness metrics, it is surprising
that even the worst RL agents have overlapping dis-
tributions with the real-world footballers. Consider-
ing the fact that even the worst RL agent was trained
thousands of timesteps, this may be because strategies
related PageRank and Closeness are easier to learn.
6 CONCLUSIONS AND FUTURE
WORK
In this paper, we compared the characteristics and
play styles of RL agents of increasing competitive-
ness. As a result, we found many metrics that strongly
correlate with the competitiveness (TrueSkill rating)
of an agent. Another contribution in this paper, is the
comparison between RL agents and real football play-
ers. Our findings suggest that an RL agent can learn
to play football in similar style to that of real player
without being explicitly programmed to do so.
There are many directions we can extend the re-
search presented in this paper. In particular, we plan
to work on increasing the degree of freedom within
the simulations to create a more realistic environment.
This can be achieved by conducting multi-agent sim-
ulation where an RL agent controls a single active
player in contrast to a whole team. Another approach
would be to use a less restrictive environment such
as the “Humanoid Football” environment to intro-
duce biomechanical movements. Although both ap-
proaches appear interesting, improvements in train-
ing methodology, such as imitation learning and auto-
curricular learning may be required to produce ade-
quate agents.
We also noticed that it was difficult to use state
of the art football analysis methods due to different
representations of the underlying data. Since efficient
representations such as SPADL already exist, we hope
other researchers can build on top of these so that
the community can easily take advantage of existing
methods.
REFERENCES
Anderson, C. and David, S. (2013). The Numbers Game:
Why Everything You Know About Football is Wrong.
Penguin Books Limited.
Berner, C., Brockman, G., Chan, B., Cheung, V., Denni-
son, C., Farhi, D., Fischer, Q., Hashme, S., Hesse,
C., J
´
ozefowicz, R., Gray, S., Olsson, C., Pachocki,
J., Petrov, M., Pond
´
e de Oliveira Pinto, H., Raiman,
J., Salimans, T., Schlatter, J., Schneider, J., Sidor,
S., Sutskever, I., Tang, J., Wolski, F., and Zhang, S.
(2021). Dota 2 with Large Scale Deep Reinforcement
Learning. Technical report.
Bialkowski, A., Lucey, P., Carr, P., Matthews, I., Sridha-
ran, S., and Fookes, C. (2016). Discovering team
structures in soccer from spatiotemporal data. IEEE
Transactions on Knowledge and Data Engineering,
28(10):2596–2605.
Buld
´
u, J. M., Busquets, J., Mart
´
ınez, J. H., Herrera-Diestra,
J. L., Echegoyen, I., Galeano, J., and Luque, J. (2018).
Using network science to analyse football passing net-
works: Dynamics, space, time, and the multilayer na-
ture of the game.
Cao, Z. and Lin, C.-T. (2020). REINFORCEMENT
LEARNING FROM HIERARCHICAL CRITICS.
Technical report.
ICAART 2022 - 14th International Conference on Agents and Artificial Intelligence
50

Clemente, F. M., Martins, F. M. L., and Mendes, R. S.
(2016). Social Network Analysis Applied to Team
Sports Analysis. SpringerBriefs in Applied Sciences
and Technology. Springer International Publishing,
Cham.
Decroos, T., Bransen, L., Haaren, J. V., and Davis, J. (2019).
Actions Speak Louder than Goals: Valuing Player Ac-
tions in Soccer. 11.
Decroos, T., Bransen, L., Van Haaren, J., and Davis,
J. (2018a). Actions speak louder than goals:
Valuing player actions in soccer. arXiv preprint
arXiv:1802.07127.
Decroos, T., Van Haaren, J., and Davis, J. (2018b). Au-
tomatic discovery of tactics in spatio-temporal soccer
match data. In Proceedings of the ACM SIGKDD In-
ternational Conference on Knowledge Discovery and
Data Mining, pages 223–232. Association for Com-
puting Machinery.
Espeholt, L., Soyer, H., Munos, R., Simonyan, K., Mnih,
V., Ward, T., Doron, Y., Firoiu, V., Harley, T., Dun-
ning, I., Legg, S., and Kavukcuoglu, K. (2018). IM-
PALA: Scalable Distributed Deep-RL with Impor-
tance Weighted Actor-Learner Architectures. 35th In-
ternational Conference on Machine Learning, ICML
2018, 4:2263–2284.
Felsen, P., Lucey, P., and Ganguly, S. (2018). Where Will
They Go? Predicting Fine-Grained Adversarial Multi-
agent Motion Using Conditional Variational Autoen-
coders. Technical report.
Fernandez, J. and Bornn, L. (2018). Wide Open Spaces:
A statistical technique for measuring space creation in
professional soccer. In MIT Sloan Sports Analytics
Conference. MIT Press.
Garnier, P. and Gregoir, T. (2021). Evaluating Soccer
Player: from Live Camera to Deep Reinforcement
Learning.
Gonc¸alves, B., Coutinho, D., Santos, S., Lago-Penas,
C., Jim
´
enez, S., and Sampaio, J. (2017). Explor-
ing team passing networks and player movement dy-
namics in youth association football. PLoS ONE,
12(1):e0171156.
Gyarmati, L. and Anguera, X. (2015). Automatic Extraction
of the Passing Strategies of Soccer Teams.
Herbrich, R., Minka, T., and Graepel, T. (2007). TrueSkill:
A Bayesian Skill Rating System. Technical report.
Horgan, D., Quan, J., Budden, D., Barth-Maron, G., Hessel,
M., van Hasselt, H., and Silver, D. (2018). Distributed
Prioritized Experience Replay.
Itsuki, N. (1995). Soccer server: a simulator for
RoboCup. In JSAI AI-Symposium 95: Special Session
on RoboCup. Citeseer.
Kingma, D. P. and Ba, J. (2014). Adam: A Method for
Stochastic Optimization. 3rd International Confer-
ence on Learning Representations, ICLR 2015 - Con-
ference Track Proceedings.
Kurach, K., Raichuk Piotr St
´
a nczyk Michał Zaj, A., and
Bachem Lasse Espeholt Carlos Riquelme Damien
Vincent Marcin Michalski Olivier Bousquet Syl-
vain Gelly, O. (2019). Google Research Football: A
Novel Reinforcement Learning Environment.
Le, H. M., Yue, Y., Carr, P., and Lucey, P. (2017). Coor-
dinated multi-agent imitation learning. In Proceed-
ings of the 34th International Conference on Machine
Learning-Volume 70, pages 1995–2003. JMLR. org.
Lewis, M. (2004). Moneyball: The Art of Winning an Un-
fair Game. W. W. Norton.
Liu, S., Lever, G., Merel, J., Tunyasuvunakool, S., Heess,
N., and Graepel, T. (2019). Emergent Coordination
Through Competition.
Liu, S., Lever, G., Wang, Z., Merel, J., Eslami, S. M. A.,
Hennes, D., Czarnecki, W. M., Tassa, Y., Omid-
shafiei, S., Abdolmaleki, A., Siegel, N. Y., Hasen-
clever, L., Marris, L., Tunyasuvunakool, S., Song,
H. F., Wulfmeier, M., Muller, P., Haarnoja, T., Tracey,
B. D., Tuyls, K., Graepel, T., and Heess, N. (2021).
From Motor Control to Team Play in Simulated Hu-
manoid Football.
Macalpine, P. and Stone, P. (2018). Journal Logo Over-
lapping Layered Learning. In Artificial Intelligence
(AIJ), 254:21–43.
Mnih, V., Kavukcuoglu, K., Silver, D., Graves, A.,
Antonoglou, I., Wierstra, D., and Riedmiller, M.
(2013). Playing Atari with Deep Reinforcement
Learning.
Novatchkov, H. and Baca, A. (2013). Artificial intelligence
in sports on the example of weight training. Journal
of Sports Science and Medicine, 12(1):27–37.
Oliver, D. (2020). Basketball on Paper: Rules and Tools for
Performance Analysis. Potomac Books, Incorporated.
Pe
˜
na, J. L. and Hugo, T. (2012). A network theory analy-
sis of football strategies. Euromech Physics of Sports
Conference.
Pinciroli Vago, N. O., Lavinas, Y., Rodrigues, D., Moura,
F., Cunha, S., Aranha, C., and da Silva Torres, R.
(2020). INTEGRA: An Open Tool To Support Graph-
Based Change Pattern Analyses In Simulated Football
Matches. In ECMS 2020 Proceedings edited by Mike
Steglich, Christian Mueller, Gaby Neumann, Mathias
Walther, pages 228–234. ECMS.
Riedmiller, M., Gabel, T., Hafner, R., and Lange, S. (2009).
Reinforcement learning for robot soccer. 27:55–73.
Schrittwieser, J., Antonoglou, I., Hubert, T., Simonyan, K.,
Sifre, L., Schmitt, S., Guez, A., Lockhart, E., Has-
sabis, D., Graepel, T., Lillicrap, T., and Silver, D.
(2020). Mastering Atari, Go, chess and shogi by plan-
ning with a learned model. Nature, 588(7839):604–
609.
Schulman, J., Wolski, F., Dhariwal, P., Radford, A., and
Klimov, O. (2017). Proximal Policy Optimization Al-
gorithms.
Silver, D., Huang, A., Maddison, C. J., Guez, A., Sifre, L.,
Van Den Driessche, G., Schrittwieser, J., Antonoglou,
I., Panneershelvam, V., Lanctot, M., Dieleman, S.,
Grewe, D., Nham, J., Kalchbrenner, N., Sutskever, I.,
Lillicrap, T., Leach, M., Kavukcuoglu, K., Graepel,
T., and Hassabis, D. (2016). Mastering the game of
Go with deep neural networks and tree search. Na-
ture, 529.
Silver, D., Hubert, T., Schrittwieser, J., Antonoglou, I., Lai,
M., Guez, A., Lanctot, M., Sifre, L., Kumaran, D.,
How Does AI Play Football? An Analysis of RL and Real-world Football Strategies
51

Graepel, T., and others (2018). A general reinforce-
ment learning algorithm that masters chess, shogi, and
Go through self-play. Science, 362(6419):1140–1144.
Silver, D., Schrittwieser, J., Simonyan, K., Antonoglou,
I., Huang, A., Guez, A., Hubert, T., Baker, L., Lai,
M., Bolton, A., and others (2017). Mastering the
game of go without human knowledge. Nature,
550(7676):354.
Tarlow, D., Graepel, T., and Minka, T. (2014). Knowing
what we don’t know in NCAA Football ratings: Un-
derstanding and using structured uncertainty. In MIT
Sloan Sports Analytics Conference. MIT Press.
Todorov, E., Erez, T., and Tassa, Y. (2012). MuJoCo: A
physics engine for model-based control. In IEEE In-
ternational Conference on Intelligent Robots and Sys-
tems, pages 5026–5033.
Vinyals, O., Babuschkin, I., Chung, J., Mathieu, M., Jader-
berg, M., Czarnecki, W. M., Dudzik, A., Huang, A.,
Georgiev, P., Powell, R., Ewalds, T., Horgan, D.,
Kroiss, M., Danihelka, I., Agapiou, J., Oh, J., Dal-
ibard, V., Choi, D., Sifre, L., Sulsky, Y., Vezhn-
evets, S., Molloy, J., Cai, T., Budden, D., Paine, T.,
Gulcehre, C., Wang, Z., Pfaff, T., Pohlen, T., Wu,
Y., Yogatama, D., Cohen, J., McKinney, K., Smith,
O., Schaul, T., Lillicrap, T., Apps, C., Kavukcuoglu,
K., Hassabis, D., and Silver, D. (2019a). AlphaS-
tar: Mastering the Real-Time Strategy Game Star-
Craft II. \url{https://deepmind.com/blog/alphastar-
mastering-real-time-strategy-game-starcraft-ii/}.
Vinyals, O., Babuschkin, I., Czarnecki, W. M., Mathieu,
M., Dudzik, A., Chung, J., Choi, D. H., Powell, R.,
Ewalds, T., Georgiev, P., Oh, J., Horgan, D., Kroiss,
M., Danihelka, I., Huang, A., Sifre, L., Cai, T., Aga-
piou, J. P., Jaderberg, M., Vezhnevets, A. S., Leblond,
R., Pohlen, T., Dalibard, V., Budden, D., Sulsky, Y.,
Molloy, J., Paine, T. L., Gulcehre, C., Wang, Z., Pfaff,
T., Wu, Y., Ring, R., Yogatama, D., W
¨
unsch, D.,
McKinney, K., Smith, O., Schaul, T., Lillicrap, T.,
Kavukcuoglu, K., Hassabis, D., Apps, C., and Silver,
D. (2019b). Grandmaster level in StarCraft II using
multi-agent reinforcement learning. 350 — Nature —,
575.
Yeh, R. A., Schwing, A. G., Huang, J., and Murphy, K.
(2019). Diverse Generation for Multi-Agent Sports
Games. In The IEEE Conference on Computer Vision
and Pattern Recognition (CVPR).
ICAART 2022 - 14th International Conference on Agents and Artificial Intelligence
52
