
A Health IT-Empowered Integrated Platform for Secure Vaccine
Data Management and Intelligent Visual Analytics and Reporting
Jay Patel
a
, Bari Dzomba
b
, Hoa Vo, Susan Von Nessen-Scanlin
c
, Laura A. Siminoff
and Huanmei Wu
d
Temple University College of Public Health, Philadelphia, PA, U.S.A.
Keywords: COVID-19, Vaccination, RapidVax, Dashboard, Visualization, Automated Report Generation.
Abstract: Health IT (HIT) and big data analysis have been applied to a community-oriented COVID-19 vaccination
program (RapidVax). The HIT platform enables security data collection, enforces data quality and rule
validations, preserves privacy through strict data access control with HIPAA compliance and secure VPN,
customizes interactive user interfaces, empowers outcome visualization, and generates intelligent reporting.
The RapidVax program has adopted the HIT platform for ninety-five vaccination events in thirty
geographically separated communities. Our study demonstrated the significance of health IT tools, and
automated program generated in this study to help manage a public health problem such as the COVID-19
pandemic. The health IT tools developed in this study provided an essential piece of critical infrastructure
which supported our clinicians to run the vaccination task efficiently.
1 INTRODUCTION
COVID-19 is a novel form of coronavirus disease
caused by a respiratory virus known as severe acute
respiratory syndrome coronavirus 2 (SARS-CoV-2).
The virus spreads through respiratory droplets and
airborne particles. As of October 2nd, 2021, there are
219 million cases observed globally, out of which
4.55 million patients died from COVID-19. In the US,
as of October 2nd, 2021, there are 43.6 million cases,
out of which 700,000 died from COVID-19 (Covid in
the U.S.: Latest Map and Case Count - The New York
Times). COVID-19 infection causes flu like
symptoms such as fever, chills, cough, shortness of
breath, fatigue, muscle ache, body ache, headache,
and loss of taste (Mizrahi, 2020).
Vaccination is a simple, safe, and effective way
to enhance immunity for disease prevention
(prophylactic vaccine) or treatments (therapeutic
vaccine) (Bloom , 2017). Studies have shown that
vaccines have made great advances in public health
and improved human health through preventing
diseases. To date, no treatment planning has
a
https://orcid.org/0000-0003-0559-5958
b
https://orcid.org/0000-0002-0294-2187
c
https://orcid.org/0000-0001-6861-1295
d
https://orcid.org/0000-0003-0346-6044
demonstrated effectiveness for treating COVID 19
infections due to the susceptible mutations of the
virus (DeRoo , 2020). Scientists worldwide have been
working on developing vaccines against COVID 19
virus for the past 16 to 18 months. In the US, the first
vaccine was given On December 18, 2020, vaccine
for the prevention of COVID-19. Currently the US
Food and Drug Administration (FDA) has only
approved three of the COVID 19 vaccines that
include Pfizer-BioNTech, Moderna, and
Janssen/J&J, for use in the US. (Gee, 2021; Oliver,
2020, 2021).
At the Temple University College of Public
Health (TU CPH), we developed a LEAN protocol,
for Rapid Vaccination. We coined (RapidVax) to
vaccinate essential faculty, staff, and students at
Temple University’s College of Public Health, in
November/December 2020. The provision of
vaccinations was essential to keeping students in the
clinical field to meet the stringent educational
requirements of clinical programs such as nursing,
physical therapy in during the COVID-19 pandemic.
We developed an interprofessional team of licensed
522
Patel, J., Dzomba, B., Vo, H., Von Nessen-Scanlin, S., Siminoff, L. and Wu, H.
A Health IT-Empowered Integrated Platform for Secure Vaccine Data Management and Intelligent Visual Analytics and Reporting.
DOI: 10.5220/0010843700003123
In Proceedings of the 15th International Joint Conference on Biomedical Engineering Systems and Technologies (BIOSTEC 2022) - Volume 5: HEALTHINF, pages 522-531
ISBN: 978-989-758-552-4; ISSN: 2184-4305
Copyright
c
2022 by SCITEPRESS – Science and Technology Publications, Lda. All rights reserved
clinical faculty and students and conducted a proof-
of-concept test of the RapidVax protocol in February
2021. To further satisfy our community's needs for
vaccine delivery in Philadelphia, we partnered with
the Philadelphia Housing Authority (PHA) (the 4th
largest public housing authority in the US) to
vaccinate their essential workers and their community
partners, providing excellent customer service no
lines. In partnership with PHA we held over 80
vaccine clinics in senior public housing and
accomplished our joint goal of offering vaccination to
every senior in Philadelphia Public Housing by the
end of April 2020. Our mobile team has also reached
out to local communities, especially underserved
neighbourhood’s, to deliver vaccines efficiently and
quickly. To date, the RapidVax program has hosted
more than 100 community-based events in 30
geographically separated communities.
In order to successfully implement our program, we
have developed health IT strategies to effectively
register people for vaccination electronically,
determine the number of people who will visit for
vaccinations on a particular date, document their
vaccine series (dose one and dose two) information,
report vaccination to the city health department and
schedule follow-up appointments. Hence, the
objectives of this study are as follows.
Develop health IT processes to capture patient
information, registration, reporting and
scheduling of appointments electronically.
Develop methods to preserve data
confidentiality, and patient privacy as the
collected data contains Personal Identifiable
Information (PII).
Create data quality matrices (completeness and
concordance) to perform timely data quality
checks.
Develop computational programs to generate
accurate individual and summary reports
required by the Philadelphia Department of
Public Health (PDPH) and other groups,
including individual vaccine information, daily
summary, weekly reports, monthly updates,
and geospatial distributions.
To analyse the heterogeneous patient
information, clinical variables, vaccination
events, vaccine types, and other factors for
evidence-based decision making.
To create a website and a dashboard to
visualize the vaccination information for
public.
2 METHODS
Our approach consisted of the following steps. First,
we designed an online form using emergency use
authorization (EUA) guidelines from the FDA to
register patients for vaccines, documenting patient
specific information, risk of adverse effects of
vaccines, obtaining consent and dose 1 and dose 2
specific information, and booster dose information
(COVID-19 Vaccination Clinical and Professional
Resources | CDC, n.d.). Second, we developed a
method to de-identify datasets to preserve patients’
privacy and confidentiality. Next, we developed data
quality matrices to ensure high accuracy and quality
of the collected data. Lastly, we created an automated
algorithm to generate reports for the city and for the
internal usage. We created two databases to store
patient information and automated reporting and
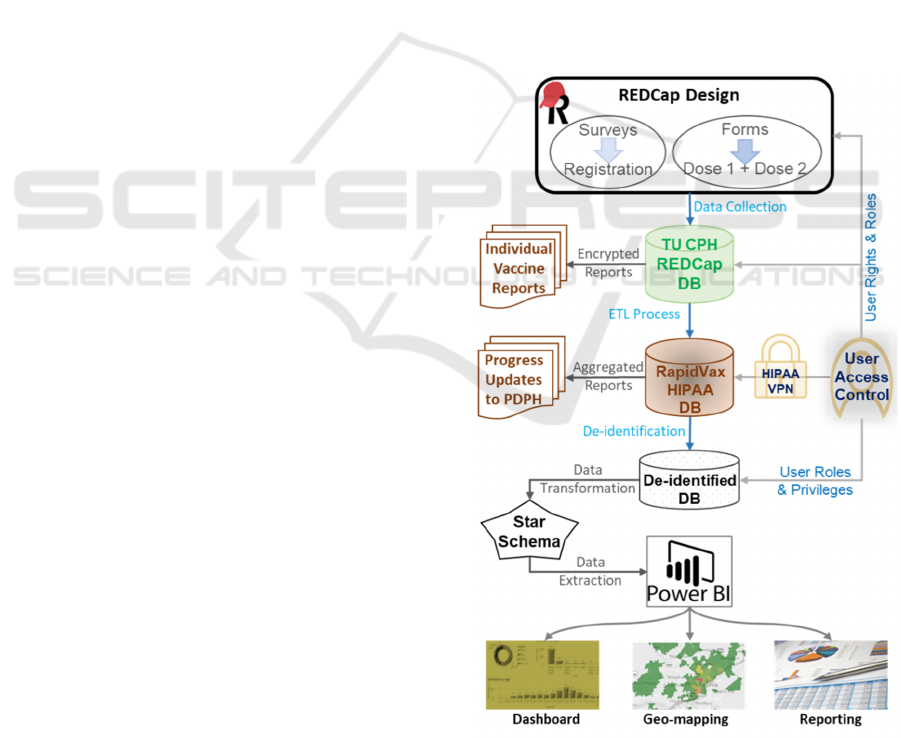
generated a dashboard for data visualization. See
Figure 1 for overall workflow of this project. We
describe each step-in detail below.
Figure 1: The integrated RapidVax platform and secure data
workflow.
A Health IT-Empowered Integrated Platform for Secure Vaccine Data Management and Intelligent Visual Analytics and Reporting
523
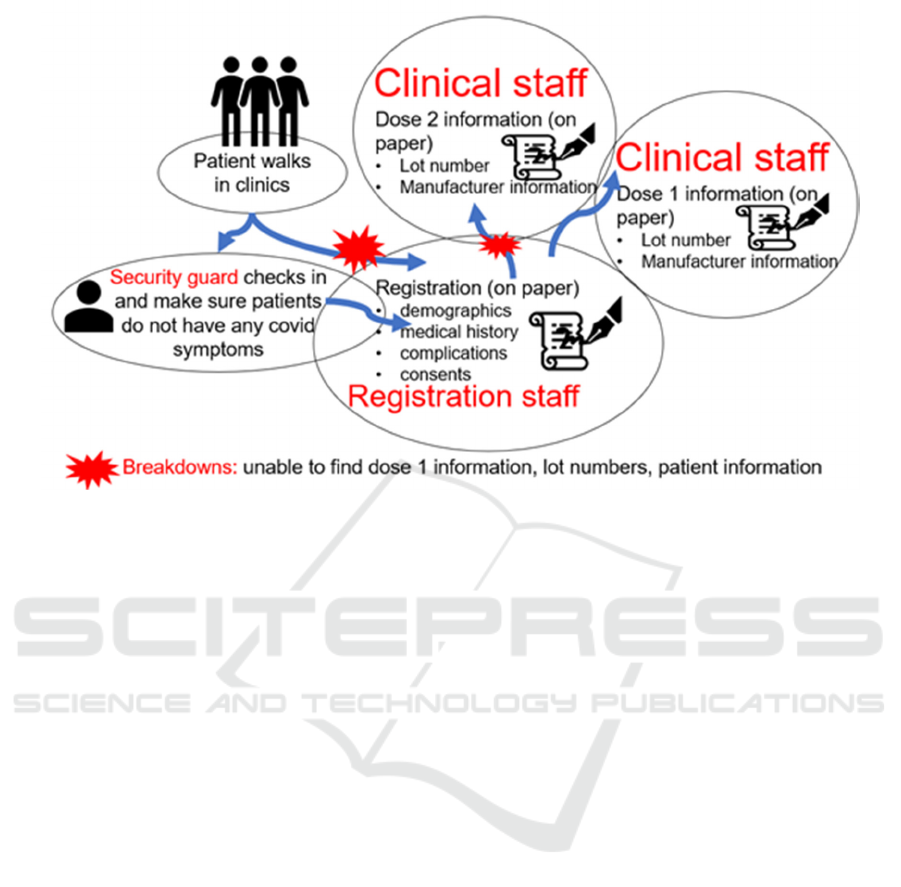
Figure 2: Contextual inquiry to determine the vaccination workflow in RapidVax clinics.
2.1 Observation of Vaccination Clinics
using the Contextual Inquiry
Method
First, using the contextual inquiry method, three
researchers (HW, SVS, LAF) visited the community
and clinic-based vaccination sites (site 1) in person
for at least five times. One of the researchers and
clinicians (SVS) is an Associate Dean for Clinical
Affairs at TU CPH. SVS has visited vaccination sites
at least 15 times to collect the workflow information.
Contextual inquiry is a type of ethnographic field
study that involves in-depth observation and
interviews of a small sample of users to gain a robust
understanding of work practices and behaviours
(Wixon, 1996). As demonstrated in Figure 2,
typically, patients walk in the clinics and are checked
by the security guards. Security guards initially
performed the COVID-19 symptom screenings to
identify anyone who might be infected with COVID.
If patients have symptoms, then they are sent back,
and no vaccination is given. If the individual has no
covid symptoms, they proceed to the registration
table. Individuals have the option to register via a
URL before the get to the vaccination site. If this is
the case the individual is checked in and consented
for the vaccine. If the individual did not register ahead
of time, they are asked to complete a registration form
which includes their demographic information and
the consent. The consent is reviewed by a trained
member of the vaccination staff. These steps were
observed when the contextual inquiry was done,
registration staff used paper for registration. If an
individual is coming for the first dose of vaccine, the
person gets the first dose. The patient is given a
completed Centers for Disease Control and
Prevention (CDC) handwritten card that confirms that
they received the vaccination, date of vaccination,
type, manufacturer of vaccination, and lot number. If
the patient has already received the first dose, they are
asked for their CDC card at the time of registration to
verify which vaccine they received and to validate the
time interval between dose 1 and 2. Upon retrieval
of this information, the second dose of vaccination is
given. The individual’s CDC card is updated with the
second dose of the vaccine confirming their
vaccination date and time, dose number,
manufacturer, and lot number.
While conducting the contextual inquiry, we
found several breakdowns. For instance, many times,
patients will forget their cards to confirm their
previous dose information. As a result, it was very
time-consuming for the registration and clinical staff
to find their information through paper records. In
addition, sometimes the records were missing, and, in
these cases, the team had to register the patients and
rely on patient information. Often, patients provide
different names (e.g., Joe instead of Joseph), which
also hinder in finding reports of these patients.
HEALTHINF 2022 - 15th International Conference on Health Informatics
524
2.2 Information System to Document
Patient Information
After conducting the contextual inquiry, we designed
electronic forms to collect individual’s demographic
information, consent and vaccine information. We
created these forms in REDCap. REDCap is a secure
web application for building and managing online
surveys and databases which was designed by
Vanderbilt University (Harris, 2019). We collected
patients’ basic demographic information in the
patient registration form, such as email address, first
name, last name, gender, date of birth, address, city,
state, zip code, race, ethnicity, and primary language.
While providing dose one and two vaccinations, we
collected information as demonstrated in Table 1. We
followed EUA / FDA COVID 19 guidelines to collect
patient information. We collected this information on
Table 1: Dose 1 and Dose 2 information collection in
REDCap.
Participant information and registration number
Vaccination type (Moderna, Pfizer, Janssen)
Manufacturer (ModernaTx,Inc, Pfizer-BioNTech,
Janssen)
Lot number (open-ended)
Vaccine admin site (left arm, right arm)
Vaccine route admin (open-ended)
Dose number (open-ended)
Vaccine series complete (Yes, No)
Vaccination refusal (Yes, No)
Sickness/fever/being treated for acute illness (Yes,
No)
Prior vaccination in the last 14 days (Yes, No)
Testing positive for Covid-19 in the past 14 days
(Yes, No)
Cosmetic implants such as lip or breast (Yes, No)
History of Guillain bureau syndrome
Women younger than 50 years old should be aware
of the rate risk of blood clots with low platelets after
vaccination and that other Covid-19 vaccines are
available (Janssen only). The individual is asked to
confirm they choose to receive the vaccine.
Consent: I understand that there is no Vaccine
Information Statement (VIS) available for the
vaccine I am receiving today. I have reviewed the
Fact Sheet provided about the vaccine I am to
receive. I understand the benefits and risks of
vaccination and I voluntarily assume full
responsible for reactions that may result. I
understand that I should remain in the vaccine
administration area for 15 minutes of observation
after receiving the vaccine.
the CPH server that is used for further processing in
the following steps. Typically, registration staff have
access to the REDCap and are responsible for the data
collection. We designed surveys and forms are with
rules to check potential data entry errors, validate
input information accuracy (such as age limits or
parent signature for minors), and guarantee that the
required data elements are provided. We also ensure
data privacy with access control, password
protection, and encryption for data collection and
transfer.
2.3 HIPAA Servers and Data
De-identifications
We established two servers: 1) the HIPAA server and
2) non-HIPAA server. The HIPAA-protected
database housing the fully identifiable data can only
be reached via a HIPAA Virtual Private Network
(VPN), enforcing a secure demarcation between the
fully identifiable data. The de-identified data is being
used at the data consumption layer in the non-HIPAA
server for Power BI Dashboards on the webserver.
Privacy preservation is also considered for statistical
analysis.
2.4 Comprehensive Data Fabric
We combined existing data delivery approaches with
innovative use of data integration and preparation as
part of the data operations process. The RapidVax
Data Fabric includes the Data Source Layer (DSL,
bottom in Figure 3), Data Integration Layer (DIL,
middle), and Data Consumption Layer (DCL, top).
The DSL use Health IT standards and policy, tools,
operational databases, VPNs, and cloud data stores.
The DIL prepares data with an iterative and agile
process for finding, combining, cleaning,
transforming, and sharing curated datasets. This layer
will merge data, identify anomalies and patterns, and
review and improve data quality in a repeatable
fashion with a faster time to delivery. The DCL
refreshes the PowerBI Dashboard to ingest the latest
data, perform integrative analysis, geo-mapping
information, and visualize outcomes.
The RapidVax data catalogue starts with DSL,
including individual and collective REDCap projects.
The identifiable data is imported to a MySQL
HIPAA- protected database via DIL weekly through
the extraction, transformation, and loading (ETL)
process for both incremental and full data refreshes.
Each week multiple REDCap project forms are
extracted, unioned, and cleaned before being
imported into the HIPAA secure database. The data
A Health IT-Empowered Integrated Platform for Secure Vaccine Data Management and Intelligent Visual Analytics and Reporting
525
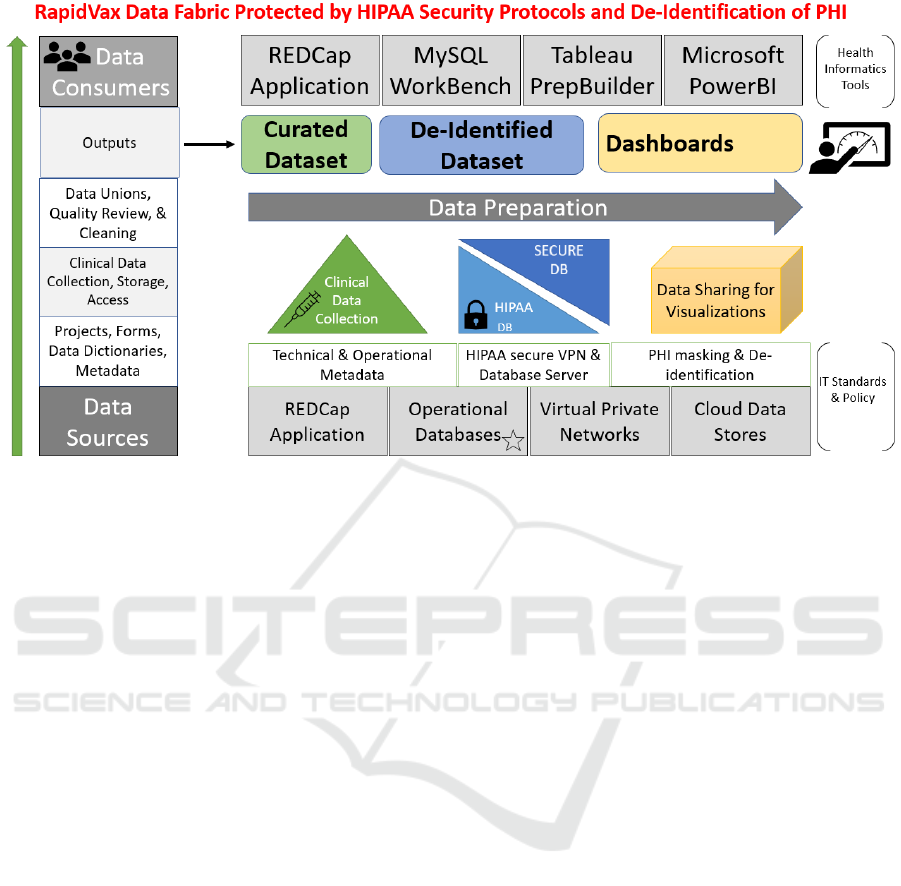
Figure 3: The comprehensive RapidVax data fabric.
model is a traditional analytic star schema in the
HIPAA database and a modern Business Intelligence
Platform for the de-identified database. The stand-
alone data preparation tool, Tableau Prep Builder,
supports data integration functions such as unions and
outputs and data quality improvement with cleaning
steps. The results are then de-identified by removing
PII and imported to the de-identified database and
Power BI visualizations and dashboards.
2.5 Data Quality Check
We developed two data quality matrices that include
completeness and concordance in order to determine
the quality of the data. Completeness is the most
commonly assessed dimension of data quality (Nicole
G. Weiskopf , 2017). Completeness refers to whether
a fact about a patient is present or not in the dataset.
Most studies use the term completeness to describe
this dimension, in addition to data availability or
missing data (N. G. Weiskopf & Weng, 2013). We
considered a record complete if all findings and
information described in section 2.2 are present or not
in the datasets (Reimer, 2016). Concordance was
measured by determining the agreement between the
information recorded during the registration time;
dose 1 information and dose two information are the
same. For example, if a patient received the Moderna
vaccine, then, vaccination type must be “Moderna” in
both dose one and dose two form. However, if the
vaccination type is Moderna in one form and Pfizer
in the second form, then the concordance between
these two information sources will be 0
(disagreement).
We generated concordance reports using Cohen’s
Kappa statistics. Cohen’s Kappa statistics are used to
measure inter-rater agreement between two
annotators/reviewers/data fields. Kappa value
typically falls between 0 to 1. It is interpreted as
follows. values ≤ 0 as indicating no agreement and
0.01–0.20 as none to slight, 0.21–0.40 as fair, 0.41–
0.60 as moderate, 0.61–0.80 as substantial, and 0.81–
1.00 as almost perfect agreement (McHugh, 2012).
2.6 Automated Report Generation
After receiving the raw data from the REDCap server,
we pre-process the data. During the pre-processing,
we converted raw data into an understandable format.
For example, we unionid the same patients’
registration information, dose one, and dose two
information in one text file. Next, we determine the
data quality as demonstrated in section 2.5
(completeness and concordance). Next, if the data is
accurate, then we generate reports. Every week, we
generate two reports, one for internal use (short
report) and one for the PDPH (elaborated report).
These reports are generated automatically using
computer algorithms. If the data quality is poor, we
go back to the REDCap database and ensure the data
consistency and accuracy (see Figure 4).
HEALTHINF 2022 - 15th International Conference on Health Informatics
526
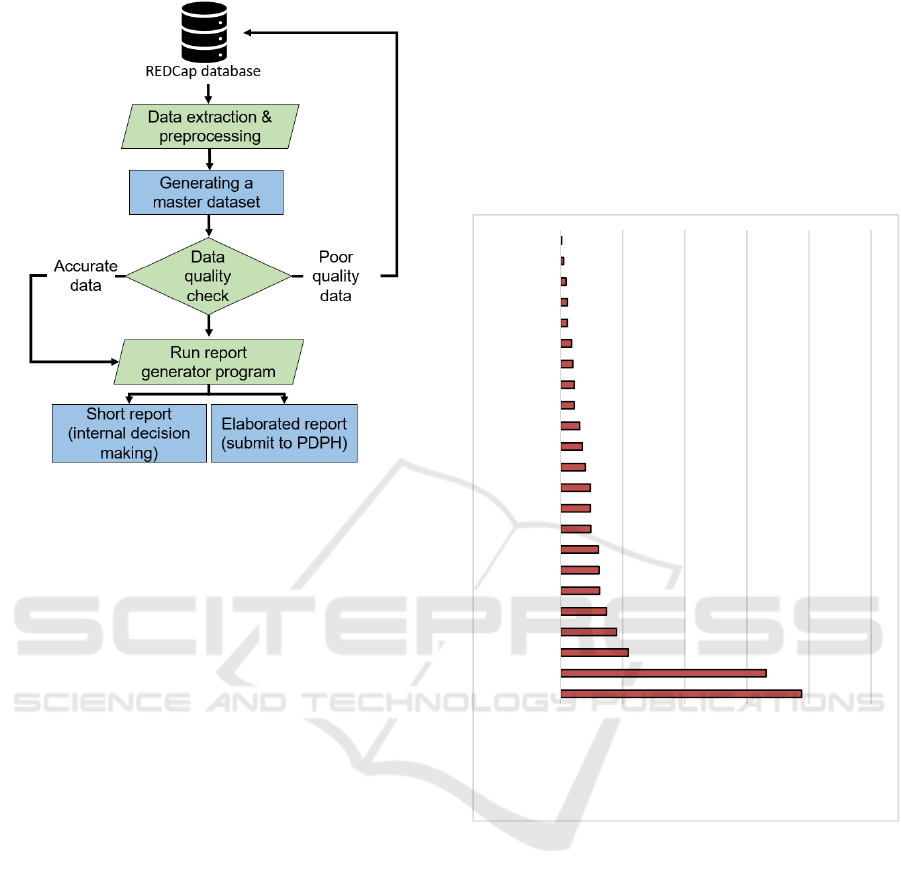
Figure 4: Data processing, data quality, and report
generation process.
2.7 Power BI Dashboard
Last, Integrated data analysis and interactive
visualization of the RapidVax information have been
performed using PowerBI Dashboard and statistical
software to evaluate the program outcomes,
understand patient social determinants of health,
recognize the evolving patterns, identify vaccine
hesitancy, and discover geographic areas and
population groups of focuses. The dashboard is
interactive to explore multiple understand patient
social determinants of health, recognize the evolving
patterns, identify vaccine hesitancy, and discover
geographic areas and population groups of focuses.
The dashboard is interactive to explore multiple
variables with illustrations. We also performed trend
analysis and outcome assessment of the programs.
The trend analysis helps the RapidVax leaders make
evidence-based decision making, such as strategically
adjusting the vaccine types, quantities, and
outreaching approaches to lower vaccine hesitancy
and reduce vaccine wastes.
3 RESULTS
3.1 Total Vaccination and Sites
We vaccinated a total of 3,942 people (including our
CPH staff, students, and faculty) in the Philadelphia,
PA area. As demonstrated in the Figure 5, we visited
a total of 23 sites for vaccination. Detailed
information on the sites is present in Figure 5. As
demonstrated in Figure 6, 45% of our population were
females, 41% males, and the remaining transgender,
third gender, or missing information. Similarly, the
majority of our population consisted of Black or
African American race (44%), followed by White
(18%).
Figure 5: RapidVax vaccination sites.
As demonstrated in Figure 6, 45% of our
population were females, 41% males, and the
remaining transgender, third gender, or missing
information. Similarly, the majority of our population
consisted of Black or African American race (44%),
followed by White (18%). The remaining sample
consisted of Asians, Native Hawaiian, American
Indian, Other, and missing data. Most of our
population (68%) spoke English, followed by
Spanish as demonstrated in Figure 7.
3.2 Data Completeness
Figure 9 demonstrates the completeness of our data.
We discovered that date of birth, manufacturer, and
vaccination series were reported for all patients
0 100 200 300 400 500
Site 1
Site 3
Site 5
Site 7
Site 9
Site 11
Site 13
Site 15
Site 17
Site 19
Site 21
Site 23
Number of vaccinated people at
RapidVax sites
Total Vaccine #
Per Site from
04/18/21 -
10/03/21
A Health IT-Empowered Integrated Platform for Secure Vaccine Data Management and Intelligent Visual Analytics and Reporting
527
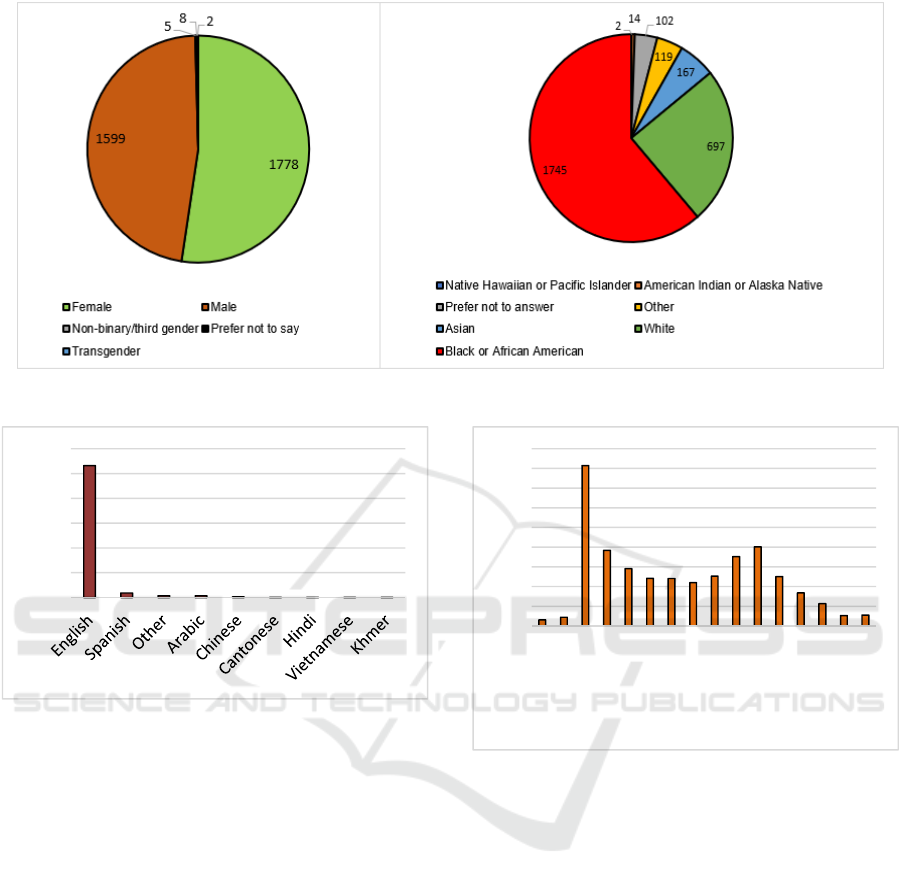
Figure 6: Demographics of RapidVax population.
Figure 7: Spoken language by RapidVax population.
(100%), followed by zip code (99%), prior
vaccination information (98%), vaccination refusal
(97%), and complications (96%).
Completeness of variables such as gender,
vaccine admin site, lot number were between 80 to
90%. Race, language, and ethnicity were recorded for
approximately 70% RapidVax population. ** Lot
numbers must be reported to the Philadelphia
Department of Health 100% of the time, thus missing
lot numbers were corrected in real-time to ensure
completeness of the vaccine record for the department
of health.
3.3 Data Concordance
We determined concordance between the information
recorded in the registration form, dose one, and dose
two forms. The concordance measure between the
person’s name was 0.91 Cohen’s Kappa value.
Similarly, the concordance value for the date of birth
variable, race, gender, and vaccination type was 0.90.
Figure 8: Age distribution of RapidVax population.
In 22 records, we found the vaccination names were
different. Hence, we created an automatic program
that investigates the manufacturer information and
automatically updates the vaccination type
information in the dataset.
3.4 Dashboard
Using the PowerBI statistical software, we visualized
RapidVax population characteristics, demographics,
and vaccination doses (see Figure 10). As
demonstrated in Figure 9, we also determined
geographic areas of vaccinations to make clinical
decisions. This dashboard also helps us with the
program outcomes, understand patient social
determinants of health, recognize the evolving
patterns, identify vaccine hesitancy, and discover
geographic areas and population groups of focuses.
2659
92
37
36
13
2221
0
500
1000
1500
2000
2500
3000
31
44
815
384
291
242
241
220
253
352
402
251
168
113
53
55
0
100
200
300
400
500
600
700
800
900
12-15
16-18
19-25
26-30
31-35
36-40
41-45
46-50
51-55
56-60
61-65
66-70
71-75
76-80
81-85
86 and older
HEALTHINF 2022 - 15th International Conference on Health Informatics
528
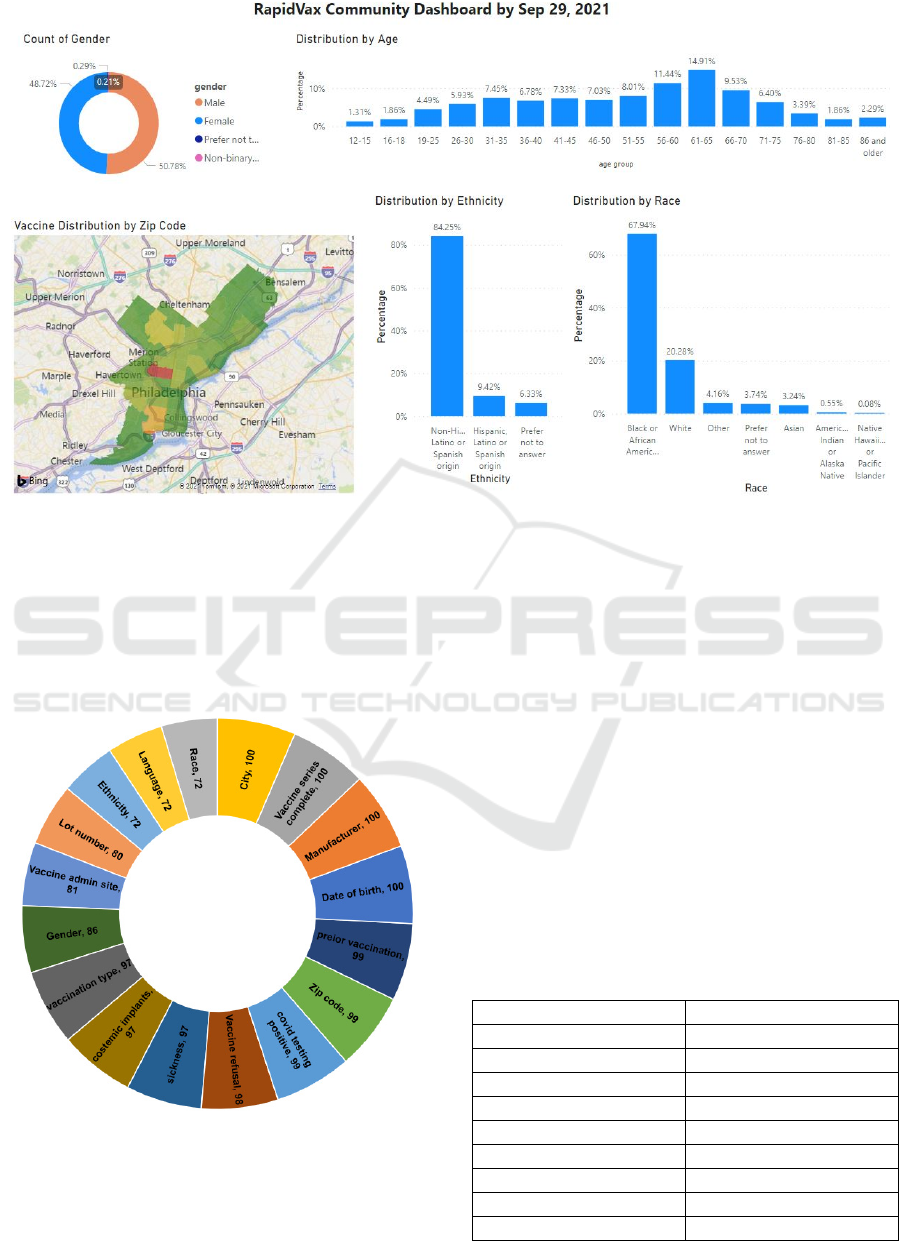
Figure 9: RapidVax Dashboard.
We update this information every week for our staff,
faculty, authorities, and the public for their
knowledge and decision-making.
3.5 Performance of the Automated
Algorithms
Figure 10: RapidVax data completeness.
As demonstrated in the methods section, we
developed an automated algorithm to generate a
report for the city. We evaluated the performance of
the algorithm by conducting a manual review before
implementing it. We manually reviewed a total of 630
patient records (randomly selected). Out of the 630
records, we found 448 true positives, 156 true
negatives, 14 false positives, and 12 false negatives.
Hence, we achieved excellent performances of the
automated algorithms, as demonstrated in Table 2.
Upon conducting an error analysis, we found that
most of the false positive and false negative were into
zip codes and vaccination names. For example,
accurate zip codes are supposed to be five digits, and
they cannot be more or less than five digits. However,
due to the data entry errors, the program missed
identified falsely entered zip codes (e.g., < 5 or > 5
digits of Zip code). Similarly, in some cases, patients
were given the first dose of vaccination; however,
their second dose of vaccination was missing.
Table 2: Performances of the automated programs.
Measures Performance
Sensitivity 97%
Specificity 92%
Precision 96%
Negative pred. value 93%
False-positive rate 7%
False discovery rate 3%
False negative rate 2%
Accuracy 96%
F1 score 97%
A Health IT-Empowered Integrated Platform for Secure Vaccine Data Management and Intelligent Visual Analytics and Reporting
529

4 DISCUSSIONS
This study demonstrated the significance of health IT
tools to help control a public health problem such as
the COVID-19 pandemic. The health IT tools
developed in this study helped our clinicians run the
vaccination task smoothly. The data provided real-
time feedback for quality assurance and process
improvements, such as documentation of the vaccine
Lot number. Moreover, the automated tools
developed in this study helped us to generate reports
in a timely manner to inform authorities, PDPH, and
clinicians to make decisions at the right time. As per
our best knowledge, this is the first study that
attempted to publish detailed report on the health-IT
tools to response to COVID pandemic.
Using the dashboard and reports, in our weekly
RapidVax meetings, we were able to evaluate the
performance of our efforts in recruiting people for
vaccinations. Moreover, the geocoding also helped us
to determine where do we need to stress more efforts
and develop new strategies to provide vaccination
access to more people. For example, in a few areas,
the response from people was low for vaccinations
which we were able to determine from our analytical
model. In these regions, we administrated new
strategies such as giving incentives ($25 per person)
to reward people for vaccinations. In partnership with
the community group, we also gave $5 to $10
McDonald’s gift cards to recruit more people for
vaccinations.
One significant component of this study is that the
RapidVax project is developed by an interprofessional
and interdisciplinary team consisting of computer
scientists, clinicians, informaticians, and public health
experts. As demonstrated in many studies that while
developing health IT tools, involvement of multi-
disciplinary team is extremely important for its success
and this study is a proof of concept of that. Our
contextual inquiry model developed by our clinicians
and informaticians helped us tremendously towards
success of our model (Boote , 2002; Gagnon , 2015;
Lehoux , 2013).
Next, our automated algorithm performed
excellent in generating reports which eliminated
manual review process. Manual review process is
time-consuming, expensive, and most importantly
error prone. Moreover, we went through several
changes in our survey forms to collect patient data as
the FDA (EUA) guidelines changed multiple times as
new knowledge evolved over time about Covid 19.
We will make our survey forms and algorithms
publicly available so other researchers can use this
information for their vaccination tasks. We have also
developed a report on our HIPAA server where
clinicians can query patients by their names, date of
birth, and other demographic variables. This feature
will be useful when we start giving booster doses to
query the patient in our database and make decisions
based on their previous history.
Finally, like any other studies, our study consisted
of some limitations. First, not all information entered
was accurate. As demonstrated in the data
completeness and data concordance sections, we
faced some data quality issue. However, fortunately
we were able to retrieve correct information of most
of the patients (> 90% of patients). Second, many
times patients do not provide their correct names
when they come for the second dose. As a result, our
clinicians were not able to query some patients in the
database. Last, we do not update our dashboard on a
day-to-day basis, but we update once in a week.
Hence, we may miss an opportunity to interpret day
to day vaccination progress. We will address this
limitation in our future work.
5 CONCLUSIONS
This study demonstrated the significance of health IT
tools to help control a public health problem such as
the COVID-19 pandemic. The health IT tools
developed in this study helped our clinicians run the
vaccination task smoothly and efficiently. Moreover,
the automated tools developed in this study helped us
to generate reports in a timely manner to inform
authorities, PDPH, and clinicians to make decisions
at the right time. This approach can be easily
implemented and used by other researchers for their
missions. Moreover, the dashboard developed in this
project help authorities, PDPH, and our college of
public health with decision making and future
planning.
ACKNOWLEDGEMENTS
We would like to acknowledge our students Ms. Ann
Nguyen, Ms. Corinne Nagle, and Mr. Calvin Tran for
their work on merging datasets in SQL workbench.
REFERENCES
Bloom, D. E., Canning, D., & Weston, M. (2017). The
value of vaccination. Fighting the Diseases of Poverty,
214–238. https://doi.org/10.4324/9780203791950-8
HEALTHINF 2022 - 15th International Conference on Health Informatics
530

Boote, J., Telford, R., & Cooper, C. (2002). Consumer
involvement in health research: a review and research
agenda. Health Policy, 61(2), 213–236.
https://doi.org/10.1016/S0168-8510(01)00214-7
COVID-19 Vaccination Clinical and Professional
Resources | CDC. (n.d.). Retrieved October 6, 2021,
from https://www.cdc.gov/vaccines/covid-19/index.
html
Covid in the U.S.: Latest Map and Case Count - The New
York Times. (n.d.). Retrieved October 6, 2021, from
https://www.nytimes.com/interactive/2021/us/covid-
cases.html
DeRoo, S. S., Pudalov, N. J., & Fu, L. Y. (2020). Planning
for a COVID-19 Vaccination Program. JAMA, 323(24),
2458–2459. https://doi.org/10.1001/JAMA.2020.8711
Gagnon, M.-P., Desmartis, M., Gagnon, J., St-Pierre, M.,
Rhainds, M., Coulombe, M., Tantchou, M. D., &
Légaré, F. (2015). Framework For User Involvement In
Health Technology Assessment At The Local Level:
Views Of Health Managers, User Representatives, And
Clinicians. International Journal of Technology
Assessment in Health Care, 31(1–2), 68–77.
https://doi.org/10.1017/S0266462315000070
Gee, J., Marquez, P., Su, J., Calvert, G. M., Liu, R., Myers,
T., Nair, N., Martin, S., Clark, T., Markowitz, L.,
Lindsey, N., Zhang, B., Licata, C., Jazwa, A., Sotir, M.,
& Shimabukuro, T. (2021). First Month of COVID-19
Vaccine Safety Monitoring — United States, December
14, 2020–January 13, 2021. Morbidity and Mortality
Weekly Report, 70(8), 283. https://doi.org/10.15585/
MMWR.MM7008E3
Harris, P. A., Taylor, R., Minor, B. L., Elliott, V.,
Fernandez, M., O’Neal, L., McLeod, L., Delacqua, G.,
Delacqua, F., Kirby, J., & Duda, S. N. (2019). The
REDCap consortium: Building an international
community of software platform partners. Journal of
Biomedical Informatics, 95, 103208. https://doi.org/
10.1016/J.JBI.2019.103208
Lehoux, P., Miller, F. A., Hivon, M., Demers-Payette, O.,
& Urbach, D. R. (2013). Clinicians as health
technology designers: Two contrasting tales about user
involvement in innovation development. Health Policy
and Technology, 2(3), 122–130. https://doi.org/
10.1016/J.HLPT.2013.05.003
McHugh, M. L. (2012). Interrater reliability: The kappa
statistic. Biochemia Medica, 22(3), 276–282.
https://doi.org/10.11613/bm.2012.031
Mizrahi, B., Shilo, S., Rossman, H., Kalkstein, N., Marcus,
K., Barer, Y., Keshet, A., Shamir-Stein, N., Shalev, V.,
Zohar, A. E., Chodick, G., & Segal, E. (2020).
Longitudinal symptom dynamics of COVID-19
infection. Nature Communications 2020 11:1, 11(1), 1–
10. https://doi.org/10.1038/s41467-020-20053-y
Oliver, S. E., Gargano, J. W., Marin, M., Wallace, M.,
Curran, K. G., Chamberland, M., McClung, N.,
Campos-Outcalt, D., Morgan, R. L., Mbaeyi, S.,
Romero, J. R., Talbot, H. K., Lee, G. M., Bell, B. P., &
Dooling, K. (2020). The Advisory Committee on
Immunization Practices’ Interim Recommendation for
Use of Pfizer-BioNTech COVID-19 Vaccine — United
States, December 2020. Morbidity and Mortality
Weekly Report, 69(50), 1922. https://doi.org/
10.15585/MMWR.MM6950E2
Oliver, S. E., Gargano, J. W., Scobie, H., Wallace, M.,
Hadler, S. C., Leung, J., Blain, A. E., McClung, N.,
Campos-Outcalt, D., Morgan, R. L., Mbaeyi, S.,
MacNeil, J., Romero, J. R., Talbot, H. K., Lee, G. M.,
Bell, B. P., & Dooling, K. (2021). The Advisory
Committee on Immunization Practices’ Interim
Recommendation for Use of Janssen COVID-19
Vaccine — United States, February 2021. Morbidity
and Mortality Weekly Report, 70(9), 329.
https://doi.org/10.15585/MMWR.MM7009E4
Reimer, A. P., Milinovich, A., & Madigan, E. A. (2016).
Data quality assessment framework to assess electronic
medical record data for use in research. International
Journal of Medical Informatics, 90, 40–47.
https://doi.org/10.1016/j.ijmedinf.2016.03.006
Weiskopf, N. G., & Weng, C. (2013). Methods and
dimensions of electronic health record data quality
assessment: enabling reuse for clinical research.
Journal of the American Medical Informatics
Association, 20(1), 144–151. https://doi.org/10.1136/
amiajnl-2011-000681
Weiskopf, Nicole G., Bakken, S., Hripcsak, G., & Weng,
C. (2017). A Data Quality Assessment Guideline for
Electronic Health Record Data Reuse. EGEMs
(Generating Evidence & Methods to Improve Patient
Outcomes), 5(1), 14. https://doi.org/10.5334/
egems.218
WHO Coronavirus (COVID-19) Dashboard | WHO
Coronavirus (COVID-19) Dashboard With
Vaccination Data. (n.d.). Retrieved October 6, 2021,
from https://covid19.who.int/
Wixon, D. (1996). Contextual Inquiry: Grounding Your
Design in User’s Work. 18.
A Health IT-Empowered Integrated Platform for Secure Vaccine Data Management and Intelligent Visual Analytics and Reporting
531
