
Predicting Depression in Children and Adolescents using the SHAP
Approach
Marcelo Balbino
1,2
, Renata Santana
2
, Maycoln Teodoro
3
, Mark Song
2
, Luis Z
´
arate
2
and Cristiane Nobre
2
1
Department of Computing and Civil Construction, Federal Center for Technological Education of Minas Gerais, Brazil
2
Department of Computing, Pontifical Catholic University of Minas Gerais University, Brazil
3
Department of Psychology, Federal University of Minas Gerais, Brazil
Keywords:
Depression, Machine Learning, Interpretability, SHAP.
Abstract:
Depression is a disease with severe consequences that affects millions of people, with the onset of the first
symptoms being common in youth. It is essential to identify and treat individuals with depression as early
as possible to prevent the losses caused by the disorder throughout life. However, the diagnostic criteria of
depressive disorders for children/adolescents or adults is not differentiated, even though authors claim that the
particularities of childhood must be considered. This may be why childhood depression is being underdiag-
nosed. Therefore, this work aims to discover the most significant features in diagnosing depression in children
and adolescents through Machine Learning methods and the SHAP approach. Models with Machine Learning
algorithms were developed, and the model with SVM presented the best results. The application of SHAP
proved to be fundamental to deepen the understanding of this model. The experiments indicated that feelings
of isolation, sadness, excessive worry, complaints about one’s appearance, resistance to academic tasks, and
the mother’s schooling are the most significant features in predicting depression in children and adolescents.
Such results can help to understand depression in these individuals and thus lead to appropriate treatment.
1 INTRODUCTION
Depression is a term used to refer to Depressive Dis-
orders, being understood as a pathology that alters
and compromises the body and mind, mainly affect-
ing mood. The individual with Depressive Disorders
may have persistent sadness, lack of interest or plea-
sure in previously rewarding activities, loss of con-
fidence and self-esteem, unjustified feelings of guilt,
ideas of death and suicide, sleep and appetite distur-
bances, fatigue, poor concentration, and symptoms of
anxiety. Its effects can be long-lasting or recurrent
and can affect a person’s ability in essential areas of
functioning (APA et al., 2013; WHO, 2017).
From 2005 to 2015, there was an 18% increase
in people with depression worldwide, resulting in
more than 300 million people (WHO, 2017). Fur-
thermore, it is estimated that one in six people (about
16.67%) will suffer from depression at some point in
their lives, which means more than one billion people
worldwide affected by the disorder (APA, 2017).
Studies indicate that Depressive Disorders have
been the leading cause of illnesses and disabilities in
adolescence (WHO, 2017). In addition, half of the
people who develop mental disorders experience the
first symptoms by 14 years (Yoon et al., 2014). There-
fore, it is essential to identify and treat individuals
with depression in childhood/adolescence to prevent
the losses caused by the disorder throughout life.
The definition of depression in youth is not specif-
ically addressed in the Diagnostic and Statistical
Manual of Mental Disorders (APA et al., 2013). There
is no differentiation of diagnostic criteria for depres-
sive disorders for children, adolescents, or adults.
Nevertheless, authors claim that the peculiarities of
childhood must be considered in the assessment and
diagnosis of depression in children (Quevedo et al.,
2018; Bernaras et al., 2019).
However, one of the obstacles to treating depres-
sion is its assessment and diagnosis, leading to a lack
of treatment or inadequate handling of it (Pavlova and
Uher, 2020). This scenario highlights the importance
of instruments that can support the correct diagnosis.
A survey gave rise to a database containing infor-
mation on 377 children and adolescents with different
depressive symptomatology.
514
Balbino, M., Santana, R., Teodoro, M., Song, M., Zárate, L. and Nobre, C.
Predicting Depression in Children and Adolescents using the SHAP Approach.
DOI: 10.5220/0010842500003123
In Proceedings of the 15th International Joint Conference on Biomedical Engineering Systems and Technologies (BIOSTEC 2022) - Volume 5: HEALTHINF, pages 514-521
ISBN: 978-989-758-552-4; ISSN: 2184-4305
Copyright
c
2022 by SCITEPRESS – Science and Technology Publications, Lda. All rights reserved

Given the high incidence rate of depression and its
peculiarities in children and adolescents, it is essential
to explore the dataset created by that study, making it
a source of knowledge that can support the diagnosis
and actions to help individuals in this age group.
In this context, Machine Learning (ML) meth-
ods are adequate to the mentioned problem as they
have achieved satisfactory results in the extraction of
knowledge from databases. More specifically, ML
systems have been shown to be adequate in support-
ing the diagnosis of diseases (Rav
`
ı et al., 2017).
Advances in the ML area have provided classifi-
cation models with high predictive capacity. How-
ever, in many contexts, it is critical to understand the
model’s decisions. This understanding increases the
knowledge of the problem studied and generates con-
fidence in the results (Karim et al., 2018). Therefore,
in scenarios such as the present work, it is necessary
to provide the interpretability of the models. For this
purpose, an alternative is to use SHapley Additive ex-
Planations (SHAP) (Lundberg and Lee, 2017).
SHAP is an approach to interpreting predictive
models based on cooperative game theory that helps
explain ML models (Lundberg and Lee, 2017). The
approach has resources that allow understanding the
effects of features in individual predictions and their
importance for each class in a classification problem.
Therefore, this work aims to discover, through ML
methods and the SHAP approach, which are the most
significant characteristics in diagnosing depression in
children and adolescents.
Predictive models were developed based on four
ML methods: Decision Tree, Neural Networks, Sup-
port Vector Machines (SVM), and Random Forest.
The SVM-based model achieved the best perfor-
mance, and therefore, SHAP was applied to it.
We believe that the results achieved in this re-
search can help family members, educators, and
health professionals to identify and direct the treat-
ment of children and adolescents with depression,
which is a considerable contribution given the sever-
ity and number of people affected. In addition, the im-
portance of interpretability in problems of this nature
is outstanding, mainly through the SHAP resources.
2 BACKGROUND
2.1 Depression in Children and
Adolescents
Literature has recognized the importance and pres-
ence of depressive conditions in childhood and ado-
lescence (Bahls, 2002; Schwan and Ramires, 2017;
Bernaras et al., 2019). This recognition is relevant
since the need for adequate intervention can prevent
further problems.
According to De Haan et al. (2019), childhood de-
pression is a growing problem, and its main symp-
toms are low self-esteem, fears, sleep disturbances,
enuresis, sadness, abdominal pain, guilt, fatigue, lack
of interest in activities in general, suicidal ideation,
and problems of learning. The causes are related, in
most studies, to psychosocial aspects, that is, loss of
emotional bonds, parental divorce, physical and psy-
chological violence, lack of family support.
Zavaschi et al. (2002) indicate a relationship be-
tween childhood losses and adult depression. Ac-
cording to the authors, children who suffered breaks
in meaningful bonds tended to develop depressive
pathology as adults.
For Bahls (2002), falling school performance is
one of the first indicators of depression in children, in
addition to the development of dysphoria, isolation,
and sadness. Furthermore, some symptoms can be
“recombined” with each other, implying difficulties
in diagnosing childhood depression. Symptoms such
as apathy, weight loss, school refusal, and reduced ap-
petite may be significant for specific diagnoses.
Although the diagnostic criteria are the same as
for adults, in children with depressive disorder, symp-
toms such as anxiety, somatic complaints, and hallu-
cinations are predominant. In adolescents, changes in
sleep and appetite are common. Some authors point
out that suicidal ideation and suicide attempts appear
as aggravation of symptoms (Quevedo et al., 2018).
Even though depression is evaluated as one of the
most frequent problems in clinical practice, it is con-
sidered that it has been underdiagnosed and, as a re-
sult, few patients receive treatment (Bernaras et al.,
2019). Diagnosis can be difficult due to comorbidi-
ties present in depressive conditions. Perhaps because
of this, the symptoms manifest themselves obscurely,
making it impossible or difficult to recognize this
condition in children (Scivoletto and Tarelho, 2002).
Many times the children themselves have difficulties
in identifying and externalizing their symptoms. Still,
parents and professionals identify problems that ini-
tially are not recognized as depression since there
are organic complaints such as headache, abdominal
pain, and diarrhea, which make the referred diagnosis
difficult (Abela and Hankin, 2008).
2.2 Model Interpretability
Complex ML methods (e.g., Random Forest and Neu-
ral Networks) generally have higher predictive perfor-
Predicting Depression in Children and Adolescents using the SHAP Approach
515
mance than traditional models, which are simpler and
more interpretable (e.g., Linear Regression and Deci-
sion Tree). However, specialists need to understand
and trust these models in health-related topics, which
is often impossible due to the lack of intuition and in-
terpretation of their predictions (ElShawi et al., 2020).
In addition, ML methods are often used in sci-
entific research and, therefore, must not only clas-
sify or predict but also answer the “how” and “why”
questions to be consistent with the science objectives.
Consequently, ML models and artificial intelligence
have been used to increase human understanding of
different real-world problems (Karim et al., 2018).
Faced with the need to explain the results gener-
ated by ML models, the scientific community began
to turn its attention to the design of methods aimed
at interpretability. For that, one can make use of in-
trinsically interpretable models, which have presented
limitations in specific scenarios, or methods that pro-
vide post-hoc explanations for the predictions made
by complex models (Kaur et al., 2020).
As illustrated in Figure 1, interpretability meth-
ods introduce a new perspective to ML solutions by
adding an explanation model(g) to the original pre-
diction model( f ). The purpose of these methods is to
present an interpretable approximation of the original
model (Lundberg and Lee, 2017).
Figure 1: How an explanation model is used in predicting
interpretation (Mokhtari et al., 2019).
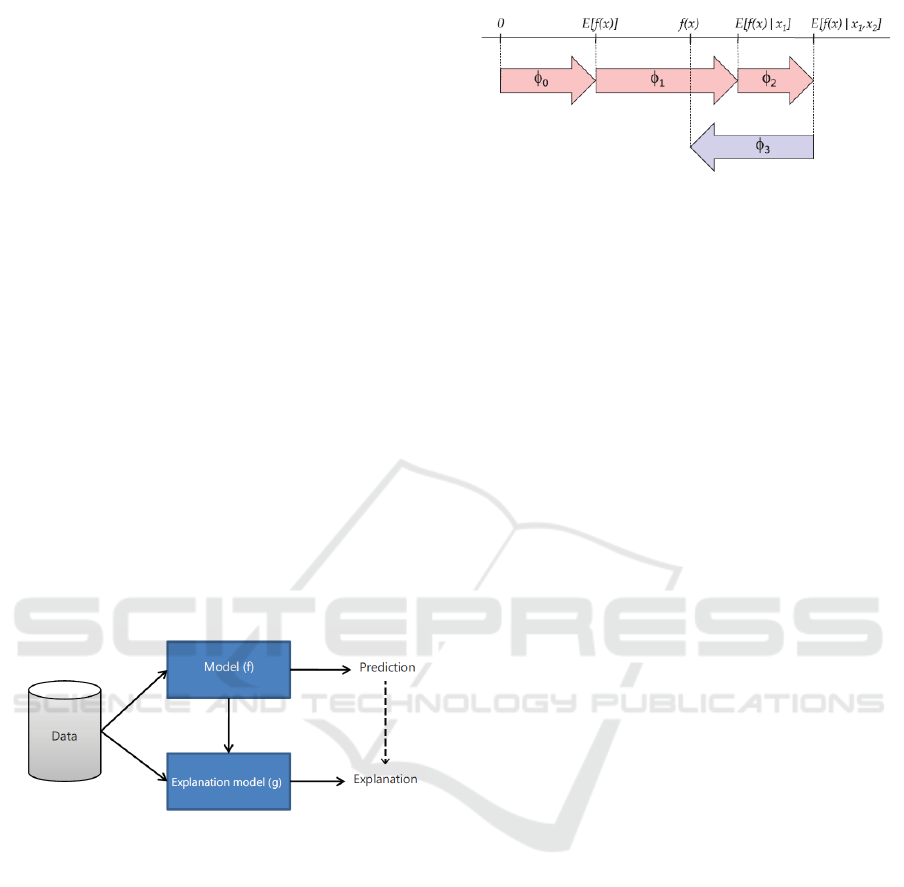
In this sense, Lundberg and Lee (2017) present
SHAP, a framework to interpret ML models. The ap-
proach uses SHAP values as a way to measure the im-
portance of each feature in a prediction. In this way,
each feature impacts a given instance by a value that
can be positive, negative, or zero. As illustrated in
Figure 2, the sum of the effects of all features corre-
sponds to an approximation of prediction f (x) to be
explained. In this case, φ
0
, φ
1
, φ
2
increase the predic-
tion value, while φ
3
decreases the same value. The
values of φ
i
explain how to get from the base value
E[ f (x)], which would be the model’s prediction if no
feature was known for the output f (x) (Lundberg and
Lee, 2017; Mokhtari et al., 2019).
Figure 2: Overview of the SHAP approach (Mokhtari et al.,
2019).
3 RELATED WORKS
We sought to survey research that uses ML for age-
independent depression prediction or other methods
used in works related to depression in children and
adolescents.
Patel et al. (2015) conducted a survey of 68 in-
dividuals applying ML methods to predict late de-
pression and treatment response. The models used
demographic data, cognitive skills, and brain charac-
teristics acquired by multimodal Magnetic Resonance
Imaging (MRI). Among the tested methods, decision
trees estimated the most accurate models for the di-
agnosis of late depression (accuracy of 87.27%) and
response to treatment (accuracy of 89.47%).
In another study, 33 adolescents underwent struc-
tural MRI and were followed for five years to mon-
itor the appearance of clinically significant depres-
sive symptoms. With an SVM-based model, the
researchers tested whether basal cortical thickness
could distinguish adolescents who develop depression
from those who remain free of any disorder. The
research concluded that basal cortical thickness cor-
rectly predicted the future onset of depression with an
accuracy of 70% (Foland-Ross et al., 2015).
Wu et al. (2015) investigated the utility of mul-
tiple neuromorphometric indices (neuron imaging) in
differentiating pediatric patients with unipolar depres-
sion from healthy controls. Scans of 51 depressive
and healthy patients were used, and a model using
SVM was trained to classify the individuals. The
model correctly identified 40 of the 51 individuals.
The results show that multiple neuromorphometric
indices can qualify as a diagnostic marker for pedi-
atric unipolar depression. The work also identified
the most relevant neuromorphometric characteristics
in distinguishing between pediatric unipolar depres-
sion patients and healthy controls.
Yang et al. (2016) used the decision tree for de-
pression classification from the scores of the Patient
Health Questionnaire (PHQ-8) and the characteris-
tics of the participants (PTSD-Depression Diagnos-
tic, sleep-status, feeling, and personality) obtained
HEALTHINF 2022 - 15th International Conference on Health Informatics
516

through the analysis of transcript files of consulta-
tions. The model got an F1-score of 0.571 for the
depressed class and 0.877 for the non-depressed class.
A study based on a sample of 386 adolescent stu-
dents from 5 public schools in Tunisia sought to iden-
tify factors associated with depression and the co-
occurrence with symptoms of anxiety disorders. Data
were collected through a sociodemographic question-
naire and the Beck Depression Inventory. Logistic re-
gression analysis showed an association between de-
pression and female gender, 1st and 4th grades, low
and medium socioeconomic status, school dissatisfac-
tion, and anxiety disorders (Sendi et al., 2018).
Vinnakota and Kaur (2018) evaluated the associ-
ation between depression and internalizing and ex-
ternalizing behaviors in 150 adolescents residing in
institutional homes in India. The PHQ-9 was used
to track depression, and the Strengths and Difficul-
ties Questionnaire was used to score behaviors. The
prevalence of depression was found in 12.7% of ado-
lescents. Depression was significantly associated
with gender and academic achievement. A correlation
was also found between internalizing and externaliz-
ing behaviors with clinical depression.
The use of ML or Statistics methods in the con-
text of depression is noticed, including considering
adolescents. In the studies surveyed involving ML,
there is a prevalence of imaging exams as an input
to the model. However, none of the works found in-
cluded the use of interpretability tools as proposed in
this work. There are works related to the interpretabil-
ity of ML models in different scenarios, including in
the health area (ElShawi et al., 2020; Karim et al.,
2019), but we did not find any that resemble the pro-
posal presented here.
4 METHOD
4.1 Database Description
The database used in this study contains information
on children and adolescents between 10 and 16 years
old, being 158 male and 219 female, totaling 377 in-
stances with different depressive symptomatology.
The database has 75 attributes that include demo-
graphic and social characteristics, as well as scores
obtained from the Children’s Depression Inventory
(CDI) and Young Self Report (YSR) inventories. In
addition, other issues considered necessary by the
mental health community were also included, espe-
cially factors such as anxiety, social problems, lack of
attention, aggression, behavior problems (APA et al.,
2013).
We recognize that the dataset used in this work
does not contain the ideal number of instances. How-
ever, as Mena and Gonzalez (2006) and Pasini (2015)
state, except in extensive epidemiological studies, the
complexity and high cost of experiments usually re-
strict the number of samples available.
4.2 Predicion Models Development
The dataset was preprocessed to fit the selected algo-
rithms better and obtain more consistent models. In
general terms, the following steps were performed:
• Removal of attributes with more than 70% miss-
ing data. In the other missing data, the mode and
the mean were applied as statistical measures to
fill in the data;
• Handling of data inconsistencies;
• Numerical encoding of nominal features;
• Binarization of the values of some features;
• Discretization of the values of some features;
• The dimensionality reduction of the dataset was
performed using a genetic algorithm (GA) to im-
prove the models’ performance. We chose Non-
Dominated Sorting Genetic Algorithm II (NSGA-
II) to find the best subset of features maximiz-
ing its fitness, in this case, the F-measure. The
K-Nearest Neighbors (KNN) classifier was used
to measure the F-measure. The GA was imple-
mented in the Python language, using the DEAP
library. GA selected 34 features for the model;
• Normalization of data in the interval [0,1] to pre-
vent different scales in the values of the features
from impairing the model;
• Initially, the dataset did not include an attribute
to classify individuals by symptomatology. For
this, we obtained the CDI Sum as a depression
score equivalent to the sum of the items present
in the CDI inventory. The CDI Sum can range
from [0, 54]. This score is not sufficient to deter-
mine the existence of the disorder in the individual
but may support the assessment made by a profes-
sional. Based on the recommendation by Kovacs
(Kovacs, 2003), we used the 85th percentile for
high symptomatology, obtaining 63 classified as
“High” symptomatology and 314 as “Low”;
• Random separation of 15% of the instances of
each class to perform the testing step;
• Balancing the remaining 85% of the data us-
ing the SpreadSubsample algorithm present in the
WEKA tool (Singhal and Jena, 2013). Table 1
shows the number of instances reserved per class
for training/validation and testing.
Predicting Depression in Children and Adolescents using the SHAP Approach
517
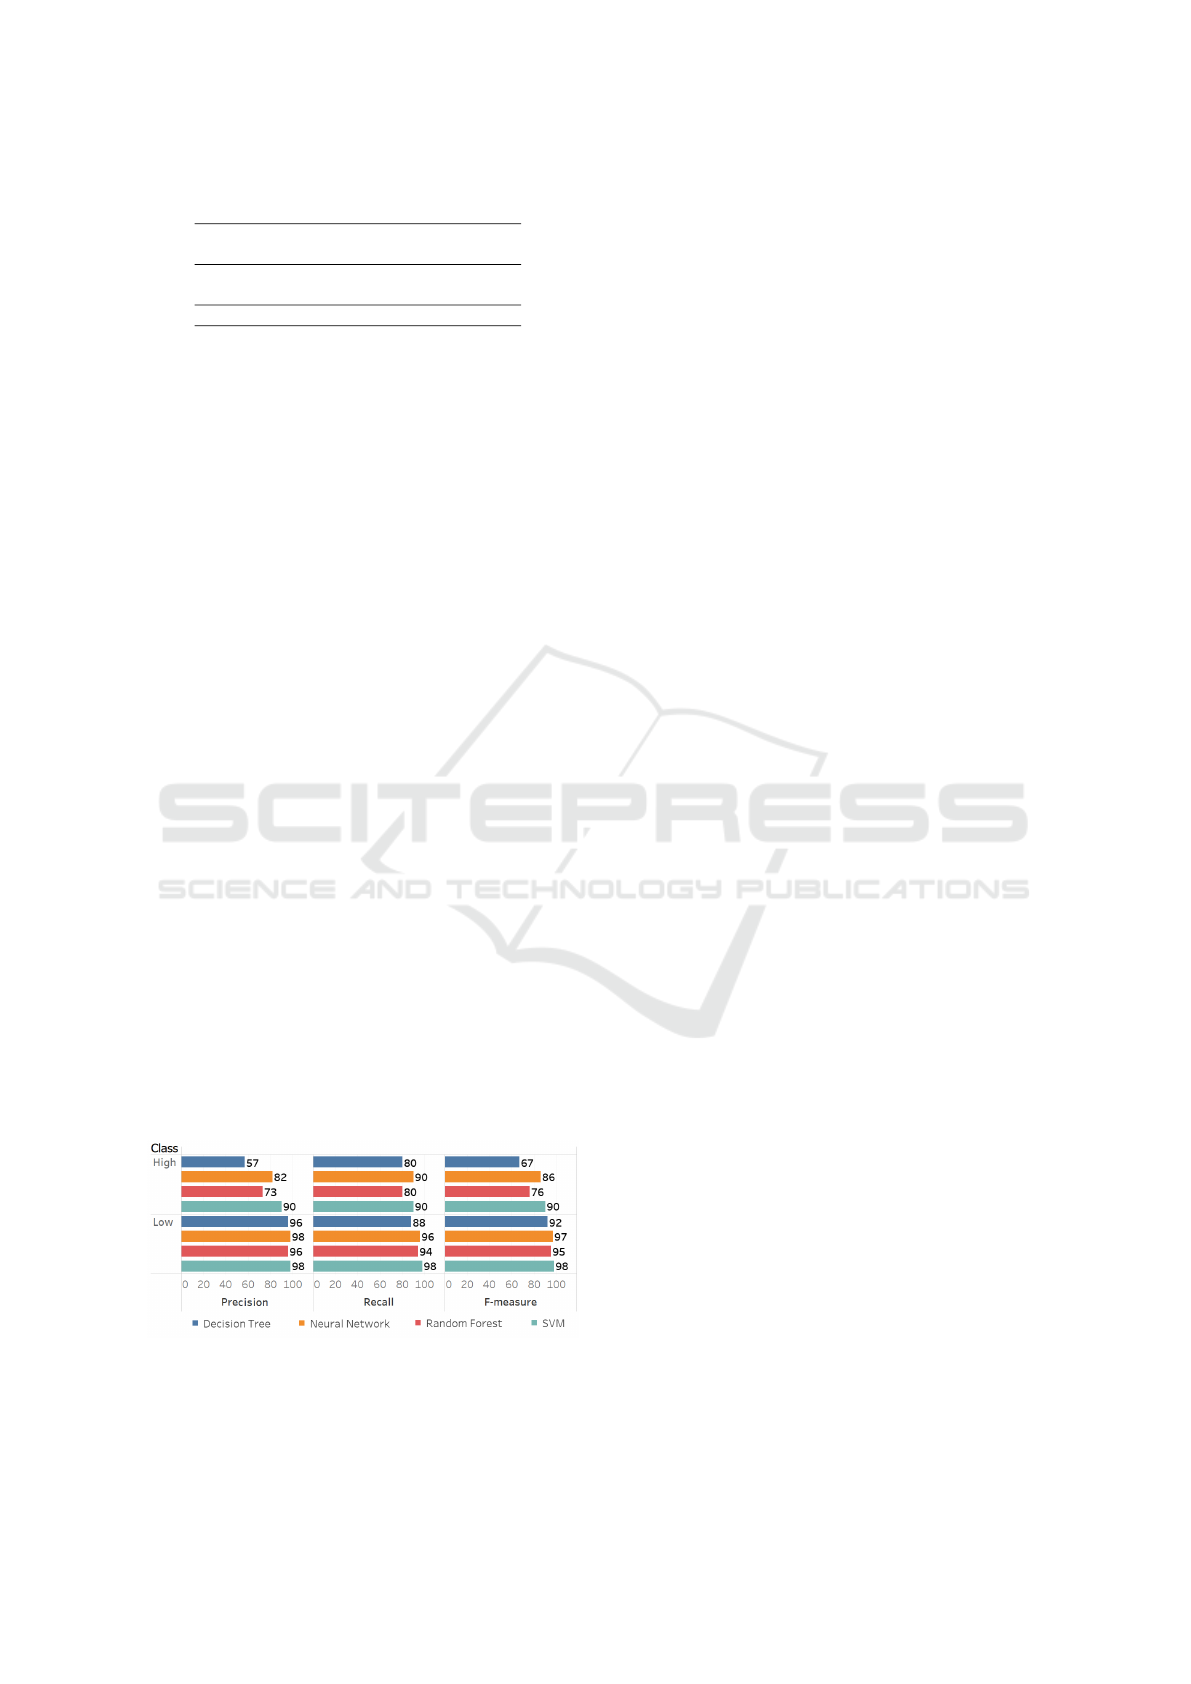
Table 1: Number of instances for training and testing sets.
Class
Preprocessed
Database
Model
Creation
Test
HIGH 63 53 10
LOW 314 53 50
Total 377 106 60
To obtain better predictive capacity, models based
on four ML algorithms were developed: Decision
Tree, Neural Networks, SVM, and Random Forest.
The models were implemented in Python using the
Scikit-learn library. The Precision, Recall, and F-
measure metrics were used to assess the quality of the
models. All classifiers were built and validated using
the k-fold cross-validation process, with k = 10.
The SHAP approach was used only with the best-
performing classification model. As shown in Section
2.2, SHAP generates an explanation model from the
classification model. This explanation model can re-
ceive a sample of data as input and identify the fea-
tures that impacted each prediction of this sample.
We chose to apply the explanation model on the same
set of instances in which the classification model tests
were applied. As a result, SHAP generates plots that
deepen model understanding and identify the most
relevant features in predicting depression.
5 RESULTS
Models were generated with different ML algorithms
aiming at classifying children and adolescents as to
their symptoms. Figure 3 presents the results of the
test phase of the prediction models. Note that for
“Low” symptomatology, all models had an expressive
performance, with slightly superior performance for
the model using SVM with an F-measure of 98%. In
predicting “High” symptomatology, the SVM-based
model obtained the best performance with an F-
measure of 90%. That is why we developed the in-
terpretability with SHAP for this model.
Figure 3: Models performance evaluation.
The features mentioned in the description of the
experiments are listed in Table 2, as well as the nu-
merical transformation of their values. It is notewor-
thy that the values referring to the features were nor-
malized, which can make it difficult to read the data.
Figure 4 corresponds to one of the plots generated
by SHAP, called Summary Plot, which presents an
overview of the most significant features in predict-
ing depression symptomatology. This plot orders the
features by their importance. Summary Plot uses the
SHAP values to show the distribution of impacts that
each feature has on the model’s output. Each point
present on the line for a given feature represents a
child or adolescent impacted by this feature. Suppose
a point is on the right side of the central axis. In that
case, this feature influences the individual towards the
“High” symptomatology class. The farther away from
the central axis, the more significant the impact of that
feature on that individual. Likewise, if the instance
is on the left, the same feature moves it towards the
“High” symptomatology class. It is noteworthy that
the influence of a feature alone does not define the in-
dividual’s class. The point color represents the value
of the feature in the instance, red to high values and
blue to low values.
Regarding the explanations that we can extract for
the problem in question, it is remarkable that CDI20
is the feature of a more significant influence in pre-
dicting an individual’s symptomatology for depres-
sion. Thus, for the model, the feeling of loneliness
is what most evidence depression.
Other CDIs appear in the sequence, such as CDI11
which highlights excessive levels of worry as a promi-
nent influencing factor for prediction as “High” symp-
tomatology, which especially when dealing with a
child or adolescent, should not be typical. The CDI14
and CDI25 are related to low self-esteem of individ-
uals prone to depression. The CDI15 highlights the
lack of motivation with school activities as another
prominent influencing factor for the “High” symp-
tomatology. Still, with an important influence is the
CDI1 related to constant sadness.
The explanation model also highlights a relation-
ship between the mother’s schooling level and pre-
dicting symptoms in children and adolescents. The
plot indicates a positive impact for mothers with com-
plete graduate. We believe that this feature may relate
to the more significant support and confidence these
individuals receive from their mothers. It is important
to emphasize that the influence of the father’s educa-
tion on the child’s depression situation was not ob-
served in the experiments carried out.
Park et al. (2013) obtained similar results. The
authors concluded that mothers with a higher level
of education might have more confidence in dealing
with the difficulties arising from child-rearing. Such
HEALTHINF 2022 - 15th International Conference on Health Informatics
518
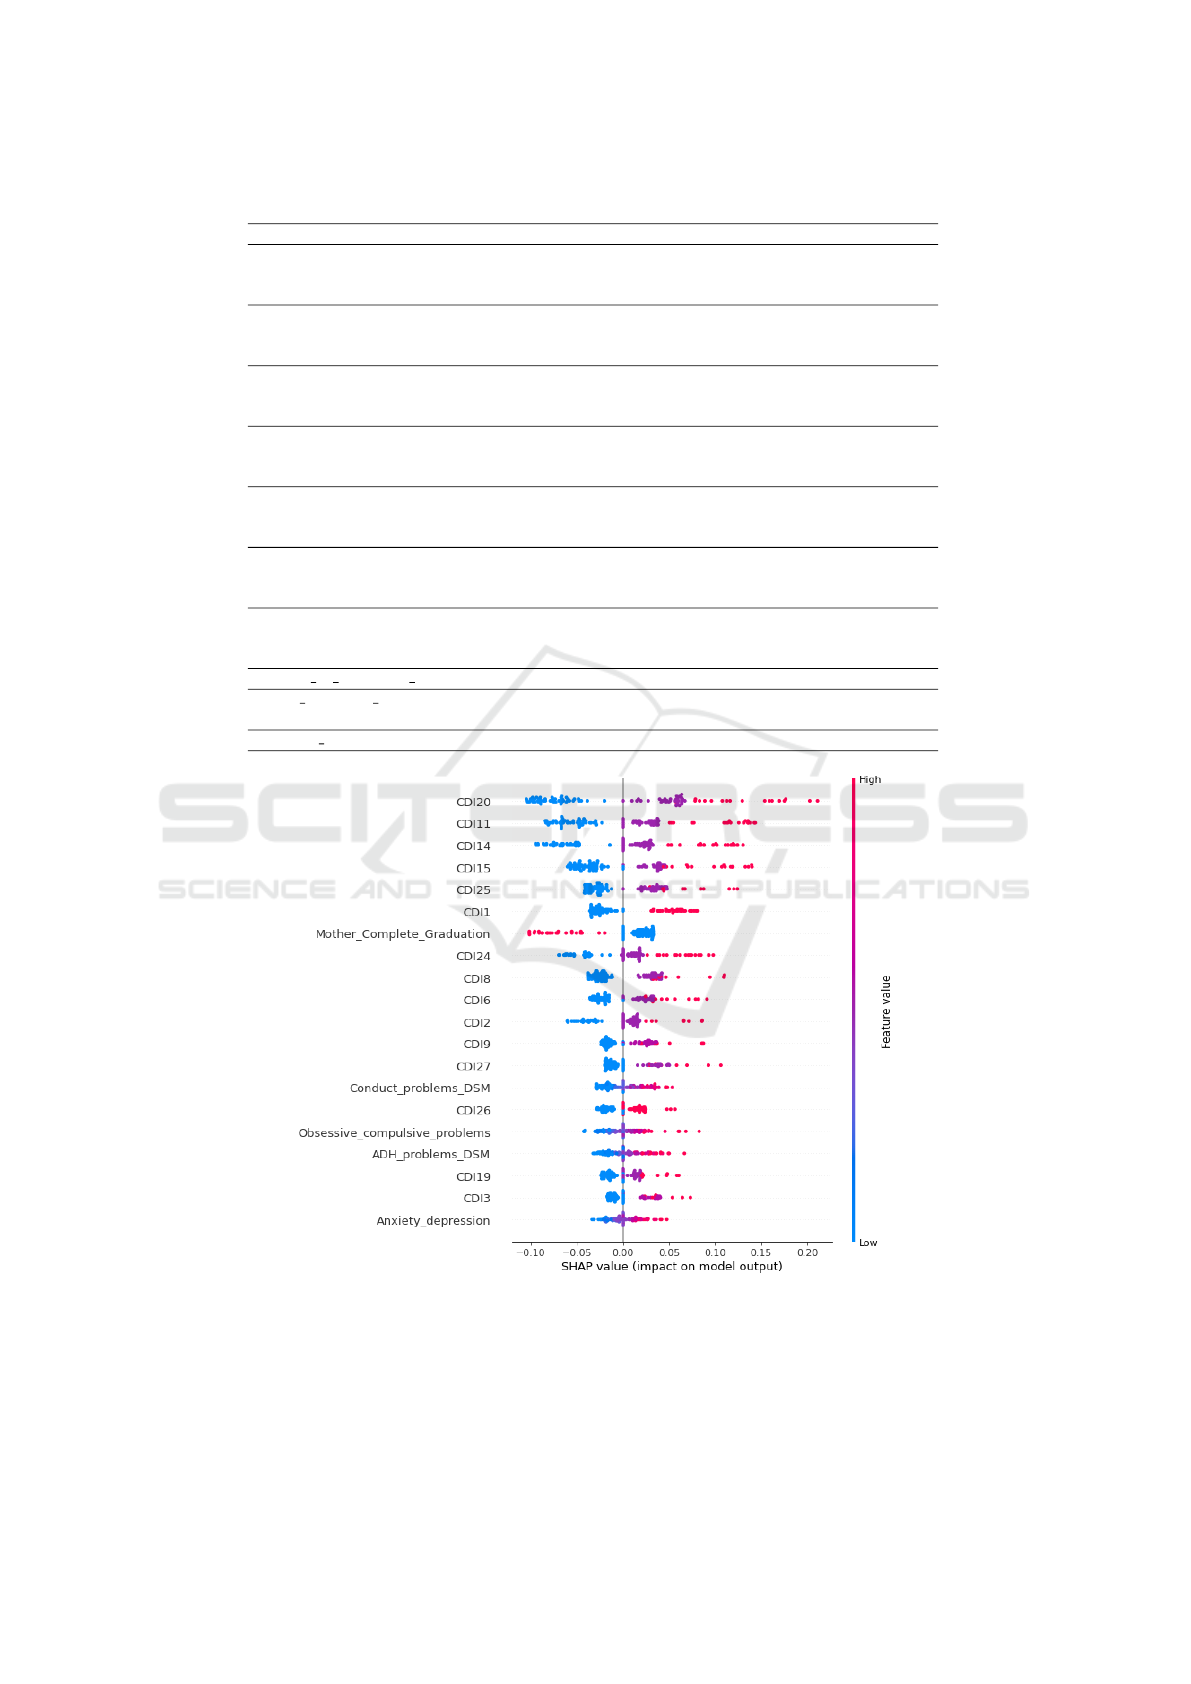
Table 2: Features highlighted in the explanation models.
Feature Domain
CDI1
I get sad from time to time (0)
I am often sad (0.5)
I’m always sad (1)
CDI11
I get worried from time to time (0)
I get worried often (0.5)
I always feel worried (1)
CDI14
I am satisfied with my appearance (0)
My appearance has some downsides (0.5)
I’m ugly (1)
CDI15
Doing homework is not a big problem for me (0)
I am often pressured to do my homework (0.5)
I have to force myself to do my homework (1)
CDI20
I don’t feel alone (0)
I feel alone often (0.5)
I always feel alone (1)
CDI24
I am as good as the other children (0)
If I want, I can be as good as the other children (0.5)
I can’t be as good as the other children (1)
CDI25
I’m sure someone loves me (0)
I’m not sure if anyone loves me (0.5)
Nobody really likes me (1)
School M Complete Graduation No (0), Yes (1)
ADH problems DSM
(Attention Deficit and Hyperactivity)
[0, 1]
Anxiety depression [0, 1]
Figure 4: Impact of features on depression symptomatology.
an attitude of greater confidence and a sense of self-
mastery serves as a role model for their children. The
authors also observed that the father’s education level
had no impact on the children’s depression.
Figure 5 is another SHAP plot called Force plot
which allows us to visualize an individual prediction.
The features that lead the prediction for the “High”
class are shown in red. Those that distance the pre-
diction for this same class are in blue.
Predicting Depression in Children and Adolescents using the SHAP Approach
519

Figure 5: Individual predictions.
Figure 5 (a) shows a child or adolescent predicted
to be “ Low” symptomatology. The absence of prob-
lems related to loneliness, excessive worry, academic
issues, self-esteem, or acceptance of appearance con-
tribute to the prediction as “Low” symptomatology.
However, the mother’s level of education has a nega-
tive impact.
Figure 5 (b) exemplifies an individual with “High”
symptomatology prediction. In this case, feelings
of loneliness, negative evaluation of one’s appear-
ance, and the presence of comorbidities of Attention-
Deficit/Hyperactivity and Depression and Anxiety are
the main issues that led to the prediction as “High”
symptomatology. The individual has a positive as-
sessment regarding schoolwork, but not enough to
change the prediction.
6 CONCLUSIONS
This research sought to recognize the profile of chil-
dren and adolescents with depression, identifying the
most significant features for predicting their symp-
tomatology. The studies highlighted the theme’s rel-
evance, given the number of people affected and the
severity of the consequences related to depressive dis-
orders. Considering that such conditions often start in
youth, it is essential to identify them as early as pos-
sible to prevent the damage caused from continuing.
Some ML methods were tested to predict the indi-
vidual’s symptomatology and the SVM proved to be
the most suitable for the scenario in question. Further-
more, the SHAP approach proved essential for under-
standing model decisions and highlighting the most
important features.
In general terms, the experiments indicated that
feelings related to isolation, sadness, excessive worry,
complaints about one’s appearance, and resistance
to academic tasks are the most significant features
in predicting depression symptomatology in children
and adolescents. Therefore, we understand that such
feelings and actions deserve attention from those
close to young people when perceived at excessive
levels. On the other hand, the explanation model
highlighted the mother’s schooling, with a positive
influence for mothers with higher schooling levels,
highlighting the importance of family care.
ACKNOWLEDGEMENTS
The authors thank the National Council for Scientific
and Technological Development of Brazil (CNPq -
Conselho Nacional de Desenvolvimento Cient
´
ıfico e
Tecnol
´
ogico), the Coordination for the Improvement
of Higher Education Personnel - Brazil (CAPES), the
Foundation for Research Support of Minas Gerais
State (FAPEMIG), the Federal Center for Techno-
logical Education of Minas Gerais (CEFET-MG), the
Federal University of Minas Gerais (UFMG), and the
Pontifical Catholic University of Minas Gerais (PUC
Minas).
REFERENCES
Abela, J. R. and Hankin, B. L. (2008). Handbook of depres-
sion in children and adolescents. Guilford Press, New
York, NY, USA.
APA (2017). Depression. https://www.psychiatry.
org/psychiatrists/practice/quality-improvement/
quality-measures-for-mips-quality-category.
APA, A. P. A. et al. (2013). Diagnostic and statistical man-
ual of mental disorders (DSM-5®). American Psychi-
atric Pub, Washington, D.C.
Bahls, S.-C. (2002). Aspectos cl
´
ınicos da depress
˜
ao
em crianc¸as e adolescentes. Jornal de Pediatria,
78(5):359–366.
Bernaras, E., Jaureguizar, J., and Garaigordobil, M. (2019).
Child and adolescent depression: a review of theo-
HEALTHINF 2022 - 15th International Conference on Health Informatics
520

ries, evaluation instruments, prevention programs and
treatments. Frontiers in Psychology, 10:543.
De Haan, A., Landolt, M., Fried, E., Kleinke, K., Alisic,
E., Bryant, R., Salmon, K., Chen, S.-H., Liu, S.-T.,
Dalgleish, T., et al. (2019). Dysfunctional posttrau-
matic cognitions, posttraumatic stress, and depression
in children and adolescents exposed to trauma: A net-
work analysis. Journal of Child Psychology and Psy-
chiatry.
ElShawi, R., Sherif, Y., Al-Mallah, M., and Sakr, S. (2020).
Interpretability in healthcare: A comparative study
of local machine learning interpretability techniques.
Computational Intelligence.
Foland-Ross, L. C., Sacchet, M. D., Prasad, G., Gilbert, B.,
Thompson, P. M., and Gotlib, I. H. (2015). Cortical
thickness predicts the first onset of major depression
in adolescence. International Journal of Developmen-
tal Neuroscience, 46:125 – 131.
Karim, A., Mishra, A., Newton, M., and Sattar, A. (2018).
Machine learning interpretability: A science rather
than a tool. arXiv preprint arXiv:1807.06722.
Karim, M. R., Cochez, M., Beyan, O., Decker, S., and
Lange, C. (2019). Onconetexplainer: explainable pre-
dictions of cancer types based on gene expression
data. In 2019 IEEE 19th International Conference
on Bioinformatics and Bioengineering (BIBE), pages
415–422. IEEE.
Kaur, H., Nori, H., Jenkins, S., Caruana, R., Wallach, H.,
and Wortman Vaughan, J. (2020). Interpreting inter-
pretability: Understanding data scientists’ use of in-
terpretability tools for machine learning. In Proceed-
ings of the 2020 CHI Conference on Human Factors
in Computing Systems, pages 1–14.
Kovacs, M. (2003). Children’s Depression Inventory (CDI):
Technical Manual Update. Multi-Health Systems, In-
corporated.
Lundberg, S. M. and Lee, S.-I. (2017). A unified approach
to interpreting model predictions. In Proceedings of
the 31st international conference on neural informa-
tion processing systems, pages 4768–4777.
Mena, L. J. and Gonzalez, J. A. (2006). Machine learning
for imbalanced datasets: Application in medical diag-
nostic. In Flairs Conference, pages 574–579.
Mokhtari, K. E., Higdon, B. P., and Bas¸ar, A. (2019). In-
terpreting financial time series with shap values. In
Proceedings of the 29th Annual International Confer-
ence on Computer Science and Software Engineering,
pages 166–172.
Park, A. L., Fuhrer, R., and Quesnel-Vall
´
ee, A. (2013). Par-
ents’ education and the risk of major depression in
early adulthood. Social Psychiatry and Psychiatric
Epidemiology, 48(11):1829–1839.
Pasini, A. (2015). Artificial neural networks for small
dataset analysis. Journal of thoracic disease,
7(5):953.
Patel, M. J., Andreescu, C., Price, J. C., Edelman, K. L.,
Reynolds, C. F., and Aizenstein, H. J. (2015). Ma-
chine learning approaches for integrating clinical and
imaging features in late-life depression classification
and response prediction. International Journal of
Geriatric Psychiatry, 30(10):1056–1067.
Pavlova, B. and Uher, R. (2020). Assessment of psy-
chopathology: Is asking questions good enough?
JAMA psychiatry, 77(6):557–558.
Quevedo, J., Nardi, A. E., and da Silva, A. G. (2018). De-
press
˜
ao-: Teoria e Cl
´
ınica. Artmed Editora, Brasil.
Rav
`
ı, D., Wong, C., Deligianni, F., Berthelot, M., Andreu-
Perez, J., Lo, B., and Yang, G.-Z. (2017). Deep learn-
ing for health informatics. IEEE journal of biomedical
and health informatics, 21(1):4–21.
Schwan, S. and Ramires, V. R. R. (2017). Depress
˜
ao em
crianc¸as: Uma breve revis
˜
ao de literatura. Psicologia
Argumento, 29(67).
Scivoletto, S. and Tarelho, L. G. (2002). Depress
¨
ao
na inf
ˆ
ancia e adolesc
ˆ
encia. RBM rev. bras. med,
59(8):555–558.
Sendi, I., Chouikh, A., Ammar, A., and Bouafia, N. (2018).
Depression in a sample of tunisian adolescents: preva-
lence, associated factors and comorbidity with anx-
iety disorders. International journal of adolescent
medicine and health.
Singhal, S. and Jena, M. (2013). A study on weka tool for
data preprocessing, classification and clustering. In-
ternational Journal of Innovative technology and ex-
ploring engineering (IJItee), 2(6):250–253.
Vinnakota, A. and Kaur, R. (2018). A study of depres-
sion, externalizing, and internalizing behaviors among
adolescents living in institutional homes. Interna-
tional Journal of Applied and Basic Medical Re-
search, 8(2):89.
WHO, W. H. O. (2017). Depression and other common
mental disorders: global health estimates. http://www.
who.int/iris/handle/10665/254610.
Wu, M.-J., Wu, H. E., Mwangi, B., Sanches, M., Selvaraj,
S., Zunta-Soares, G. B., and Soares, J. C. (2015). Pre-
diction of pediatric unipolar depression using multiple
neuromorphometric measurements: A pattern classi-
fication approach. Journal of Psychiatric Research,
62:84 – 91.
Yang, L., Jiang, D., He, L., Pei, E., Oveneke, M. C., and
Sahli, H. (2016). Decision Tree Based Depression
Classification from Audio Video and Language Infor-
mation. In Proceedings of the 6th International Work-
shop on Audio/Visual Emotion Challenge - AVEC ’16,
AVEC ’16, pages 89–96, New York, NY, USA. ACM.
Yoon, S., Taha, B., and Bakken, S. (2014). Using a data
mining approach to discover behavior correlates of
chronic disease: A case study of depression. In Stud-
ies in Health Technology and Informatics, volume
201, pages 71–78.
Zavaschi, M. L. S., Satler, F., Poester, D., Vargas, C. F., Pi-
azenski, R., Rohde, L. A. P., and Eizirik, C. L. (2002).
Associac¸
˜
ao entre trauma por perda na inf
ˆ
ancia e de-
press
˜
ao na vida adulta. Revista brasileira de psiquia-
tria= Brazilian journal of psychiatry. S
˜
ao Paulo, SP.
Vol. 24, n. 4 (out. 2002), p. 189-195.
Predicting Depression in Children and Adolescents using the SHAP Approach
521
