
Effect of Errors on the Evaluation of Machine Learning Systems
Vanessa Bracamonte, Seira Hidano and Shinsaku Kiyomoto
KDDI Research, Inc., Saitama, Japan
Keywords:
User Perception, Errors, Machine Learning Model Evaluation, User Study.
Abstract:
Information such as accuracy and outcome explanations can be useful for the evaluation of machine learning
systems, but they can also lead to over-trust. This means that an evaluator may not have suspicion that a
machine learning system could have errors, and that they may overlook problems in the explanation of those
systems. Research has shown that errors not only decrease trust but can also promote curiosity about the
performance of the system. Therefore, presenting errors to evaluators may be an option to induce suspicion
in the context of the evaluation of a machine learning system. In this paper, we evaluate this possibility by
conducting three experiments where we asked participants to evaluate text classification systems. We presented
two types of errors: incorrect predictions and errors in the explanation. The results show that patterns of errors
in explanation negatively influenced willingness to recommend a system, and that fewer participants chose
a system with higher accuracy when there was an error pattern, compared to when the errors were random.
Moreover, more participants gave evidence from the explanations in their reason for their evaluation of the
systems, suggesting that they were able to detect error patterns.
1 INTRODUCTION
Many machine learning systems are black boxes and
their behavior is sometimes not well understood, even
by developers. Consequently, the process for testing
machine learning models is more complicated than
for other types of systems. This is due to incomplete
understanding of what the models are doing and due
to logic complexity (Amershi et al., 2019). In addi-
tion, accuracy and other performance metrics are not
perfect indicators of the behavior of a model, in par-
ticular for issues such as bias.
Multiple techniques have been proposed to ad-
dress this issue and support the evaluation of mod-
els (Adadi and Berrada, 2018; Mittelstadt et al.,
2019). Interpretability methods have been developed
to provide information about the behavior of machine
learning models, with the objective of understanding
model performance (Ribeiro et al., 2016; Lundberg
and Lee, 2017; Guidotti et al., 2018). There are also
evaluation tools that have been developed to aid both
experts and non-experts examine models in more de-
tail, and which make use of interpretability methods.
One example is LIT (Tenney et al., 2020), a tool for
the evaluation of NLP models. In addition to perfor-
mance metrics and functions to explore the output of a
model, the tool also leverages different interpretabil-
ity methods to provide visualization of explanations
of model predictions.
Explanations can help users understand how cer-
tain systems make decisions (Cheng et al., 2019).
However, research has indicated that explanations can
lead to over-trust, even for experts such as data scien-
tists (Kaur et al., 2020). Although explanations could
help understand the behavior of a machine learning
system, having explanations does not necessarily re-
sult in a better evaluation of the system (Kaur et al.,
2020). In the context of use, the presence of er-
rors can have an effect on trust and reliance in au-
tomated systems (de Vries et al., 2003; Dzindolet
et al., 2003; Sanchez et al., 2014; Hoff and Bashir,
2015; Sauer et al., 2016; Nourani et al., 2020). In
this context, users encounter the errors when they oc-
cur; in contrast, in an evaluation context, evaluators
should detect errors. Research in error detection indi-
cates that error suspicion can overcome complacency
in the evaluation of automated systems (Kontogian-
nis, 1999). However, if explanations can lead to over-
trust, then an evaluator may not have suspicion that
a highly accurate machine learning model could have
errors. Presenting errors to evaluators may be an op-
tion to induce suspicion in the context of the evalua-
tion of a machine learning systems.
In this paper, we evaluate this possibility with two
48
Bracamonte, V., Hidano, S. and Kiyomoto, S.
Effect of Errors on the Evaluation of Machine Learning Systems.
DOI: 10.5220/0010839300003124
In Proceedings of the 17th International Joint Conference on Computer Vision, Imaging and Computer Graphics Theory and Applications (VISIGRAPP 2022) - Volume 2: HUCAPP, pages
48-57
ISBN: 978-989-758-555-5; ISSN: 2184-4321
Copyright
c
2022 by SCITEPRESS – Science and Technology Publications, Lda. All rights reserved

types of errors: incorrect model predictions which are
explicitly identified as errors, and errors in explana-
tions, which are not explicitly identified as errors. We
conducted three experiments, where we asked partic-
ipants to evaluate movie review classification systems
based on example predictions and explanations. We
measured how the two type of errors affected par-
ticipants’ willingness to recommend and choose be-
tween systems, and how they affected participants’
stated reasons for their judgements. The results show
that errors, in particular error patterns, not only neg-
atively affected evaluation judgement and perception,
but also resulted in more participants reporting evi-
dence from the explanations in their reason for rec-
ommendation or choice, compared to reporting accu-
racy.
2 RELATED WORK
Error detection is considered the first process for han-
dling errors (Kontogiannis, 1999). This process re-
quires vigilance, but this is hindered by complacency
and a lack of understanding of the limitations of a sys-
tem (Kontogiannis, 1999). Cognitive bias, defined as
not considering information that challenges conclu-
sions (Sanderson and Murtagh, 1990), can also inter-
fere with error detection. The evaluation of automated
systems can be influenced by factors which may not
be necessarily related to performance, such as trust
perception (Lee and See, 2004; Bussone et al., 2015)
or the system’s user experience characteristics (Frison
et al., 2019).
In addition, users do not normally seek negative
information (Nickerson, 1998), although there are cir-
cumstances in which they do. Research on machine
learning systems for medical decision-making has re-
ported that domain experts that encounter an unex-
pected result in the system can start to wonder about
errors (Cai et al., 2019). In the study, the domain ex-
perts that encountered unexpected system results de-
viated from their assigned task and started to test the
systems’ response to different conditions. The un-
expected system result in this case appears to have
induced both error suspicion and curiosity about the
machine learning system’s performance.
Not seeking negative information is a behavior
that can also be observed in experts when using tools
for machine learning model explanation (Kaur et al.,
2020). Evaluators can put too much trust in the vi-
sualization and tool itself, which leads to viewing the
results without suspicion that the models could have
errors (Kaur et al., 2020). On the other hand, research
shows that users can rely on errors in explanations to
evaluate machine learning models, if the error is de-
tected. In the evaluation of the LIME interpretabil-
ity method (Ribeiro et al., 2016), a model was inten-
tionally trained to predict based on the background
instead of on the subject of an image’: a snow back-
ground was identified as important for the prediction
of “wolf”. Therefore, the explanations of the badly
trained model showed a pattern of errors (the snow
background) which the users recognized. The users
also explicitly mentioned the error pattern as a reason
for not trusting the model (Ribeiro et al., 2016).
Based on existing research, there is evidence that
explanations by themselves are not sufficient to in-
duce curiosity or suspicion that would result in find-
ing errors, even in an evaluation task. In addition, for
a reasonably accurate system choosing random results
would not necessarily return incorrect predictions that
would also induce suspicion about problems in the
system. Therefore, presenting errors to the evaluators
from the start may be a way of inducing that suspi-
cion. We considered two ways of presenting these er-
rors: (1) by showing incorrect predictions, which the
evaluator knows represent a problem in the system,
and (2) by showing prediction results (correct or in-
correct) where the corresponding explanations show
errors. In the latter case, the evaluator does not know
beforehand that there may be a problem. We designed
three experiments to evaluate the effect of these er-
rors, which address different tasks and error patterns.
3 METHODS
In this section, we describe the models, data and ex-
planations used in the experiments of the study, the
design of those experiments, and the participant re-
cruitment process.
3.1 Models, Dataset and Explanations
Text classification models are used widely and have
application in different areas (Kowsari et al., 2019).
Although the accuracy of these models is high in
many cases, they can still present problems such as
biased results (Dixon et al., 2018; Borkan et al.,
2019). For this study, we used two movie review
sentiment classification models, an LSTM (Hochre-
iter and Schmidhuber, 1997) and a CNN (Lai et al.,
2015) model. We trained and tested the models on the
Large Movie Review dataset (Maas et al., 2011), us-
ing the Keras deep learning API (Keras, 2021). The
accuracy was 87% for the LSTM model and 89% for
the CNN model. We did not train the models to show
a specific error pattern.
Effect of Errors on the Evaluation of Machine Learning Systems
49
For the explanations, we used LIME (Ribeiro
et al., 2016), a post hoc interpretability method
(Guidotti et al., 2018) that identifies the most impor-
tant features to the model prediction. Machine learn-
ing interpretability methods have a number of limita-
tions and different methods may give different results
(Jesus et al., 2021). However, for this study we do
not measure the effect of explanation variability. We
used LIME’s visualization function, which highlights
important words in the text and shows a bar chart of
the top words in order of importance. The class that
the word contributes to is represented by the color of
the highlight. We used the models to generate predic-
tions for movie reviews that were between 50 and 400
words long, and generated their corresponding expla-
nations.
We evaluated the models and identified a number
of problems in both. For the purposes of this study,
we focused on two error patterns found in the CNN
model: the words “recommend” and “women” were
often identified as top words that contributed to a neg-
ative sentiment classification, regardless of the con-
text where the words occurred. The LSTM model pre-
dictions also showed some problems but not on those
same words. We used the CNN model in experiment
1. In experiments 2 and 3, we used both models and
referred to them as system A (LSTM model, 87%)
and system B (CNN model, 89%). We manually se-
lected the example datapoints that would be used in
the experiments.
3.2 Experiment Design
3.2.1 Experiment 1
We first designed an experiment to evaluate the ef-
fect of errors on the recommendation of a single text
classification system. For the experiment, we defined
two factors with two levels each. The Error factor
was based on the type of error in the explanation of
predictions. In the Pattern error level, the word “rec-
ommend” was explained as a top negative word in all
predictions. As mentioned before, we hypothesized
that patterns would be detected by participants and in-
duce suspicion better than random errors. In the Ran-
dom error level, the explanations did not have any er-
ror pattern; instead different words were erroneously
explained as positive or negative. The Example fac-
tor was based on outcome of the system’s prediction
examples that the participants viewed. In the Cor-
rect level, all prediction examples were correct; in the
Incorrect level, all prediction examples were incor-
rect; and in the Mixed level half of the predictions
were correct and half were incorrect. The combina-
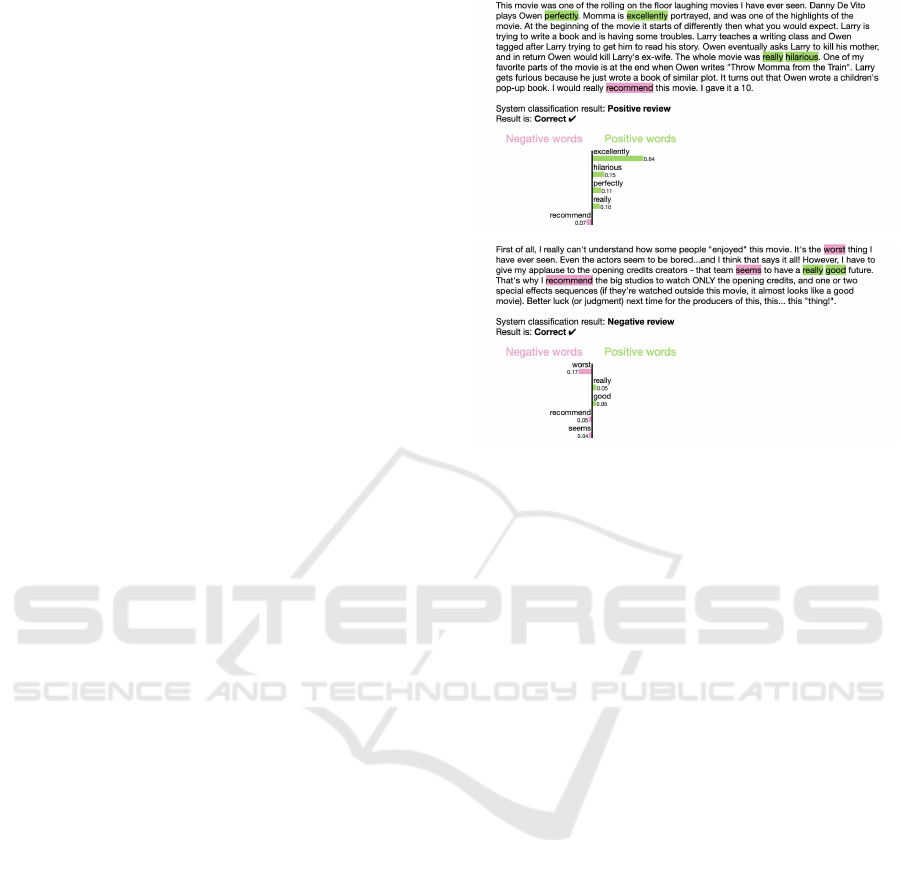
Figure 1: Examples of two predictions (with explanation
highlights) shown to participants in experiment 1. The ex-
amples show correct predictions with an error pattern on the
word “recommend”.
tion of factors and levels resulted in six conditions,
all of which show some type of error. The partici-
pants were assigned to one condition only (between-
subjects design).
We asked participants to evaluate a system based
on its testing accuracy (89%) and on four examples of
its prediction and corresponding explanation. Figure
1 shows examples of the prediction and explanation.
The task instructions also explained the meaning of
the highlights in the text. For experiment 1, we asked
about willingness to recommend the system (”I would
recommend the use of this system.”), trust in the sys-
tem (”I can trust this system”), as well as about use-
fulness of the explanations (”The explanations were
useful to form an opinion about the system.”) and un-
derstandability of system’s decisions (”I understand
how this system makes decisions in general.), on a 7-
point Likert-scale from Strongly disagree to Strongly
agree.
In addition, we asked participants an open-ended
question on the reasons for recommending or not rec-
ommending the system. The combination of quantita-
tive and qualitative measures would give an indication
of whether the errors had been identified and detected
by the participants and whether they had a negative
effect on evaluation and perception of the system (in-
duced suspicion). We included an attention question
about the testing accuracy of the system; the accu-
racy percentage was stated in the instructions. We
included questions about the participants gender, age,
HUCAPP 2022 - 6th International Conference on Human Computer Interaction Theory and Applications
50
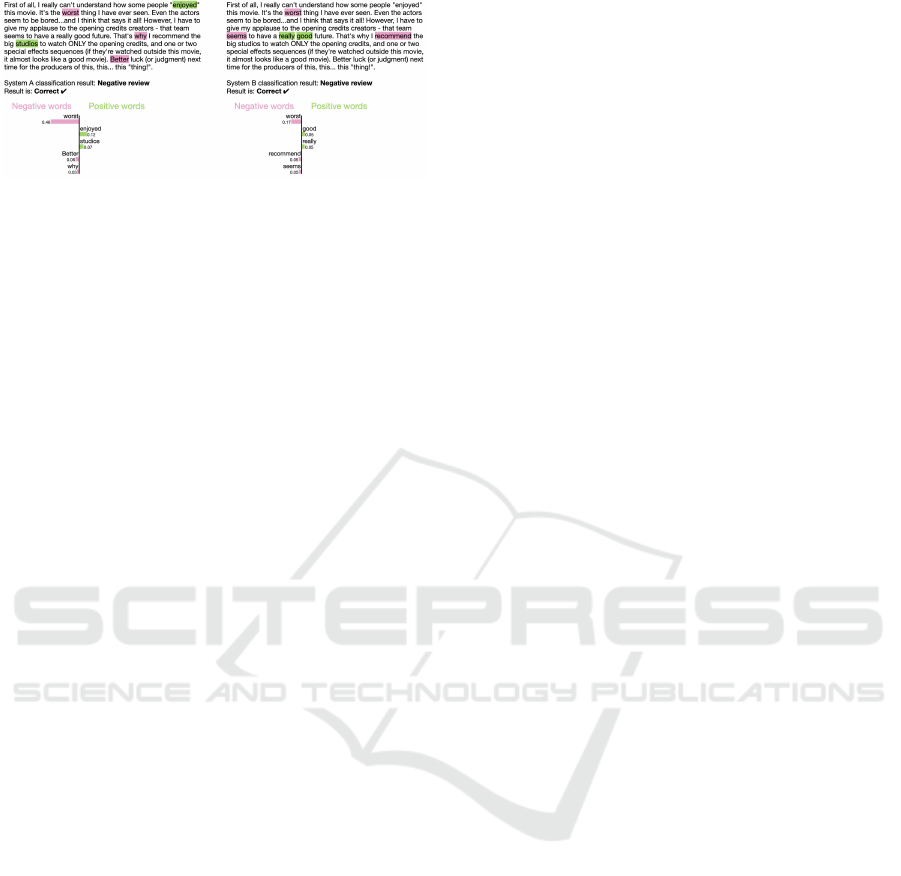
Figure 2: Example of a prediction (with explanation high-
lights) for system A (left) and system B (right) on the same
movie review shown to participants in experiment 2. A sim-
ilar format was used for experiment 3.
and a self-reported machine learning knowledge ques-
tion on a 7-point scale from No knowledge to Expert.
3.2.2 Experiment 2
We designed an experiment to evaluated the effect of
errors on the choice between two text classification
systems. The factors of the experiment were the same
as the ones described in experiment 1: Error (Ran-
dom and Pattern) and Example (Correct, Mixed and
Incorrect). In this case, the error pattern was shown
in only one of the systems (System B). This was the
same system as the one used for experiment 1. The
error pattern was also the same as in experiment 1:
“recommend” as a word that contributes to a negative
classification. The experiment had a between-subjects
design. We asked participants to compare and evalu-
ate two systems, system A (87% accuracy) and sys-
tem B (89% accuracy),based on their testing accuracy
and on four examples of their prediction and explana-
tions. The examples corresponded to the same movie
reviews for both systems. An example of the side-
by-side prediction and explanation is shown in Figure
2.
We asked participants which of the system they
would choose (”Between the two systems, I would
choose...”), with a response scale from Definitely A
to Definitely B. We measured trust in the each of the
systems (”I can trust system A/B.”), as well as general
usefulness of the explanations (”The explanations
were useful to form an opinion about the systems.”),
and general understandability of the systems’ deci-
sions (”I understand how the systems make decisions
in general.”), on a 7-point Likert-scale from Strongly
disagree to Strongly agree. In addition, we included
an open-ended question on the reasons for the partic-
ipants’ choice between systems. Same as in experi-
ment 1, the questionnaire included demographic (age
and gender) and machine learning knowledge ques-
tions, and an attention question.
3.2.3 Experiment 3
Finally, we designed an experiment to evaluate the ef-
fect of a different error patten that indicates bias, on
the choice between two systems. Because of the focus
on bias, we simplified the design and only considered
differences between Correct and Incorrect example
conditions, when the explanation in those examples
showed an error pattern on the word women, which in-
dicated gender-related bias (Dixon et al., 2018). That
is, the word women was identified in the explanations
as an important word that contributed to a negative
classification. This error pattern was found only in
system B. The experiment had a between-subjects de-
sign.
The task instructions and questionnaire were the
same as for experiment 2.
3.3 Participant Recruitment
We conducted the experiments on the Amazon Me-
chanical Turk platform. We limited the participation
to workers from the USA, Canada, Australia, and the
UK who had worked at least 1000 HITS. For experi-
ment 1, we used a 98% worker approval rate; we in-
creased it to 99% for experiment 2 and 3 due to the
number of invalid answers. For this study, invalid
answers where those in which workers with differ-
ent IDs had identical responses and where answers to
the open-ended questions were completely unrelated
to the content of the question. For experiment 1, we
compensated participants with $1.50 (approx. 9 min-
utes, rate of $10/h). For experiments 2 and 3, which
took longer to complete, we compensated them with
$2.00 (approx. 11 minutes, rate of $11/h). Workers
could only participate in one of the experiments.
4 RESULTS
4.1 Experiment 1: Effect of Errors on
the Recommendation of One System
We obtained a total 324 responses from workers. Of
these, 27 were rejected after review of the attention
check question. 8 participants self-assessed as ma-
chine learning experts, and their responses were not
included in the analysis. In total we analyzed 289
valid cases. The sample consisted of 111 (38%) fe-
male, 175 male (61%) and 3 other/NA participants,
ages 19 to 69. The age mean was 36. The majority of
participants reported at least some knowledge of ma-
chine learning, with only 23 participants reporting no
knowledge.
Effect of Errors on the Evaluation of Machine Learning Systems
51

We used the non-parametric analysis method
Aligned Rank Transform (ART) ANOVA (Wobbrock
et al., 2011) to measure the effect of the factors. The
results of the two-way ANOVA (Table 1) show a sig-
nificant main effect of Error (p <.01) on the will-
ingness to recommend the system, with the Pattern
conditions being lower. The results also show a sig-
nificant main effect of Example (p <.001), and we
used the Tukey’s HSD test for post hoc comparisons
between the levels. The results show significant dif-
ferences between all levels (Table 2). Figure 3 shows
that willingness to recommend decreases for condi-
tions with incorrect prediction examples. The Incor-
rect condition has the lowest median in both Error
conditions, but in general the effect is stronger for the
Pattern condition groups.
With regards to trust in the system, the results
show a significant main effect for Example (p <.001),
but not for Error (p = .074). The Tukey’s HSD post
hoc comparison test results show significant differ-
ences between the Example levels. Figure 3 shows
that the median of trust was lower for conditions that
include examples of incorrect predictions (Mixed and
Incorrect conditions). On the other hand, the results
show a significant main effect of Example for under-
standing of the system decisions (p <.01) and useful-
ness of the explanations (Example p <.001), but not
for Error. As shown in Table 2, the Tukey’s HSD test
results showed significant results only between some
levels, and Figure 3 illustrates these results. The re-
sults indicate that participants’ willingness to recom-
mend and trust in the system are negatively influenced
when presented with errors. In addition, understand-
ing of the system decision and usefulness of the ex-
planations are not as strongly influenced, that is, that
errors do not have a strongly negative effect on these
perceptions.
We qualitatively analyzed the open-ended re-
sponses to the question “Please explain your reason
for agreeing/disagreeing (with recommending the sys-
tem)”. For the analysis of the open-ended answers,
we used a closed coding procedure, using categories
identified in pretests: (1) Accuracy: when the reason
is the system accuracy; (2) Evidence: when the reason
includes evidence such as the highlighted words in the
explanations; (3) Not specified: when there is no spe-
cific reason or the answer is based on subjective per-
ception. We obtained 258 answers to the open-ended
question, with 31 blank responses. We removed in-
valid answers (17 answers) from the analysis. The cri-
teria for invalid answers is detailed in section 3.3. One
rater coded all answers, and two raters coded 20% of
that total. The Cohen’s kappa reliability for the two
raters was 0.723 (p <.001), indicating good strength
of agreement.
The results (Figure 4) show that in general that
more participants in the Pattern conditions reported
(Evidence) in the reason for their recommendation.
Conversely, Accuracy answers were the least common
in those condition. We can also observe that there
were many Not specified answers than Accuracy an-
swers. The content of the answers indicate that par-
ticipants recognized the pattern in the errors; it may
be that the error pattern can be distinguished more
clearly when contrasted with a supposedly correct
prediction. In both Pattern and Random error con-
dition groups, Accuracy and Not specified combined
made up the majority of answers, but their number
decreased in the Pattern error condition groups and
the number of Evidence answers increased. This in-
dicates that participants could more easily recognize
the errors when there was a pattern. Figure 3 shows
examples of participants’ answers for each category.
4.2 Experiment 2: Effect of Errors on
the Choice between Two Systems
We received 339 worker responses, 43 of which were
rejected after review. We excluded from analysis 13
participants that self-assessed as machine learning ex-
perts, resulting in 277 valid cases. The sample in-
cluded 107 (39%) female, 169 male (61%) and 1
other/NA participants, ages 18 to 80. The age mean
was 36. Only 14 participants reported no knowledge
of machine learning.
The two-way ART ANOVA (Table 4) results show
a significant main effect of Error (p <.001) on the
choice between the systems, but the main effect of
Example was not significant (p = .954). The distri-
bution of answers to the choice question (Figure 6)
shows that fewer participants chose system B (higher
accuracy) in the Pattern conditions groups compared
to the Random groups. The results show a signifi-
cant main effect of Example on trust in systems A (p
<.001) and B (p <.01), but no significant effect of Er-
ror. For both trust variables, the results of the Tukey’s
HSD post hoc comparison (Table 5) show significant
differences between the Correct and Incorrect (Trust
in A, p <.001; Trust in B, p <.01), and the Correct
and Mixed (Trust in A, p <.001; Trust in B, p <.05)
levels of the Example factor, but not between Incor-
rect and Mixed (Trust in A, p = .881; Trust in B, p =
.897). In general, trust was lower for the Mixed and
Incorrect conditions compared to the Correct condi-
tion (Figure 5). On the other hand, the results show no
significant main effect of either factor on the percep-
tion of usefulness of the explanations or understand-
ing of the systems’ decision.
HUCAPP 2022 - 6th International Conference on Human Computer Interaction Theory and Applications
52
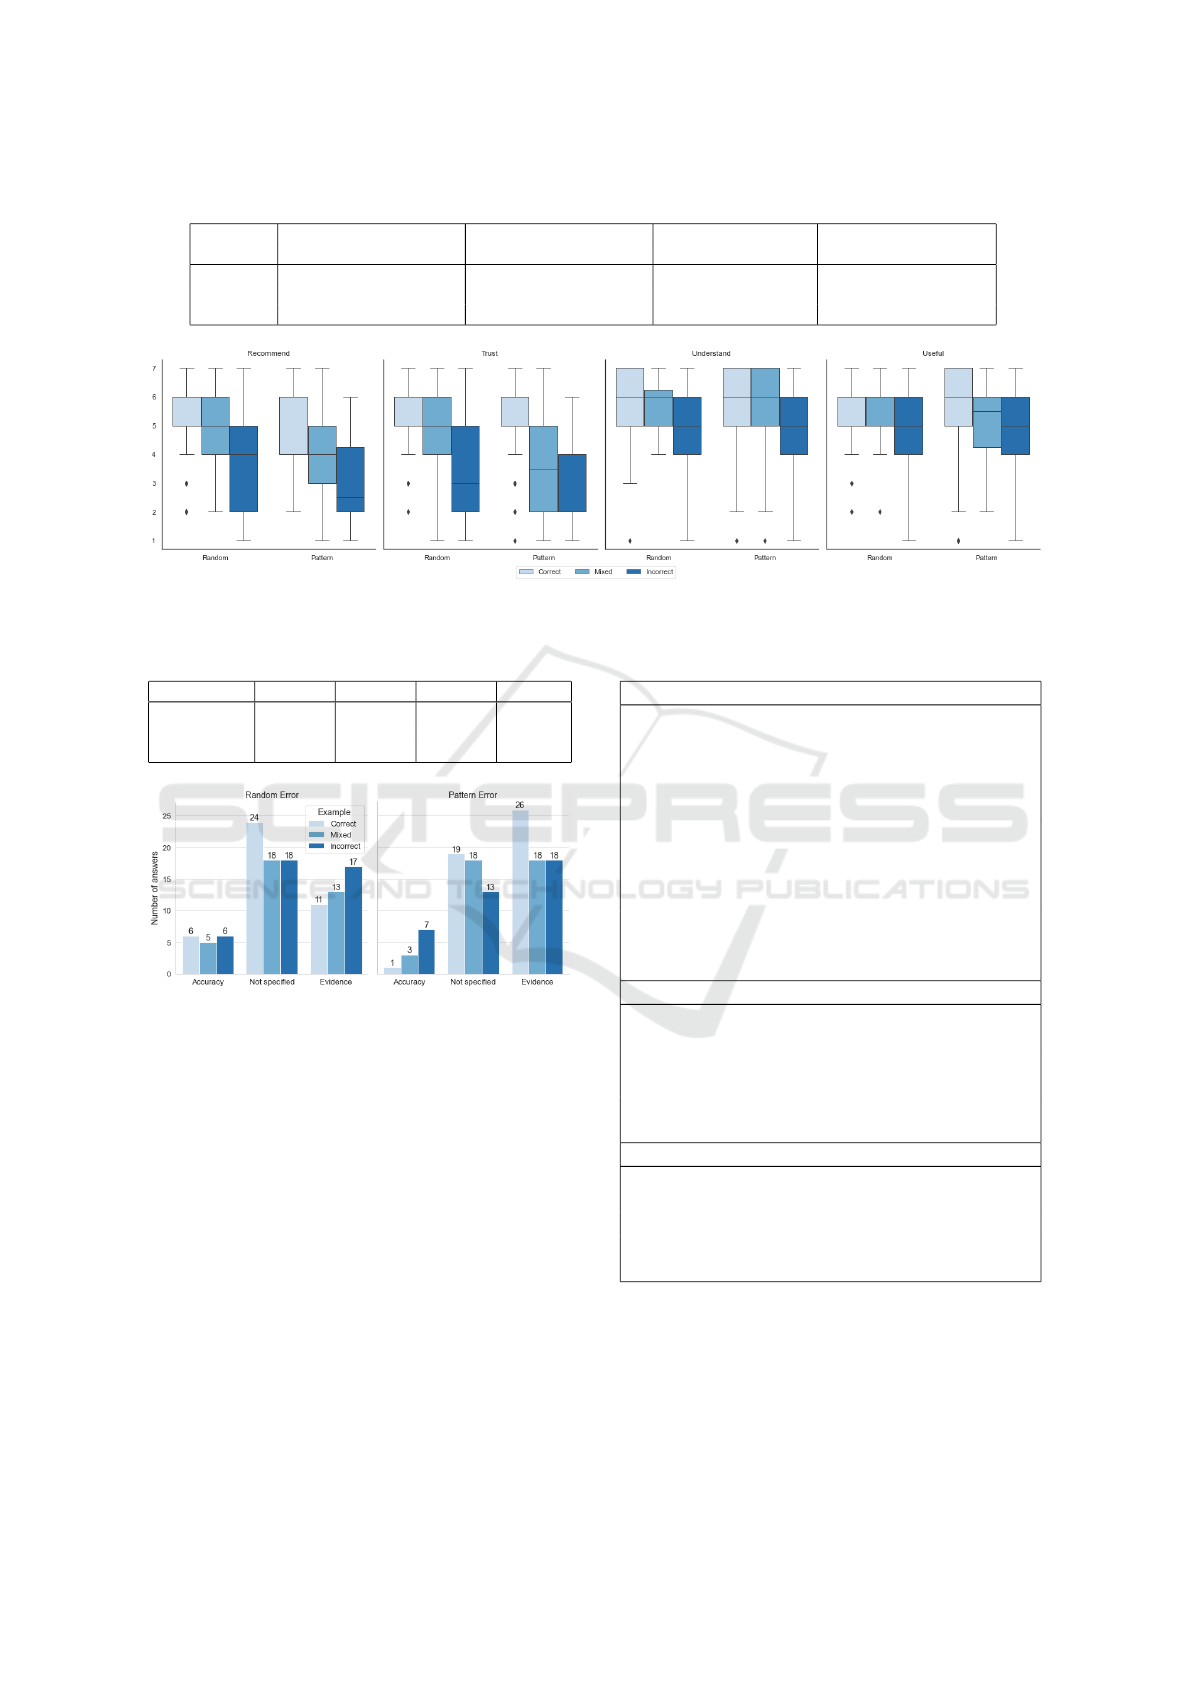
Table 1: Two-way ART ANOVA results for experiment 1. Significant p values indicated in bold.
Recommend Trust Understand Useful
F p eta2 F p eta2 F p eta2 F p eta2
Error 7.81 .006 .03 3.21 .074 .01 .03 .872 .00 .21 .65 .00
Example 39.80 <.001 .22 54.74 <.001 .28 5.01 .007 .03 7.86 <.001 .05
Inter. 1.55 .214 .01 2.56 .079 .02 .81 .448 .01 3.07 .048 .02
Figure 3: Experiment 1 result boxplot by Error and Example factors.
Table 2: Tukey’s HSD test post hoc comparison results for
experiment 1. Significant p values indicated in bold.
Recom. Trust Underst. Useful
Corr-Incorr <.001 <.001 .006 <.001
Corr-Mix <.001 <.001 .616 .577
Incorr-Mix <.001 <.001 .079 .013
Figure 4: Reasons for willingness to recommend the system
in Experiment 1.
The results indicate that participants that viewed
the errors preferred the system with slightly lower ac-
curacy but no error pattern (system A) to the system
with higher accuracy but with an error pattern (system
B). Other variables were not as strongly affected, al-
though we could observe some that trust was reduced
for both systems when participants were shown incor-
rect prediction examples.
We qualitatively analyzed the answers to the open-
ended question “Please explain the reasons for your
choice (of system)”, using the same coding proce-
dure and categories described in experiment 1. We
removed 4 invalid answers from the analysis. We de-
scribe the criteria for invalid answers in section 3.3.
We obtained 255 answers and 22 blank responses.
The Cohen’s kappa reliability for the two raters on
20% of the answers was 0.655 (p <.001), indicating
Table 3: Example answers to the open-ended question for
each experiment by category.
Evidence
(Experiment 1) ”It’s marking of words like recom-
mend as negative is weird. Additionally, it never
checked context of the keywords it was scanning,
so they seemed to be rated incorrectly for their us-
age.
(Experiment 2) ”I can’t wrap my head around why
’recommend’ would be classified as negative as it
is in system B. that’s the main reason why I lean
somewhat towards A.”
(Experiment 3) ”System B seems to be categoriz-
ing the word Women as a negative word and it
does it multiple times.”
Accuracy
(Experiment 1) ”because of it has accuracy level
89%”
(Experiment 2) ”System B has a more accurate
result overall even if only by a small margin.”
(Experiment 3) ”It has a slightly higher accuracy
rate than does ”A.””
Not specified
(Experiment 1) ”It doesn’t seem completely reli-
able.”
(Experiment 2) ”it seemed better.”
(Experiment 3) ”in my opinion i can choose a is
the best one.”
a substantial level of agreement (Landis and Koch,
1977). As Figure 7 shows, participants in the Pat-
tern-Correct and Pattern-Incorrect condition groups
mentioned Evidence in their reasons more frequently
than Accuracy. The opposite happens in the Random
condition groups, although the difference between the
Effect of Errors on the Evaluation of Machine Learning Systems
53
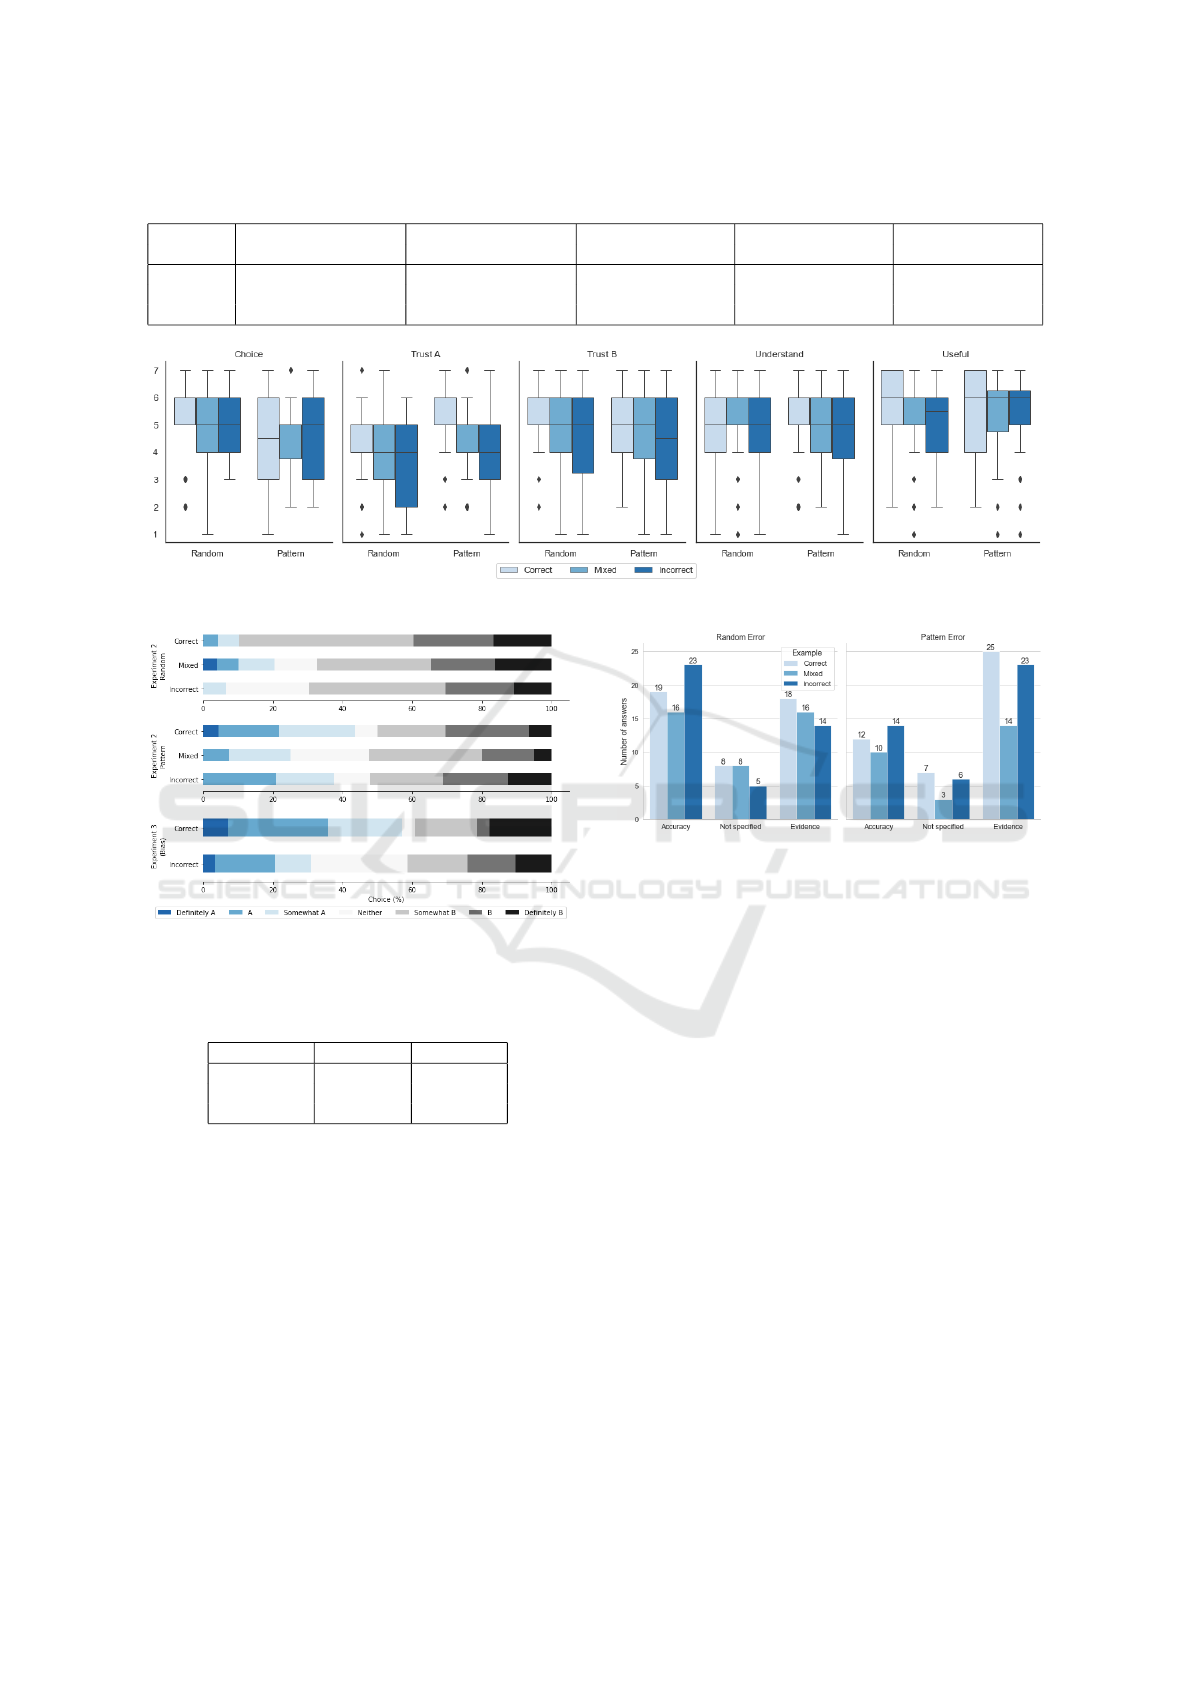
Table 4: Two-way ART ANOVA results for experiment 2. Significant p values indicated in bold.
Choice Trust in A Trust in B Understand Useful
F p eta2 F p eta2 F p eta2 F p eta2 F p eta2
Error 16.09 <.001 .06 3.65 .057 .01 3.37 .067 .01 0.08 .777 .00 .05 .826 .00
Example 0.05 .954 .00 11.74 <.001 .08 6.10 .003 .04 1.38 .254 .01 .54 .585 .00
Inter. 0.57 .565 .00 0.21 .812 .00 0.11 .899 .00 2.81 .062 .02 .10 .908 .00
Figure 5: Experiment 2 result boxplot by Error and Example factors.
Figure 6: Distribution of answers regarding choice of sys-
tems for experiments 2 and 3.
Table 5: Tukey’s HSD test post hoc comparison results for
experiment 2. Significant p values indicated in bold.
Trust in A Trust in B
Corr-Incorr <.001 .004
Corr-Mix <.001 .018
Incorr-Mix .881 .897
categories is smaller than in the other conditions. On
the other hand, the number of participants’ answers
in the Mixedconditions was more equally distributed
between the Evidence and Accuracy categories. Not
specified answers were the least frequent in all condi-
tions.
The results indicate that in the Pattern condition,
participants noticed the error pattern and mentioned
it in their reason for choosing system A (lower accu-
racy but no error patterns) instead of system B. In the
Random condition, more participants mentioned the
system accuracy in their reason for choosing system
B. Examples of answers are shown in Figure 3.
Figure 7: Reasons for the participants’ choice between the
systems in experiment 2.
4.3 Experiment 3: Effect of Bias Error
Pattern on the Choice between Two
Systems
We obtained 60 responses, and rejected 1 after review.
In addition, 2 participants were excluded from analy-
sis due to self-assessing as machine learning experts.
This resulted in 57 valid cases. The sample included
14 (25%) female, 43 male (75%) participants, ages
18 to 72. The age mean was 37. Only 2 participants
reported no knowledge of machine learning.
The results of a one-way ART ANOVA show a
significant effect on trust in system A (p <.001) and
on understanding of the systems’ decision (p <.05)
(Table 6). This indicates that viewing the Incorrect
examples had a negative effect on both of these vari-
ables (Figure 8). The effect on the other variables was
not significant. In particular, the non-significant effect
on trust in system B represents a difference from the
results of experiment 2, although Figure 8 shows a
similar distribution of responses.
We asked the open-ended question “Please ex-
plain the reasons for your choice (of system)” and
HUCAPP 2022 - 6th International Conference on Human Computer Interaction Theory and Applications
54
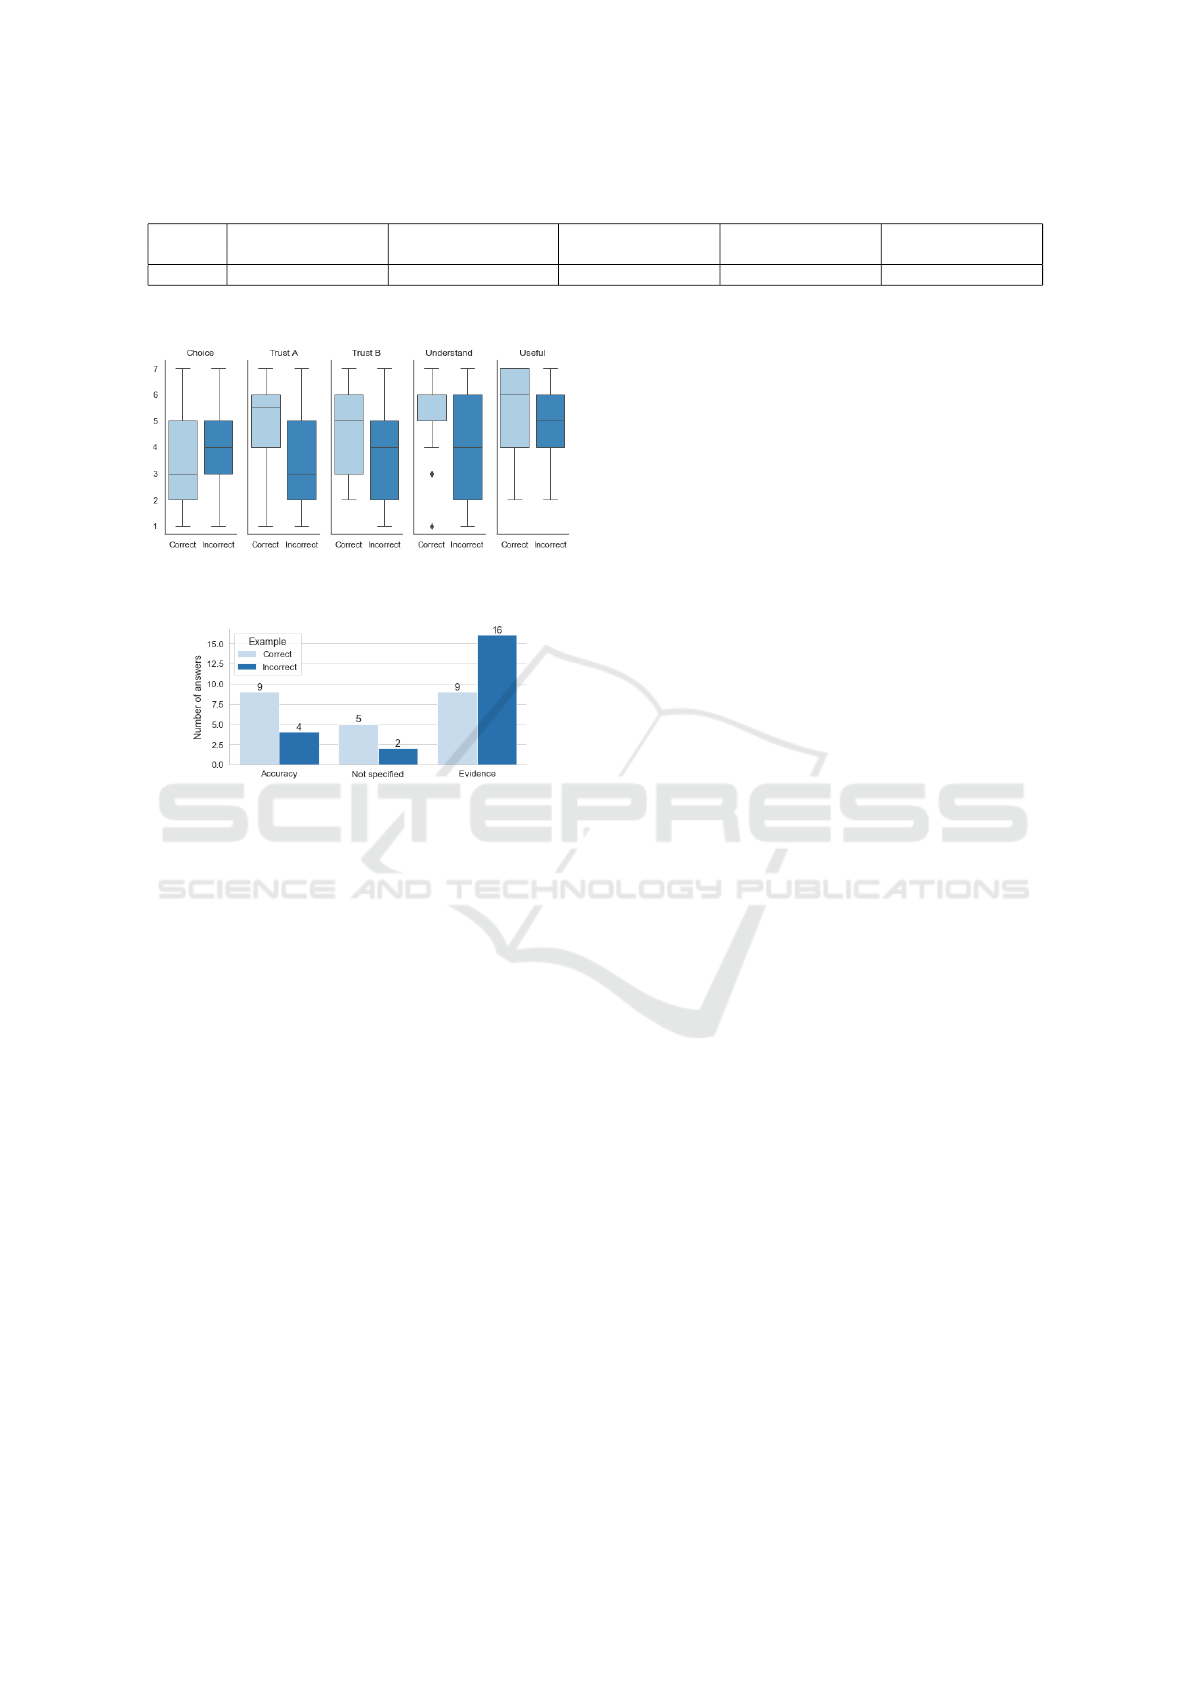
Table 6: One-way ART ANOVA results for experiment 3. Significant p values indicated in bold.
Choice Trust in A Trust in B Understand Useful
F p eta2 F p eta2 F p eta2 F p eta2 F p eta2
Example 0.94 .336 .02 16.25 <.001 .23 3.18 .08 .05 6.16 .016 .10 2.32 .133 .04
Figure 8: Experiment 3 result boxplot comparing *Correct*
and *Incorrect* conditions.
Figure 9: Reasons for the participants’ choice between the
systems in experiment 3.
coded its responses using the same procedure as for
experiment 2. We obtained 47 answers and 10 blank
responses. The Cohen’s kappa reliability was 0.75
(p <0.01), indicating good agreement. The results
show that more participants answered with Evidence
than Accuracy as a reason for their choice when they
viewed only incorrect predictions (Figure 9).
In the Correct condition, the results show that
there were the same number of Accuracy and Evi-
dence answers. Not specified answers were the least
frequent in both conditions. Considering that both
conditions (Correct and Incorrect) showed the bias
error pattern in the system B prediction examples,
the answers suggest that participants relied less on
the accuracy metric when they were shown incorrect
predictions. Figure 3 shows examples of the open-
ended answers. Finally, we can also observe in the
answers that the bias error pattern prompted some par-
ticipants to state directly that the system was biased,
with or without detailing the reason for that state-
ment (“System B is sexist”, “Because System B la-
belled”women” as a negative review. Which is a gen-
der bias.”).
5 DISCUSSION
The results of the experiments show that when par-
ticipants are asked to evaluate one system, incorrect
predictions and error patterns both work to lower the
willingness to recommend the system. In addition,
incorrect predictions have an overall negative effect
on perception for this task. In contrast, although error
patterns affect recommendation, they do not appear to
have an effect on perception. More participants gave
evidence as a reason for their choice in the error pat-
tern conditions. On the other hand, many participants
did not specify the reason for their recommendation.
For the task in which participants had to choose
between two systems, incorrect predictions had an ef-
fect on trust, but not on evaluation. Conversely, error
patterns had an effect on judgement but not on trust.
Participants in the error pattern conditions appeared
less willing to choose system B over system A, even
though system B had a higher accuracy. In addition,
more participants in the error pattern condition gave
evidence in a reason for their choice, as opposed to
mentioning accuracy. And unlike the evaluation of
one system, there were fewer answers without an spe-
cific reason. Taken together, the quantitative and qual-
itative results suggest participants are able to detect
patterns, enough to make them consider that system
B was not a better system regardless of its higher ac-
curacy. However, this effect appears to be stronger
in the comparison task. We hypothesize that when
participants only evaluated one system, the lack of
reference points (accuracy and types of errors in the
explanation) may have introduced uncertainty. This
may be the reason why there was a higher number of
non specified reasons for their recommendation. Fi-
nally, the results are not very different when the error
pattern indicates bias, but interestingly, some partici-
pants also named the error pattern as bias in their an-
swers.
In general, the results suggest that error patterns
in explanations were detected and increased suspicion
that there were problems in the system, compared to
random errors. Research has shown that users with-
out enough expertise can over-trust a machine learn-
ing system because they cannot detect errors (Nourani
et al., 2020). In the context of machine learning evalu-
ation, there may be techniques that could be leveraged
to obtain this information. For example, in the area
Effect of Errors on the Evaluation of Machine Learning Systems
55

of machine translation, methods have been proposed
to detect specific errors in text using the meaning of
words (Raybaud et al., 2011; Xiong et al., 2010).
There is also research on approaches used to predict
failure (Zhang et al., 2014) and proposals for metrics
for bias (Borkan et al., 2019). Other text-processing
techniques could be used to support error identifi-
cation: dictionary-based techniques could be useful
to find contradictions in explanations, for example if
positive or neutral words were considered negative by
the model.
Focusing on particular errors may not give a
global view of the system performance. However, we
note that if some errors are considered critical (for
example, if they indicate the presence of bias), then
these errors can be enough to require the redesign of
a system (Dixon et al., 2018). Emphasis on errors
could be one approach to help evaluate the perfor-
mance of machine learning models, and it could be
used in combination with other approaches.
5.1 Limitations
This study has the following main limitations. First,
the participants were recruited on the Amazon Me-
chanical Turk platform. These participants were from
different countries and the majority were male. This
limits the generalizability of results to other popula-
tions. Second, we measured perception with single
item questions, and did not validate the participants’
understanding of the system. Third, we conducted
the experiments with a specific type of text classifi-
cation model, dataset, and error patterns. Therefore,
the findings may not be generalizable to other type of
models, data or errors. Finally, we showed partici-
pants only a few examples of the output of the sys-
tem, to reduce participant fatigue. In addition, these
examples were manually selected. In practice, more
information would be needed to confirm an error pat-
tern, and it is possible that showing random examples
could affect perception.
6 CONCLUSIONS
In this paper, we conducted three experiments to in-
vestigate the effect of errors, in the form of incorrect
predictions and errors in the explanation, on the eval-
uation and perception of machine learning systems
for text classification. The results indicate that error
patterns reduce the willingness to recommend a sys-
tem and can affect the choice between two systems.
When there were patterns of error in the results of
a system, participants were less likely to choose it,
compared to when there were random errors. In ad-
dition, more participants gave reasons for their choice
that referenced the evidence of errors in the explana-
tions when there were patterns. This suggests that er-
ror patterns were detected by participants’, and that
they increased suspicion that there were problems in
the system, even when it had a higher accuracy. Fu-
ture research should evaluate these effect with a wider
variety of conditions.
REFERENCES
Adadi, A. and Berrada, M. (2018). Peeking Inside the
Black-Box: A Survey on Explainable Artificial Intel-
ligence (XAI). IEEE Access, 6:52138–52160.
Amershi, S., Begel, A., Bird, C., DeLine, R., Gall, H., Ka-
mar, E., Nagappan, N., Nushi, B., and Zimmermann,
T. (2019). Software Engineering for Machine Learn-
ing: A Case Study. In Proceedings of the 41st Interna-
tional Conference on Software Engineering: Software
Engineering in Practice, ICSE-SEIP ’10, pages 291–
300, Piscataway, NJ, USA. IEEE Press.
Borkan, D., Dixon, L., Sorensen, J., Thain, N., and Vasser-
man, L. (2019). Nuanced Metrics for Measuring Un-
intended Bias with Real Data for Text Classification.
In Companion Proceedings of The 2019 World Wide
Web Conference, WWW ’19, pages 491–500, New
York, NY, USA. ACM.
Bussone, A., Stumpf, S., and O’Sullivan, D. (2015). The
Role of Explanations on Trust and Reliance in Clini-
cal Decision Support Systems. In 2015 International
Conference on Healthcare Informatics, pages 160–
169.
Cai, C. J., Reif, E., Hegde, N., Hipp, J., Kim, B.,
Smilkov, D., Wattenberg, M., Viegas, F., Corrado,
G. S., Stumpe, M. C., and Terry, M. (2019). Human-
Centered Tools for Coping with Imperfect Algorithms
During Medical Decision-Making. In Proceedings of
the 2019 CHI Conference on Human Factors in Com-
puting Systems, pages 1–14. Association for Comput-
ing Machinery, New York, NY, USA.
Cheng, H.-F., Wang, R., Zhang, Z., O’Connell, F., Gray,
T., Harper, F. M., and Zhu, H. (2019). Explaining
Decision-Making Algorithms through UI: Strategies
to Help Non-Expert Stakeholders. In Proceedings of
the 2019 CHI Conference on Human Factors in Com-
puting Systems, pages 1–12. Association for Comput-
ing Machinery, New York, NY, USA.
de Vries, P., Midden, C., and Bouwhuis, D. (2003). The ef-
fects of errors on system trust, self-confidence, and the
allocation of control in route planning. International
Journal of Human-Computer Studies, 58(6):719–735.
Dixon, L., Li, J., Sorensen, J., Thain, N., and Vasserman, L.
(2018). Measuring and Mitigating Unintended Bias
in Text Classification. In Proceedings of the 2018
AAAI/ACM Conference on AI, Ethics, and Society,
pages 67–73. ACM.
Dzindolet, M. T., Peterson, S. A., Pomranky, R. A., Pierce,
L. G., and Beck, H. P. (2003). The role of trust in
HUCAPP 2022 - 6th International Conference on Human Computer Interaction Theory and Applications
56

automation reliance. International Journal of Human-
Computer Studies, 58(6):697–718.
Frison, A.-K., Wintersberger, P., Riener, A., Schartm
¨
uller,
C., Boyle, L. N., Miller, E., and Weigl, K. (2019).
In UX We Trust: Investigation of Aesthetics and Us-
ability of Driver-Vehicle Interfaces and Their Impact
on the Perception of Automated Driving. In Proceed-
ings of the 2019 CHI Conference on Human Factors
in Computing Systems, pages 1–13. Association for
Computing Machinery, New York, NY, USA.
Guidotti, R., Monreale, A., Ruggieri, S., Turini, F., Gian-
notti, F., and Pedreschi, D. (2018). A Survey of Meth-
ods for Explaining Black Box Models. ACM Comput.
Surv., 51(5):93:1–93:42.
Hochreiter, S. and Schmidhuber, J. (1997). Long Short-
Term Memory. Neural Computation, 9(8):1735–1780.
Hoff, K. A. and Bashir, M. (2015). Trust in automation: In-
tegrating empirical evidence on factors that influence
trust. Human factors, 57(3):407–434.
Jesus, S., Bel
´
em, C., Balayan, V., Bento, J., Saleiro, P.,
Bizarro, P., and Gama, J. (2021). How can I choose
an explainer? an Application-grounded Evaluation of
Post-hoc Explanations. In Proceedings of the 2021
ACM Conference on Fairness, Accountability, and
Transparency, FAccT ’21, pages 805–815, New York,
NY, USA. Association for Computing Machinery.
Kaur, H., Nori, H., Jenkins, S., Caruana, R., Wallach, H.,
and Wortman Vaughan, J. (2020). Interpreting In-
terpretability: Understanding Data Scientists’ Use of
Interpretability Tools for Machine Learning. In Pro-
ceedings of the 2020 CHI Conference on Human Fac-
tors in Computing Systems, CHI ’20, pages 1–14,
Honolulu, HI, USA. Association for Computing Ma-
chinery.
Keras (2021). Keras documentation: About Keras.
Kontogiannis, T. (1999). User strategies in recovering
from errors in man–machine systems. Safety Science,
32(1):49–68.
Kowsari, K., Jafari Meimandi, K., Heidarysafa, M., Mendu,
S., Barnes, L., and Brown, D. (2019). Text Classifica-
tion Algorithms: A Survey. Information, 10(4):150.
Lai, S., Xu, L., Liu, K., and Zhao, J. (2015). Recurrent con-
volutional neural networks for text classification. In
Proceedings of the Twenty-Ninth AAAI Conference on
Artificial Intelligence, AAAI’15, pages 2267–2273,
Austin, Texas. AAAI Press.
Landis, J. R. and Koch, G. G. (1977). The measurement of
observer agreement for categorical data. biometrics,
pages 159–174.
Lee, J. D. and See, K. A. (2004). Trust in Automation:
Designing for Appropriate Reliance. Human Factors,
46(1):50–80.
Lundberg, S. M. and Lee, S.-I. (2017). A Unified Ap-
proach to Interpreting Model Predictions. In Guyon,
I., Luxburg, U. V., Bengio, S., Wallach, H., Fergus, R.,
Vishwanathan, S., and Garnett, R., editors, Advances
in Neural Information Processing Systems 30, pages
4765–4774. Curran Associates, Inc.
Maas, A. L., Daly, R. E., Pham, P. T., Huang, D., Ng, A. Y.,
and Potts, C. (2011). Learning Word Vectors for Sen-
timent Analysis. In Proceedings of the 49th Annual
Meeting of the Association for Computational Lin-
guistics: Human Language Technologies, pages 142–
150. Association for Computational Linguistics.
Mittelstadt, B., Russell, C., and Wachter, S. (2019). Ex-
plaining Explanations in AI. In Proceedings of the
Conference on Fairness, Accountability, and Trans-
parency, FAT* ’19, pages 279–288, New York, NY,
USA. Association for Computing Machinery.
Nickerson, R. S. (1998). Confirmation Bias: A Ubiquitous
Phenomenon in Many Guises. Review of General Psy-
chology, 2(2):175–220.
Nourani, M., King, J., and Ragan, E. (2020). The Role
of Domain Expertise in User Trust and the Impact of
First Impressions with Intelligent Systems. Proceed-
ings of the AAAI Conference on Human Computation
and Crowdsourcing, 8:112–121.
Raybaud, S., Langlois, D., and Sma
¨
ıli, K. (2011). “This
sentence is wrong.” Detecting errors in machine-
translated sentences. Machine Translation, 25(1):1.
Ribeiro, M. T., Singh, S., and Guestrin, C. (2016). ”Why
Should I Trust You?”: Explaining the Predictions
of Any Classifier. In Proceedings of the 22nd
ACM SIGKDD International Conference on Knowl-
edge Discovery and Data Mining, KDD ’16, pages
1135–1144, New York, NY, USA. ACM.
Sanchez, J., Rogers, W. A., Fisk, A. D., and Rovira, E.
(2014). Understanding reliance on automation: Ef-
fects of error type, error distribution, age and ex-
perience. Theoretical issues in ergonomics science,
15(2):134–160.
Sanderson, P. M. and Murtagh, J. M. (1990). Predicting
fault diagnosis performance: Why are some bugs hard
to find? IEEE Transactions on Systems, Man, and
Cybernetics, 20(1):274–283.
Sauer, J., Chavaillaz, A., and Wastell, D. (2016). Expe-
rience of automation failures in training: Effects on
trust, automation bias, complacency and performance.
Ergonomics, 59(6):767–780.
Tenney, I., Wexler, J., Bastings, J., Bolukbasi, T., Co-
enen, A., Gehrmann, S., Jiang, E., Pushkarna, M.,
Radebaugh, C., Reif, E., and Yuan, A. (2020). The
Language Interpretability Tool: Extensible, Interac-
tive Visualizations and Analysis for NLP Models.
arXiv:2008.05122 [cs].
Wobbrock, J. O., Findlater, L., Gergle, D., and Higgins,
J. J. (2011). The aligned rank transform for nonpara-
metric factorial analyses using only anova procedures.
In Proceedings of the SIGCHI Conference on Human
Factors in Computing Systems, CHI ’11, pages 143–
146, New York, NY, USA. Association for Computing
Machinery.
Xiong, D., Zhang, M., and Li, H. (2010). Error detection
for statistical machine translation using linguistic fea-
tures. In Proceedings of the 48th Annual Meeting of
the Association for Computational Linguistics, ACL
’10, pages 604–611, USA. Association for Computa-
tional Linguistics.
Zhang, P., Wang, J., Farhadi, A., Hebert, M., and Parikh, D.
(2014). Predicting Failures of Vision Systems. In Pro-
ceedings of the IEEE Conference on Computer Vision
and Pattern Recognition, pages 3566–3573.
Effect of Errors on the Evaluation of Machine Learning Systems
57
