
MASHCA: Monitoring and Hydro Climatological Analysis of the Urban
Microclimate of Latacunga
David Rivas-Lalaleo
1 a
, Alex Santana G.
2 b
, Cristian Molina
1
, M
´
onica Huerta
3 c
, Roger Clotet
4 d
,
Andr
´
es P
´
erez
1
, Luis Santana
5
and Fernanda O
˜
nate
6
1
Universidad de las Fuerzas Armadas ESPE, Latacunga, Ecuador
2
Instituto Superior Tecnol
´
ogico Mar
´
ıa Natalia Vaca, Ambato, Ecuador
3
Universidad Polit
´
ecnica Salesiana, Cuenca, Ecuador
4
Universidad Internacional de Valencia, Valencia, Spain
5
Colegio Primero de Abril, Latacunga, Ecuador
6
Instituto Superior Tecnol
´
ogico Ba
˜
nos, Ba
˜
nos, Ecuador
Keywords:
Urban Microclimate, Climate Change, IoT, Temperature, Humidity.
Abstract:
The climate change has become one of the most studied problems in recent years. Analyses of climate behavior
have traditionally been treated in a macro way, that is, large areas of territory are analyzed. The development
of humanity in particular, which has been denoted by the increase in population and therefore the growth of
cities, has had an effect on the climate. The change in climatic conditions within cities due to the effects of
construction, urban planning, modification of territories, among others, are known as urban micro-climates.
These variations require special attention, since these apparently minimal changes can have a great effect on
the life of the population. The purpose of this project is to study the historical data on the behavior of the
urban climate of Latacunga, through the temporal analysis of the data obtained by the meteorological station
of the Universidad de las Fuerzas ESPE, later to develop micro meteorological stations that are installed in
various locations of the city, finally the information generated and its corresponding reports will be presented
through a web page, thus allowing to have a tool that allows to identify the behavior of the urban microclimate
of the city of Latacunga. The results obtained have made it possible to identify the maximum, minimum and
most frequent values of temperature, humidity, speed and wind direction. In addition, with the installation of
the new stations, the monitoring of variables such as solar radiation, atmospheric pressure, among others, has
increased. With the information processed, it will allow the generation of recommendations oriented to risk
management, urban planning and citizen security.
1 INTRODUCTION
The dynamics of urbanization and growth of the city
has been gradually occurring due to socioeconomic
factors that benefit the inhabitants due to the
concentration of commercial and financial activ-
ity, but with it has also created its climatic patterns
different from its geographical location (Huerta et al.,
2021; Sichiqui et al., 2020; Gabriela et al., 2019),
which are called artificial or urban microclimates.
a
https://orcid.org/0000-0001-5958-6606
b
https://orcid.org/0000-0001-8967-7306
c
https://orcid.org/0000-0003-4435-7987
d
https://orcid.org/0000-0001-7474-7674
The origin of urban microclimates arises from neg-
ative aspects such as the smog generated by cars and
local industrial facilities that prevent the entry of solar
rays (Barrios-Bello et al., 2019; Garcia-Cedeno et al.,
2019; Guillermo et al., 2019; Abad et al., 2019). In
addition to this, the architecture of the city also in-
tervenes, such as the morphology that generates wind
turbulence, the construction materials of the buildings
and the asphalt required for the mobility of the means
of transport (Brozovsky et al., 2021; Ulpiani et al.,
2021; Maiullari et al., 2021); All this leads to a vari-
ability in temperature, humidity among other meteo-
rological variables with respect to its macroclimate.
Consequently to these atypical climates there is the
134
Rivas-Lalaleo, D., G., A., Molina, C., Huerta, M., Clotet, R., Pérez, A., Santana, L. and Oñate, F.
MASHCA: Monitoring and Hydro Climatological Analysis of the Urban Microclimate of Latacunga.
DOI: 10.5220/0010838300003118
In Proceedings of the 11th International Conference on Sensor Networks (SENSORNETS 2022), pages 134-143
ISBN: 978-989-758-551-7; ISSN: 2184-4380
Copyright
c
2022 by SCITEPRESS – Science and Technology Publications, Lda. All r ights reserved

probability of an increase in the frequency of fog, in-
tensity of storms, concentration of smog among oth-
ers. Currently in the country several agencies provide
meteorological data but at a general level since they
measure the macroclimate of the provinces; These
data are insufficient to take necessary measures within
the urban area in the face of climatic phenomena,
therefore, Latacunga does not have concise informa-
tion that allows identifying potential risks due to the
variability of the climate within the urban perimeter.
The Universidad de las Fuerzas Armadas ESPE,
on its campus located in the downtown area of
Latacunga has a meteorological station that has a
large amount of scattered information that has been
recorded for several years, in this context an applied
research is proposed for the monitoring and analysis
of climatological variables through the implementa-
tion of additional stations in the Ignacio Flores parish,
which allow expanding the coverage of data acquisi-
tion to analyze the behavior of the climate and iden-
tify the evolution of the urban microclimate with re-
spect to time, said information will be disseminated
through a web application accessible to the public.
This research aims to reduce the impact of micro-
climates in urban areas through the analysis of cli-
matological variations, mitigating the levels of pop-
ulation vulnerability to events produced by extreme
changes in the variables to be monitored. Through
this information, it is proposed to create a growing
awareness among citizens to reduce the impact of mi-
croclimates in urban areas, evidencing the changes
that have occurred over time that are imperceptible
to people as these changes develop in large periods
of time. weather. In this aspect, the Information and
Communication Technologies are used that, through
a web application, allow the user to access this infor-
mation in an easy, fast and intuitive way.
The project provides solid information for
decision-making within the framework of the city’s
centralized risk management system, strengthening
local capacities through technology transfer in order
to implement mitigation measures for climate varia-
tions through urban planning and ecology of the city
that limits new urban development zones under con-
cepts of environmental sustainability such as genera-
tion, protection and restoration of green areas; guar-
anteeing the improvement of climatic conditions in
the interior of the city and the reduction of socio- en-
vironmental inequalities at the local level (Padmanab-
hamurty, 1990; Yoon et al., 2017).
2 METHODOLOGY
This section it is based on the analysis of histori-
cal data and the installation of the meteorological
station, taking into account the manufacturer’s stan-
dards, among which the selection of an appropri-
ate geographic location is established; the position,
height and orientation so that the sensors work in
their ideal ranges without generating errors due to
improper handling(Teichmann et al., 2021; Marando
et al., 2022; Amani-Beni et al., 2022). By means of
a checklist, validate the operation of each of the ele-
ments of the station, guaranteeing the fidelity of the
data, an essential basis for determining the urban mi-
croclimate of Latacunga(Bonan, 2000; Brown, 2018;
Barton, 2013).
This research is based on procedures related to
theoretical and experimental research with data col-
lection since October 12, 2020, which consists of a
main station, a mini station and four micro stations
with a sending frequency per minute, of the which
have been collected 400,000, 3,000 and 170,000
records respectively; The diagram is shown in Fig. 1.
The methodology applied to carry out the proposed
objectives involves the general guidelines of the sci-
entific method, differentiating itself into four phases:
Figure 1: Diagram of the methodology.
2.1 Implementation Phase
This section it is based on the analysis of histori-
cal data and the installation of the meteorological
station, taking into account the manufacturer’s stan-
dards, among which the selection of an appropri-
ate geographic location is established; the position,
height and orientation so that the sensors work in
their ideal ranges without generating errors due to im-
proper handling. By means of a checklist, validate the
operation of each of the elements of the station, guar-
anteeing the fidelity of the data, an essential basis for
determining the urban microclimate of Latacunga.
2.2 Simulation Phase
In this section it is argued the individual operation of
each element in charge of the digitization of the in-
formation based on the conceptual dimensioning, it is
done using specialized software and steps such us:
The logical part of the meteorological station
schedules the sending of the variables in an adequate
format with a sampling time that allows gathering
as much information as possible and reporting in the
MASHCA: Monitoring and Hydro Climatological Analysis of the Urban Microclimate of Latacunga
135
event of sensor failures or power shortages; Regard-
ing the technological infrastructure, it corresponds to
the configuration of the database server, design of the
database with its respective tables and access to the
database through a WAN network; The analysis of the
stored data carried out through a workflow that per-
forms the data processing according to the design of
the database and must be replicable for the data avail-
able from the station of Universidad de las Fuerzas
Armadas ESPE. The information monitored is vali-
dated through a dashboard on the web.
2.3 Integration Phase
In this part of the investigation each of the stages is in-
corporated, verifying the flow of information through
each equipment to determine the validity of the data,
the rate of information loss, errors in the information
frames generated, possible interruptions in communi-
cation and detection of common errors produced by
damage or malfunction of the station. A sampling is
carried out to verify the data published in the web in-
strument panel and using a tool to observe the traffic
of the web page to determine the influence of the in-
formation provided within the citizens of Latacunga.
3 RESULTS
For process and analyze the historical information ob-
tained by the station of Universidad de las Fuerzas Ar-
madas ESPE, the following procedure was followed
with the data collected during 2019 by the station with
geographic coordinates (0°56’09.3”S 78°36’45.6”W)
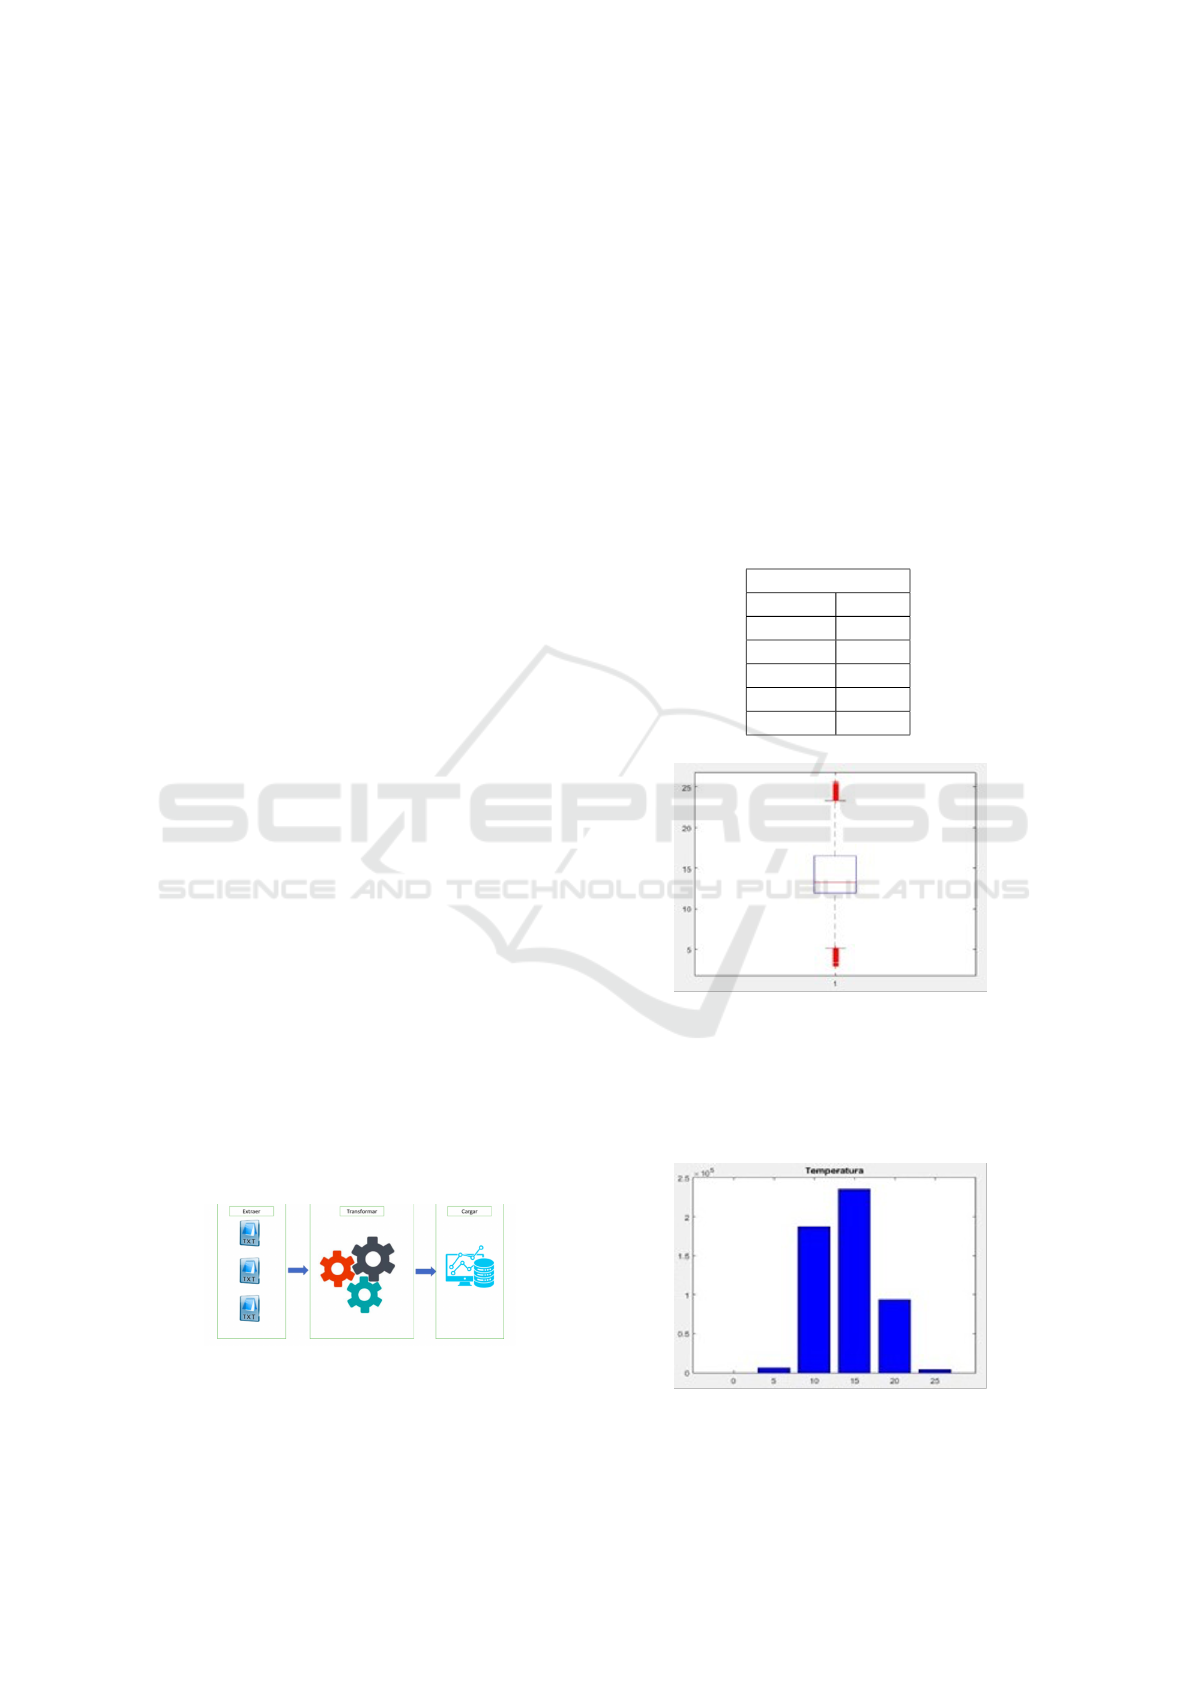
that have been stored in flat files. The Fig. 2,
represents the extraction, transformation and loading
(ETL) model; The data is extracted from the differ-
ent files that are transformed into the date and time
format, erroneous values are also eliminated and the
decimal number format is converted to be able to per-
form the operations necessary for their analysis.
The data is dumped to the database by means of a
synchronization from the transformed flat file.
Figure 2: ETL Big data.
After this process, it can be detailed that dur-
ing the established period of time (01/01/2019 to
12/31/2019), 2,627,951 records have been obtained
between the variables humidity, temperature, wind
speed and wind direction with a 1 minute sampling
period.
3.1 Temperature Analysis
From the analyzed data it can be observed the disper-
sion of temperature values behaved according to Ta-
ble 1, where the maximum values have been 25.58 °C
in the month of November, while the lowest values
2.97°C are reported in September; The Fig. 3, de-
scribes that 50% of the data are in the range of 11.96
°C to 16.49 °C.
Table 1: Statistics of the temperature variable.
Temperature (°C)
Min. 2.97
Q1 11.96
Median 13.25
Average 14.21
Q3 16.49
Max 25.58
Figure 3: Temperature dispersion.
In the frequency distribution presented in Fig. 4, it
is observed that the value that is repeated the most is
15°C followed by a value of 10°C, the atypical values
are found in the values lower than 5°C and higher at
20°C.
Figure 4: Temperature distribution.
SENSORNETS 2022 - 11th International Conference on Sensor Networks
136
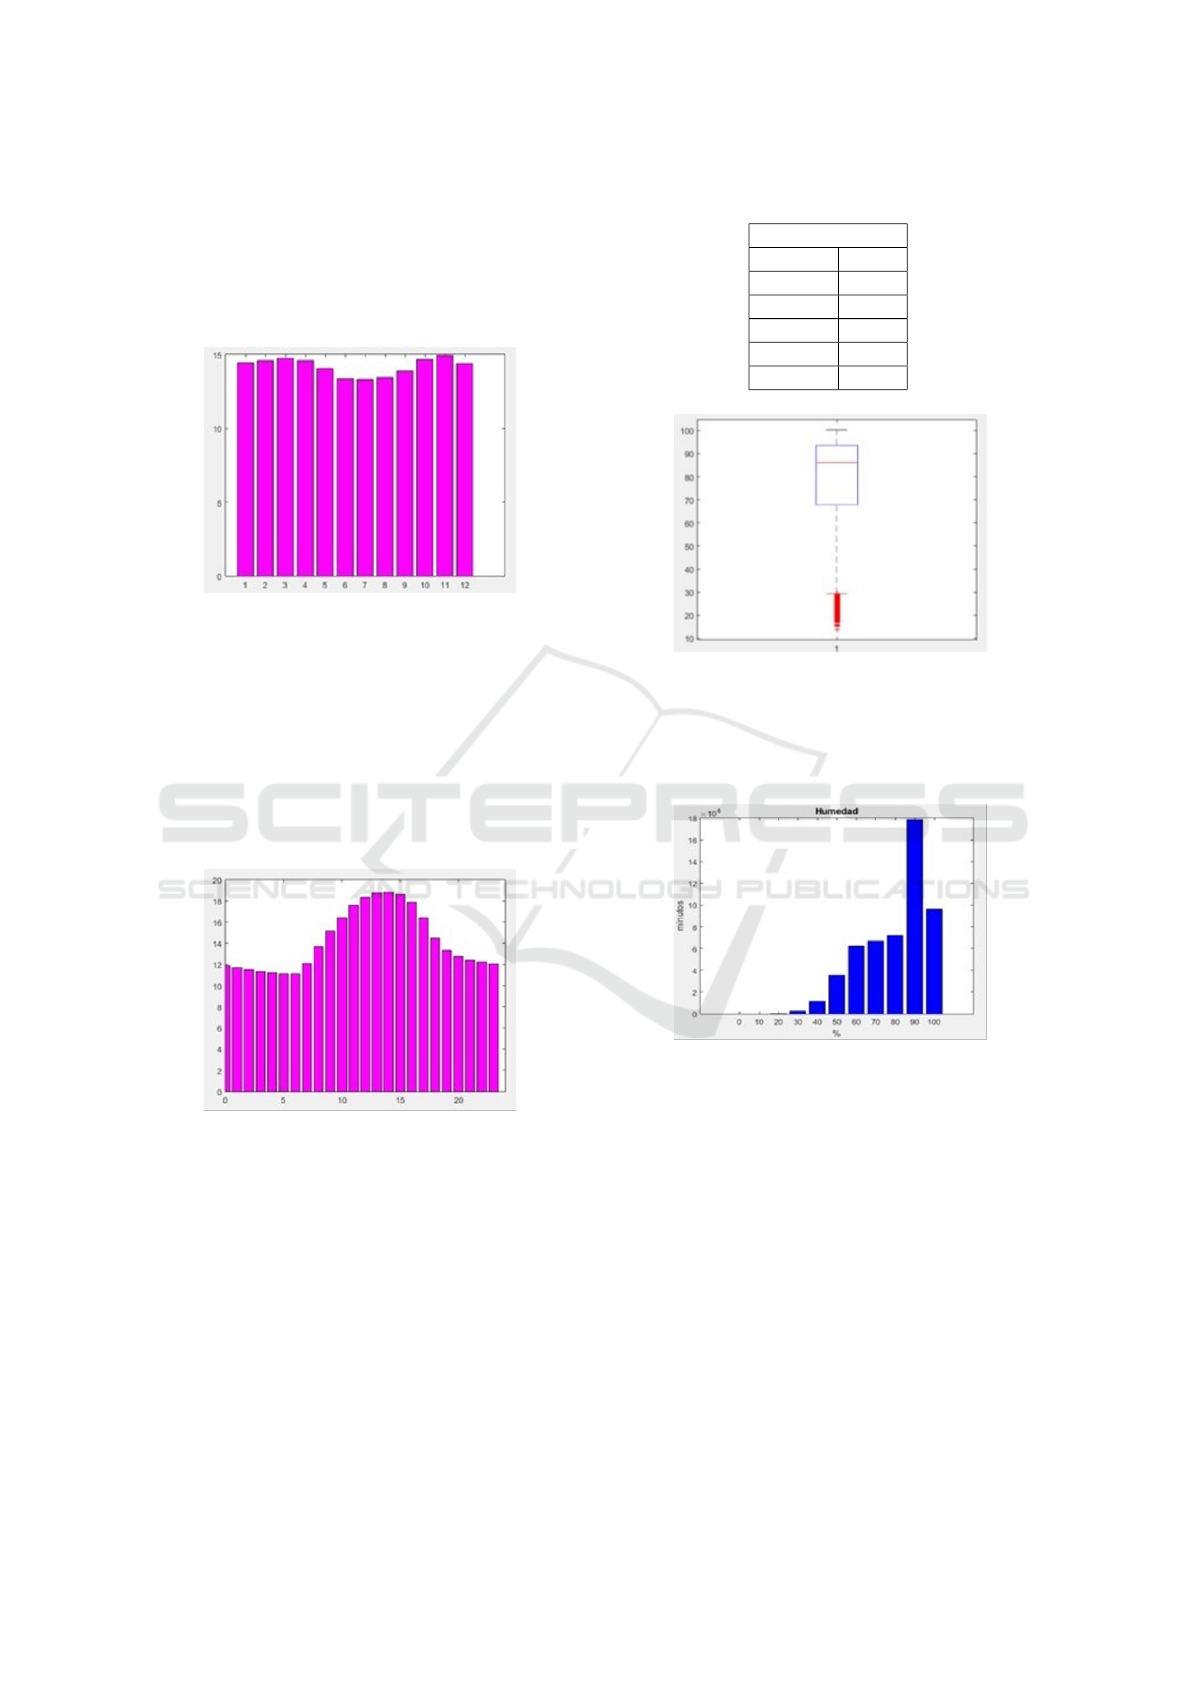
The behavior of the average temperature through-
out the months is observed in Fig. 5; It is determined
that the month of November has a high value while
the months of June and July have low values, in the
scale of the first one month is January and the last
months is December.
Figure 5: Average monthly temperature distribution.
In the Fig. 6, presents the dynamics of the aver-
age temperature within 24 hours of the day; In the 7
:00 range it has an average of 12.11°C, while at 12:00
the average is 18.33 ° C and at 18:00 the average has
been 14.50°C. It is also determined that the tempera-
ture increases from 7:00 to 14:00 and decreases from
15:00 to 21:00; the highest temperature values are
from 12:00 to 15:00 and the lowest from 5:00 to 6:00,
the scale represents 24 hours.
Figure 6: Average hourly temperatures.
3.2 Humidity Analysis
The registered values of this variable show that
the months from June to December present the
highest level of humidity 100% while in the months
of September and November the lowest levels are
16.81% and 13.87%. Half of the recorded data are in
the range of 67.97% to 93.66% Table 2, its median
is at a value of 86.19%, which shows that there is a
greater dispersion between the values of 67.97% and
86.19% Fig. 7.
Table 2: Statistics of the humidity variable.
Humidity (%)
Min. 13.87
Q1 67.97
Median 86.19
Average 80.20
Q3 93.66
Max. 100
Figure 7: Moisture dispersion.
In Fig. 8, it is observed that the value that is re-
peated the most within the year is 90% and the atyp-
ical values are distributed among the values less than
30%.
Figure 8: Moisture distribution.
The incidence of average humidity in the month of
September is the lowest, on the other hand, the highest
is registered in the month of February. The Fig. 9, in
general, the annual average humidity is 80.20%.
The distribution of the average humidity with re-
spect to the hours of the day is shown in The Fig.
10, in which it is observed that the lowest values of
average humidity are in the range of 13:00 to 15:00;
There is also the decrease in humidity from 6:00 to
12:00 and increases from 16:00 to 21:00.
3.3 Wind Speed Analysis
This meteorological variable describes a maximum
value of 10.8 m / s in the month of October, 50% of
MASHCA: Monitoring and Hydro Climatological Analysis of the Urban Microclimate of Latacunga
137
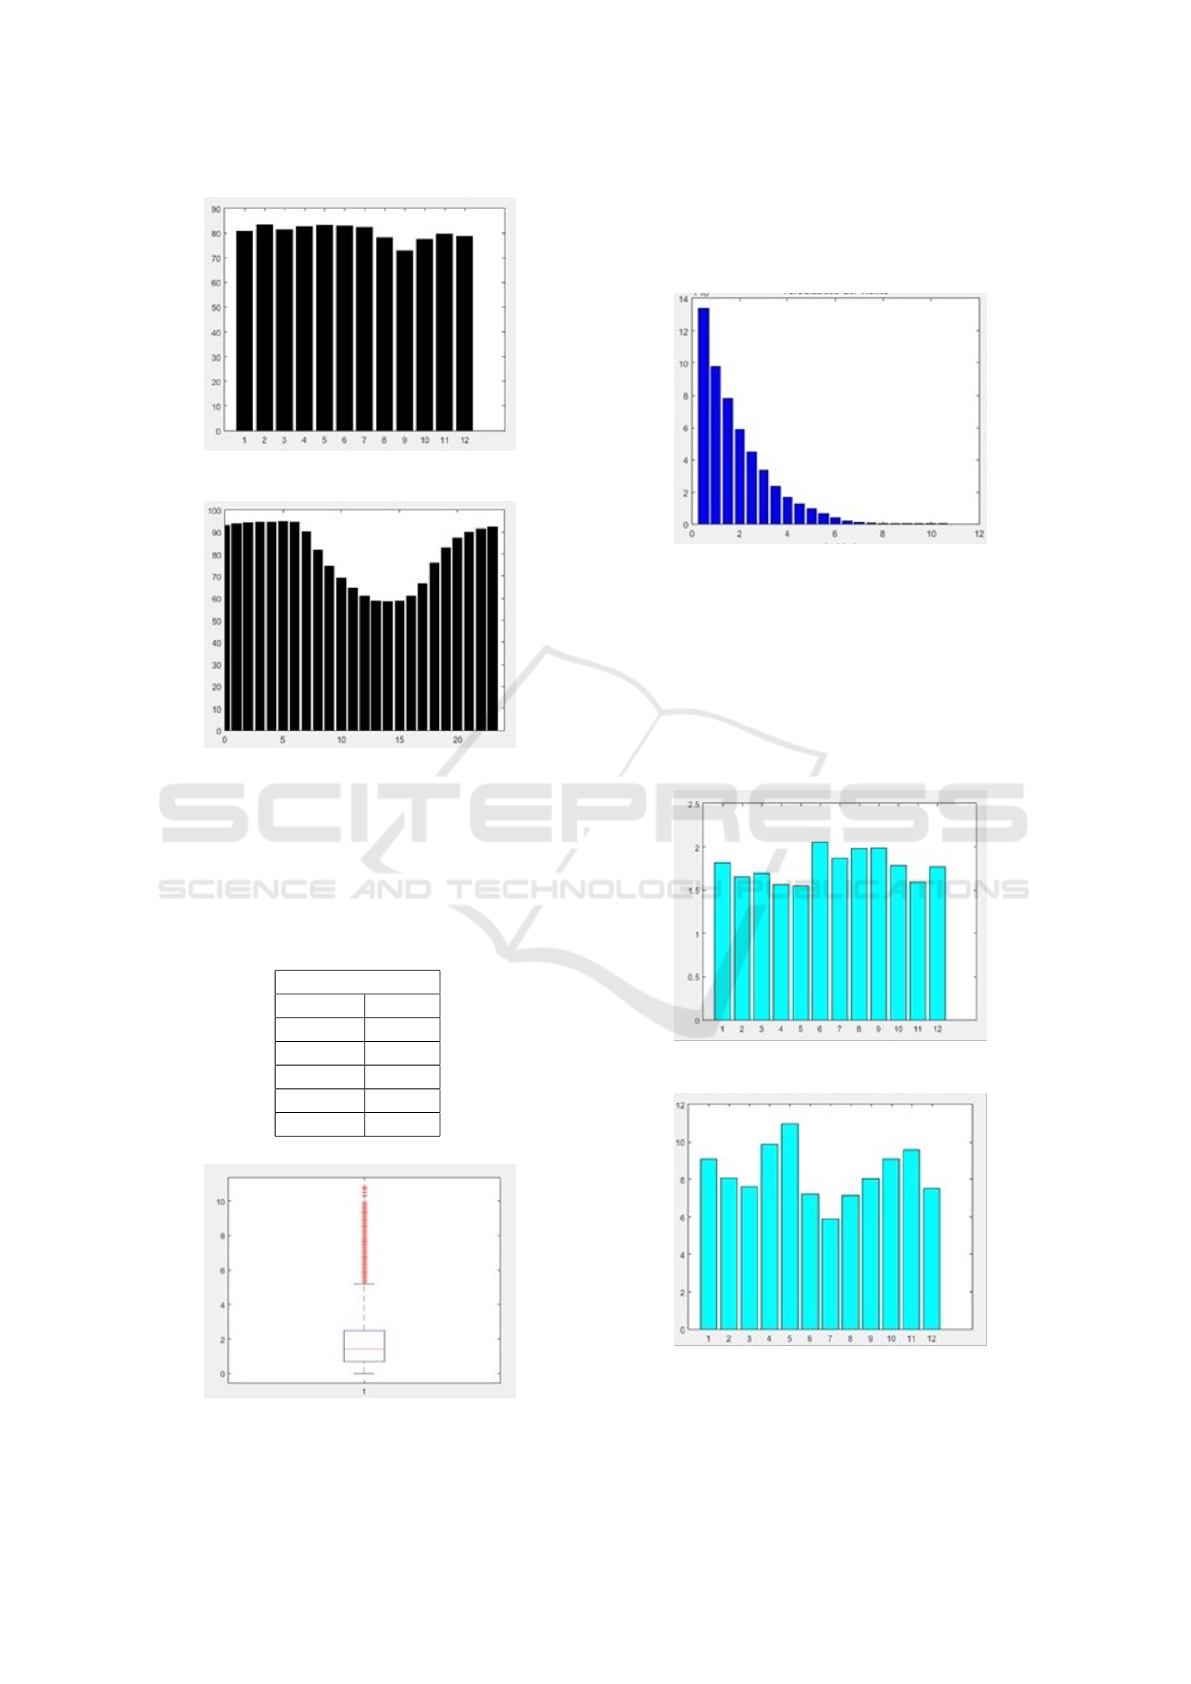
Figure 9: Average monthly humidity distribution.
Figure 10: Hourly average humidity.
the data are clustered between 0.7 m/s and 2.5 m/s,
Table 3. The lower part of the box (Q1-median ) is
less than the upper one (median-Q2); This means that
the values between 25% and 50% of the data are less
dispersed than between 50% and 75%, Fig. 11.
Table 3: Statistics of the variable wind speed.
Wind speed (m/s)
Min. 0
Q1 0.7
Median 1.4
Average 1.78
Q3 2.5
Max. 10.8
Figure 11: Wind speed dispersion.
The Fig. 12, presents the histogram with the fre-
quency of the different wind speeds with a value of
0.5 m/s that is repeated more frequently, followed by
1 m/s and outliers in an interval of 6 m/s onwards.
Figure 12: Wind speed distribution.
The distribution of the average monthly wind
speed is not uniform as shown in Fig. 13, having a
maximum average value in the month of June and a
minimum in the months of April, May and Novem-
ber, it could be argued that its value It tends to 1.78
m/s which represents its annual average value. In Fig.
14, it can be contrast whit the month in which there is
less wind is in the month of May.
Figure 13: Average monthly distribution of wind speed.
Figure 14: Monthly percentage of calm minutes.
The wind speed distributed by hours presents an
interval from 7:00 to 13:00 in which the wind speed
SENSORNETS 2022 - 11th International Conference on Sensor Networks
138
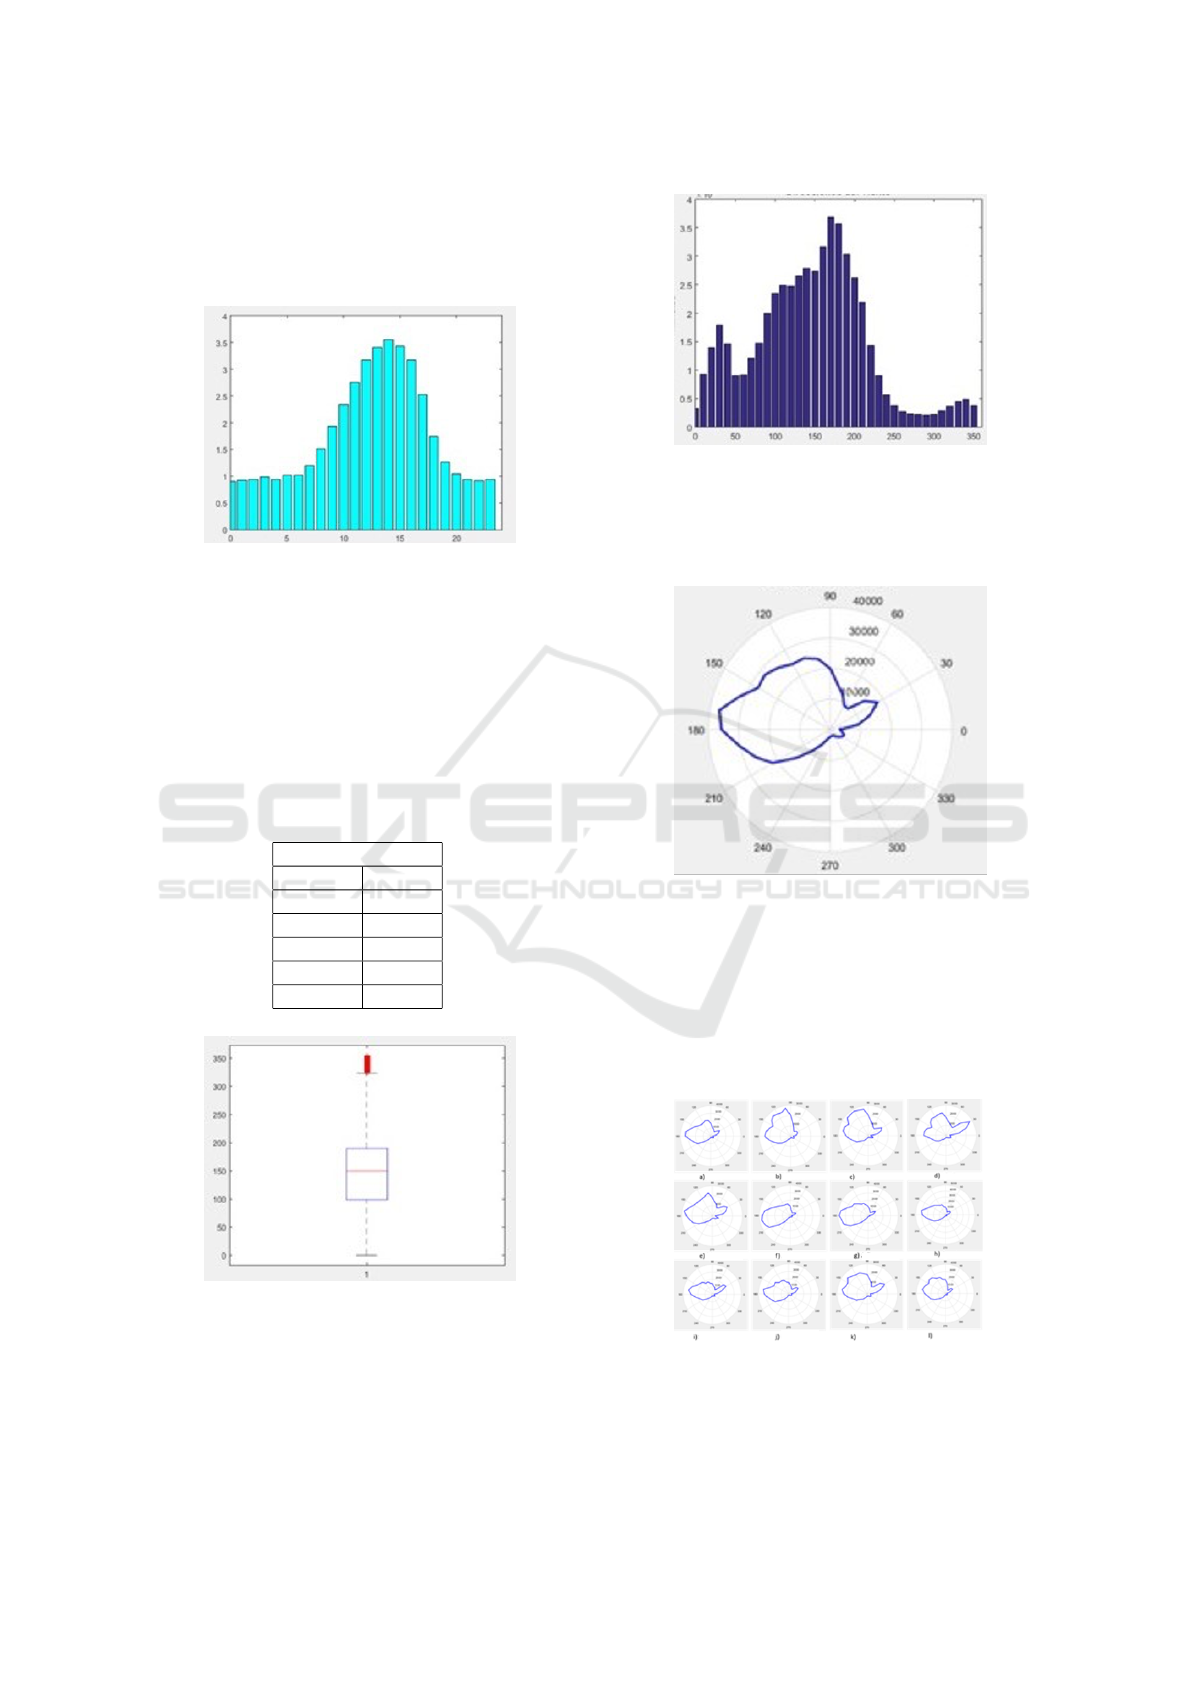
increases until it reaches a maximum value at 14:00,
after which it begins to decrease in the interval from
15:00 to 19:00, in the rest of the hours. presents a
uniform value with slight variations, Fig. 15.
Figure 15: Hourly average wind speed.
3.4 Wind Direction Analysis
This variable is described in degrees having as ref-
erence points 0°, 90°, 180° and 270° that represent
North, East, South and West. Table 4 shows that 50%
of the data are distributed between the values from
99° to 189°, with more dispersed values from 189°
onwards, Fig. 16.
Table 4: Wind speed dispersion.
Wind direction (°)
Min. 0
Q1 99
Median 150
Average 146.01
Q3 189
Max. 354
Figure 16: Wind speed dispersion.
The frequency distribution of the wind direction
Fig. 17, describes that most of the time it has a value
of 170 ° and 180 ° that represent a trend towards the
South.
Figure 17: Wind direction distribution.
The Fig. 18, describes a clearly preferential direc-
tion in the South-East quadrant that concentrates the
greatest amount of data, emerging on the South side.
Figure 18: Polar representation of the annual wind direc-
tion.
In this part can see in Fig. 19, that in the months
of April, May and November there is a partial accu-
mulation towards 30 ° with a high concentration of
values, which contrasts with the minimum monthly
average values of wind speed, while in June and Julio
a symmetry is detected with respect to 180 ° (South).
Figure 19: Polar representation of every months of the year
wind direction.
MASHCA: Monitoring and Hydro Climatological Analysis of the Urban Microclimate of Latacunga
139
3.5 IoT Implementation
In order to meet the second specific objective which
mentions the implementation of a meteorological sta-
tion for the acquisition of data in situ, this station was
selected according to the following criteria: number
of sensors, connectivity, power supply and the avail-
ability of a platform in the cloud. In Table 5, the me-
teorological variables and their measurement ranges
are detailed with their respective accuracy value that
guarantees that the obtained value is close to the real
value.
Table 5: Measurement ranges.
Sensors Values Accuracy
Temperature (C) -40 a 65 ±1ºC
Humidity(%) 10 a 99 ± 5%
Barometric Pressure 8.85 a 32.50 ± 0.08
(inHg) inHg
Solar radiation (lx) 0 a 200000 ±15%
UV index 0 a 15 ± 1
Rain (mm) 0 a 10000 ± 10%
Direction of the wind 0 a 360 ± 1º
Wind speed (km / h) 0 a 160 ±10%
The equipment that meets these characteristics
is the WS2902-B model manufactured by Ambient
Weather, this station is currently installed at the Uni-
versidad de las Fuerzas Armadas ESPE campus Lat-
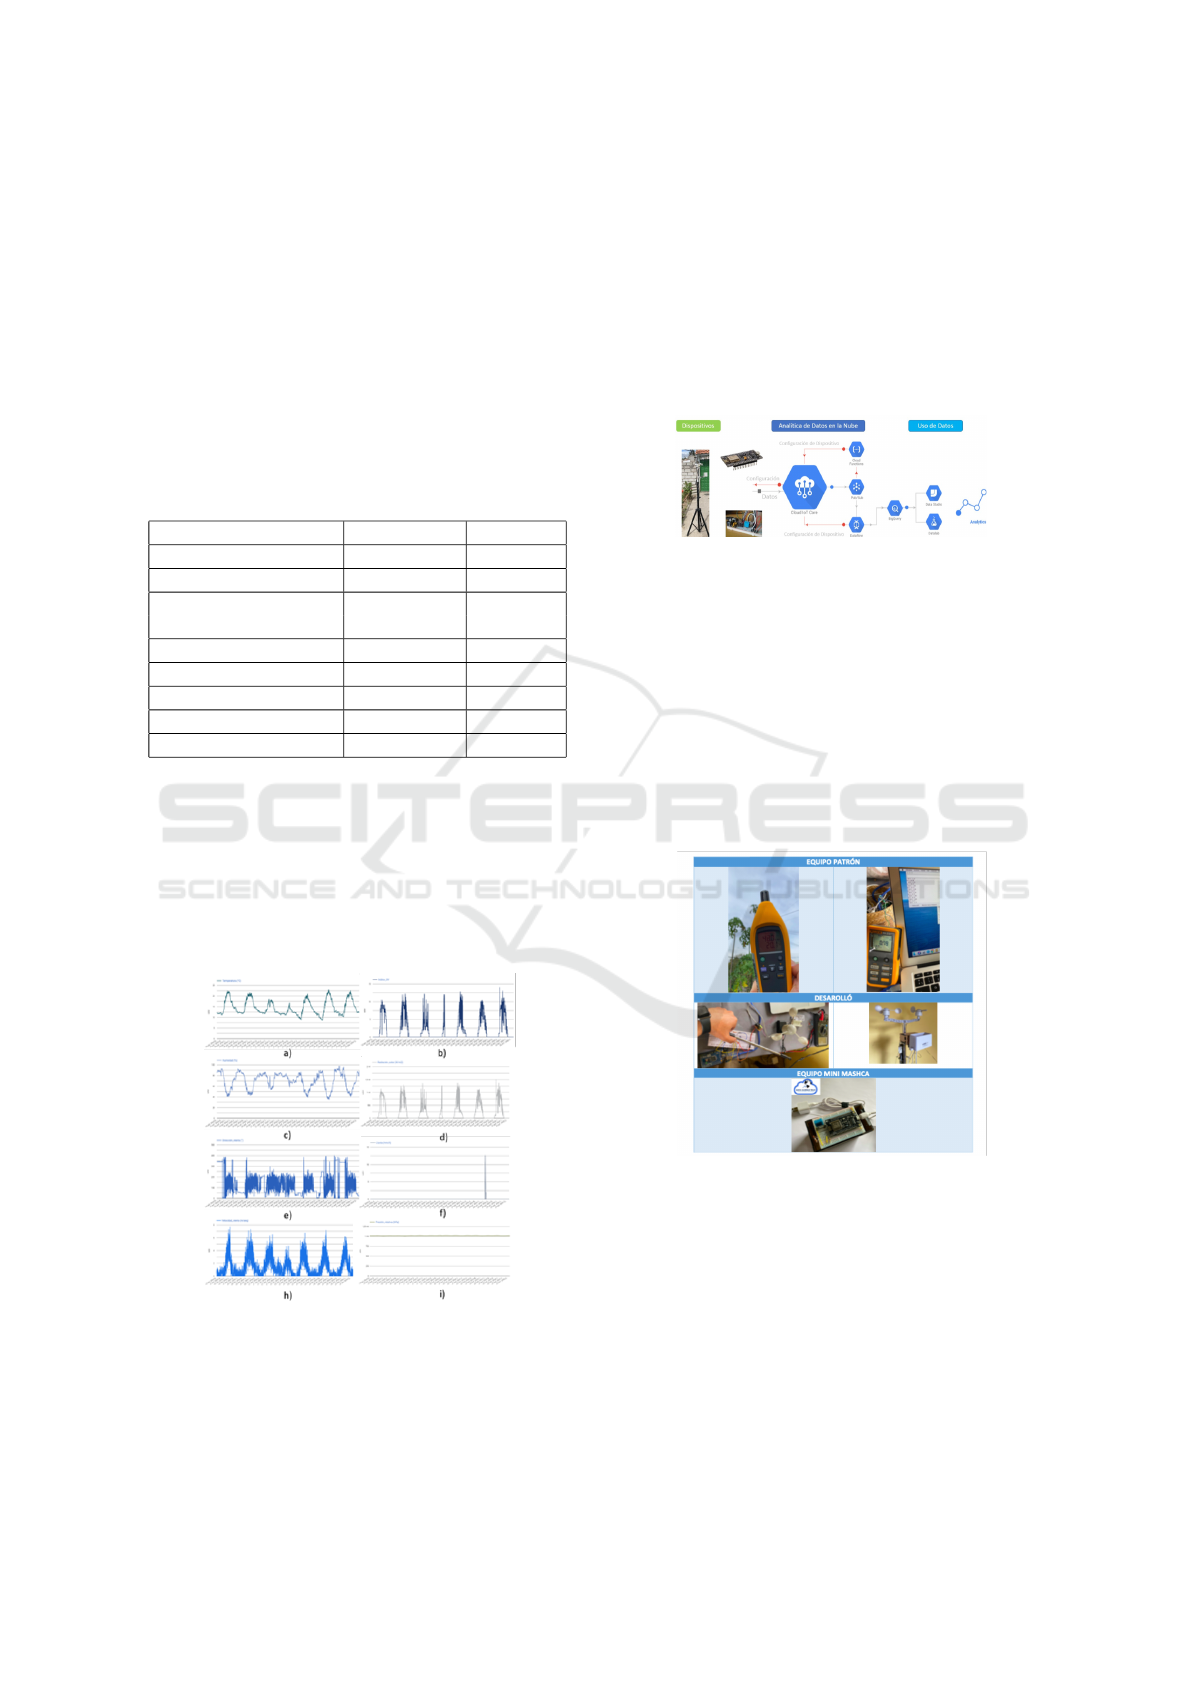
acunga. After the implementation of this equipment,
the following trend graphs were obtained for each of
the climatological variables Fig. 20, the same ones
that represent the data of a complete week
Figure 20: Trends of meteorological variables: a) Tempera-
ture, b) UV Index, c) Humidity, d) Solar Radiation, e) Wind
Direction, f) Rain, g) Wind Speed and h) Relative Pressure.
In order to increase the measurement points, re-
mote micro stations are designed which have as a
characteristic the measurement of temperature and
humidity with storage in the cloud. These teams are
developed in the following architecture that is detailed
in Fig. 21, where the design of devices was done
through the use of Wireless technology. Data Analyt-
ics in the Cloud is carried out through the communica-
tion of data between the device and the development
platform, the use of data involves the study of the his-
torical analytics of the data with statistical techniques.
Figure 21: Data Architecture.
In order to begin, the platform used for the de-
velopment of the architecture is described. This is
GOOGLE CLOUD PLATFORM. Thanks to all the
characteristics of integration, programming and use of
data, through friendly programming interfaces, with
different ecosystems of devices connected to the in-
ternet, once the hardware has been designed, im-
plemented and installed, the measurement processes
and their corresponding adjustments are carried out
through comparative calibration techniques with stan-
dard instruments.
Figure 22: Instances of standard equipment development,
Mini-MASHCA.
The information acquired by these points was con-
trasted with the Fluke-971 (TEMPERATURE, HU-
MIDITY METER) and Fluke-923 (AIR VELOCITY
METER) standard equipment. Obtaining a measure-
ment error between the standard instrument and the
micro stations with the following quantities: 9.2% for
temperature and 2.5% for humidity, this can be seen in
Fig. 22 where the value acquired by the micro station
is displayed versus the data acquired by the standard
equipment.
SENSORNETS 2022 - 11th International Conference on Sensor Networks
140
In order to comply with the following specific ob-
jective in which it is mentioned developing a web ap-
plication to visualize the data and interpret the analy-
sis thereof, a website has been implemented accord-
ing to the following characteristics.
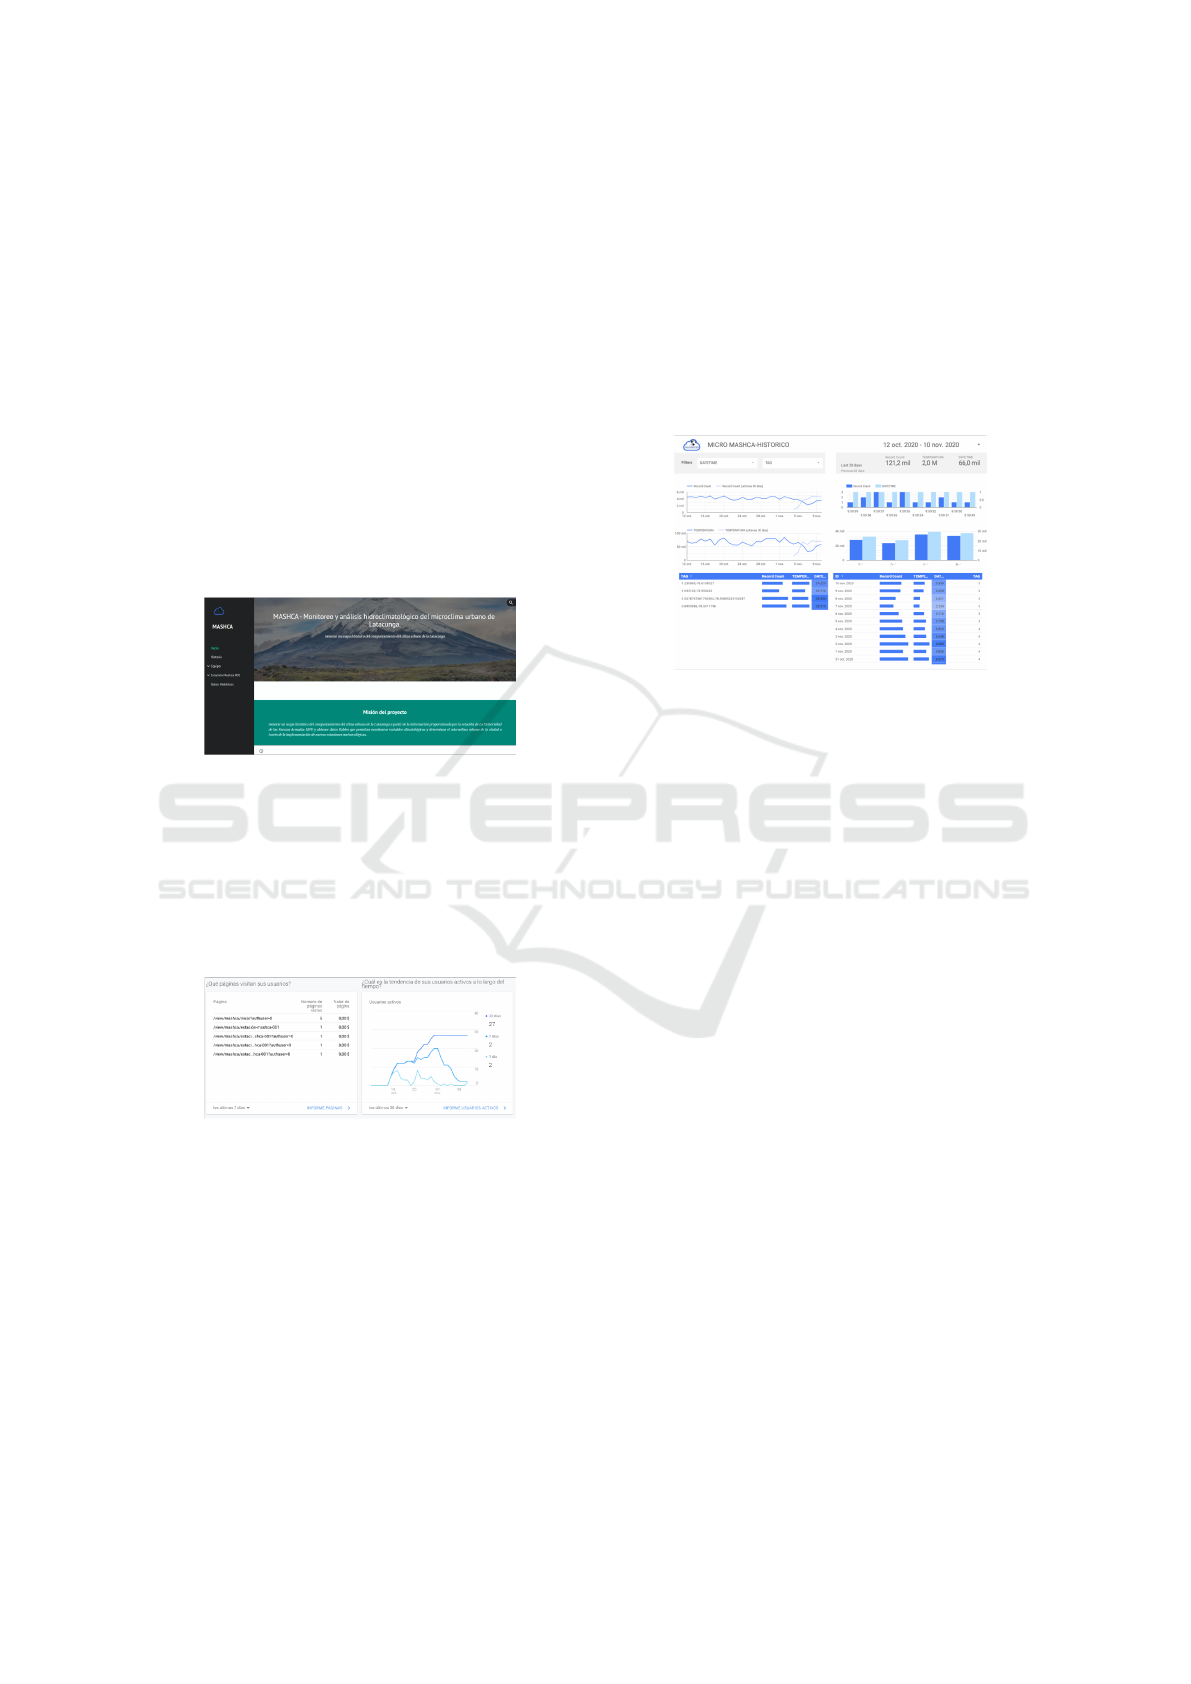
3.6 Web Site Diagram
In the following URL: (https://sites.google.com/
view/mashca), the information of the station installed
in the Universidad de las Fuerzas Armadas ESPE
campus Latacunga and the micro meteorological sta-
tions installed in urban areas are displayed, In this
web application you can see the time values of each of
the variables with their respective trends in a 24 hour
range and the table of values of the previous day, Fig.
23.
Figure 23: MASHCA Web Application.
Using the GOOGLE ANALYTICS tool, as shown
in Fig. 24, it has been possible to observe the behav-
ior of the users who enter the website, the data that
are most consulted. It has been determined that mea-
surement of data visited by users. (where the number
of page views is shown, the page value, as well as the
active users.
Figure 24: Measurement of data visited by users.
After fulfilling the aforementioned objectives,
which have corroborated the general objective of this
project, which is ”To develop a monitoring and analy-
sis system of the urban microclimate of Latacunga.” ,
where a historical record of the behavior of the urban
climate of Latacunga with respect to the year 2019 has
been generated, based on the information provided
by the station of The Universidad de las Fuerzas Ar-
madas ESPE. Finally, the urban microclimate of the
city was determined through the implementation of
new meteorological stations, among the indicators is
information such as the date of consultation of each
tag (device), the number of consultations made to the
tag and the respective events of the Climatological
variables collected according to the season that is ac-
cessed. All this is shown in Fig. 25. As a final re-
sult, it has been shown that under the cloud computing
scheme where historical data has been used, new data
stored in the cloud, through meteorological stations
under the IoT paradigm, it has been possible to moni-
tor the different nuances of the urban microclimate of
the city of Latacunga.
Figure 25: Dynamic data trend.
4 CONCLUSION
The study of urban microclimates at present is serving
not only the knowledge of the behavior of the climate
in a certain geographical area of the country, but also
in the planning of study disciplines in the social field
such as tourism; This by virtue of the data collected,
processed and exposed, since in the field of tourism in
general and in the same sector of the economy but in
Latacunga in particular, due to its architectural com-
position, allows public or private entities involved in
tourism, forecast the behavior of the weather at cer-
tain hours, which in the case of this recommendation
is tourism, that is, the data will allow tourists to know
how the weather will behave in the urban part of Lat-
acunga on a given day, this since The city is a purely
urban or cultural tourist destination, and the weather
factor is a transcendental point in the daily planning
of the tourist, no travelers wants to go to the beach in
cold weather, so neither does any cultural tourist want
to visit the city in a day of heavy rain.
With the fulfilment of the general objective and
the specific objectives, the hypothesis that mentions
that from the analysis of the data obtained by the me-
teorological stations can be made a map of the be-
havior of the urban microclimate of Latacunga can
be considered, this can be done when the quantity of
existing data acquires the necessary density to cap-
ture the resource, which could be verified through
the implementation of micro meteorological stations,
MASHCA: Monitoring and Hydro Climatological Analysis of the Urban Microclimate of Latacunga
141

developed to measure, with temperature and humid-
ity measurement characteristics, within the standard-
ized measurement ranges for the stations meteorolog-
ical conditions and with an average error of less than
3%.With the application of the measurement of the
climate carried out by the meteorological stations in-
stalled in strategic points of the urban area of Lata-
cunga, the changes generated by urban development
and the presence of microclimates, due to structural
changes of buildings throughout history, were demon-
strated. of the city since the synergy of new and old
constructions in the environment give way to confirm
this change in the data, with comparisons with his-
torical data of the climate registered in the city espe-
cially using databases of state entities. It can also be
mentioned that the historical information of the cli-
mate in Latacunga that was recorded by the station
was contrasted with the information acquired in real
time through the Data Studio software which gener-
ates reports of the behavior of the climate in the city,
having an appreciation of data taken in urban environ-
ments.
The dissemination of the results obtained as a test
has been registered among a limited group of people
who have generated recommendations to improve the
graphic interface of the website, the ways of present-
ing the data, navigation schemes among others, thus
allowing improve interaction with users. In this sec-
tion, the participation of teachers and students of the
participating universities, members of local govern-
ment bodies, citizens in general, among others, who
present a wide spectrum of points of view on the pre-
sentation of the information acquired and processed,
can be noted. Where it was determined that the most
appropriate way for researchers to access this data is
through a web page, due to the versatility of sharing
information regardless of the operating system, which
is used due to the expertise of the developers. Realiz-
ing that it is the most appropriate form of presentation
of data for technical reasons such as: data availabil-
ity, latency, ability to mine data in this type of web
applications.
The reports generated from the analyses carried
out present a glimpse of the climate behavior within
the city. This information was obtained through the
analysis of large volumes of data, for which cloud
servers were used where the data generated by the
professional weather station and the weather micro-
stations are stored, the reports are processed and gen-
erated. are presented on the website, which can be
accessed by any citizen to consult the behavior of the
climate in real time of the climatological variables
that affect the microclimate, it should be noted that
all the information contained in the site has been de-
scribed in the previous sections, where the parameters
of time, amount of data, frequency of use as well as
climate variables are clearly identified in detail.
FUTURE WORKS
The future lines to follow are the use of artificial intel-
ligence in order to generate algorithms for predicting
climate behavior, adding other types of variables such
as urban maps, urban planning, among others. In the
design of devices, the implementation of spaces con-
nected to the internet with 5G can be considered, im-
proving the capacity of the devices to collect informa-
tion as well as becoming pioneers in the development
of this type of technology. On the other hand, a dis-
semination plan for the project must be carried out at
the level of social networks, citizen groups.
ACKNOWLEDGEMENTS
The authors thank the higher education institutions
that contributed to the research with their authors,
such us: Universidad de las Fuerzas Armadas ESPE,
Instituto Superior Tecnol
´
ogico Mar
´
ıa Natalia Vaca,
Universidad Polit
´
ecnica Salesiana, Cuenca, Univer-
sidad Internacional de Valencia, Colegio Primero de
Abril, Latacunga, Ecuador, Instituto Superior Tec-
nol
´
ogico Ba
˜
nos, Consorcio de Gobiernos Aut
´
onomos
Provinciales del Ecuador, Red de desarrollo urbano
sostenible Cotopaxi-GIS, and the projects MASHCA-
REDUS 2020, ”Prototype of early warning systems
for frost”, as well as the project number ESPE-008-
007-2017-07-27: “PLATANO – Intelligent Techno-
logical Support Platform for small and medium agri-
cultural producers”, carried out jointly with the Uni-
versidad Politecnica Salesiana collaboration, and the
Wicom Energy Research group.
REFERENCES
Abad, J., Farez, J., Chasi, P., Guillermo, J., Garc
´
ıa-Cede
˜
no,
A., Clotet, R., and Huerta, M. (2019). Coffee crops
variables monitoring: A case of study in ecuadorian
andes. Advances in Intelligent Systems and Comput-
ing, 893:202–217. cited By 4.
Amani-Beni, M., Chen, Y., Vasileva, M., Zhang, B., and
Xie, G.-D. (2022). Quantitative-spatial relationships
between air and surface temperature, a proxy for
microclimate studies in fine-scale intra-urban areas?
Sustainable Cities and Society, 77. cited By 0.
Barrios-Bello, K., Monica, H., Gonzalez-Benitez, R.,
SENSORNETS 2022 - 11th International Conference on Sensor Networks
142

Otero-Escobar, A., Garizurieta, J., Catalina, P., Boris,
B., Juan, G., Andrea, G.-C., and Roger, C. (2019).
Prototype of seismic alarm based on internet of things.
volume 2019-November. cited By 1.
Barton, J. R. (2013). Climate change adaptive capacity in
santiago de chile: Creating a governance regime for
sustainability planning. International Journal of Ur-
ban and Regional Research, 37(6):1916–1933.
Bonan, G. B. (2000). The microclimates of a suburban col-
orado (usa) landscape and implications for planning
and design. Landscape and Urban Planning, 49(3-
4):97–114.
Brown, R. (2018). Urban design and city microclimates.
Atmosphere, 9(11):448.
Brozovsky, J., Gustavsen, A., and Gaitani, N. (2021). Zero
emission neighbourhoods and positive energy districts
– a state-of-the-art review. Sustainable Cities and So-
ciety, 72. cited By 11.
Gabriela, C.-V., Monica, H., Andrea, G.-C., Juan, G., Boris,
B., Catalina, P., Roger, C., Giovanni, S., and Jose-
Ignacio, C.-V. (2019). Soil conditions monitoring and
on rail irrigation for an urban crop in cuenca. volume
2019-November. cited By 0.
Garcia-Cedeno, A., Guillermo, J., Barzallo, B., Punin, C.,
Soto, A., Rivas, D., Clotet, R., and Huerta, M. (2019).
Platano: Intelligent technological support platform for
azuay province farmers in ecuador. cited By 2.
Guillermo, J., Garc
´
ıa-Cede
˜
no, A., Rivas-Lalaleo, D.,
Huerta, M., and Clotet, R. (2019). Iot architecture
based on wireless sensor network applied to agricul-
tural monitoring: A case of study of cacao crops in
ecuador. Advances in Intelligent Systems and Com-
puting, 893:42–57. cited By 10.
Huerta, M., Garcia, A., Guillermo, J., and Clotet Martinez,
R. (2021). Wireless sensor networks applied to preci-
sion agriculture: A worldwide literature review with
emphasis on latin america. IEEE Geoscience and Re-
mote Sensing Magazine. cited By 1.
Maiullari, D., Gherri, B., Finizza, C., Maretto, M., and
Naboni, E. (2021). Climate change and indoor tem-
perature variation in venetian buildings: The role of
density and urban form. volume 2042. cited By 0.
Marando, F., Heris, M., Zulian, G., Ud
´
ıas, A., Mentaschi,
L., Chrysoulakis, N., Parastatidis, D., and Maes, J.
(2022). Urban heat island mitigation by green infras-
tructure in european functional urban areas. Sustain-
able Cities and Society, 77. cited By 0.
Padmanabhamurty, B. (1990). Microclimates in tropical ur-
ban complexes. Energy and Buildings, 15(1-2):83–92.
Sichiqui, F., Huilca, J., Garc
´
ıa-Cede
˜
no, A., Guillermo, J.,
Rivas, D., Clotet, R., and Huerta, M. (2020). Agricul-
tural information management: A case study in corn
crops in ecuador. Advances in Intelligent Systems and
Computing, 1066:113–124. cited By 2.
Teichmann, F., Baumgartner, C., Horvath, A., Luisser, M.,
and Korjenic, A. (2021). Simulation of urban mi-
croclimate with uhisolver: software validation using
simplified material data. Ecological Processes, 10(1).
cited By 0.
Ulpiani, G., Ranzi, G., and Santamouris, M. (2021). Lo-
cal synergies and antagonisms between meteorologi-
cal factors and air pollution: A 15-year comprehen-
sive study in the sydney region. Science of the Total
Environment, 788. cited By 4.
Yoon, S., Jang, S., Rhee, J., and Cho, J. (2017). Analysis of
future extreme rainfall under climate change over the
landslide risk zone in urban areas. Korean Society of
Hazard Mitigation, 17(5):355–367.
MASHCA: Monitoring and Hydro Climatological Analysis of the Urban Microclimate of Latacunga
143
