
Water Consumption Demand Pattern Analysis using Uncertain Smart
Water Meter Data
Milad Khaki
12 a
and Nasim Mortazavi
2 b
1
Electrical and Computer Engineering Department, University of Waterloo, Waterloo, Canada
2
Robarts Research Institute, Western University, London, Canada
Keywords:
Smart Water Meters, Data Mining, Big Data, Big Data Errors, Case-based Reasoning.
Abstract:
Wireless ‘smart’ water meters that allow functionalities such as demand response, leak alerts, identification
of characteristic demand patterns, and detailed consumption analysis are becoming an essential part of water
infrastructure in many countries. To achieve these benefits, the meter data needs to be error-free, which is
not necessarily available in practice due to ‘dirtiness’ or ‘uncertainty’ of data, which is mostly unavoidable.
Additionally, by analyzing the smart meter data and finding demand patterns, it is possible to provide insights
to the municipalities to improve their distribution network, better understand demand characteristics, identify
the consumers that are the main sources of shaping the high consumption peaks. This paper investigates
solutions to mine the uncertain data, ensures the validity of results, and evaluates the impact of dirty data on
data analysis results. Once the reliability of results is ensured, the evaluation results can be used for informed
decision-making on water planning strategies. Secondly, the consumption pattern of a city equipped with 25
thousand water consumers is analyzed, and weekly consumption profiles over an entire year are presented
for single-family residential consumers. Additionally, a systematic study of the errors existing in large-scale
smart water meter deployments is performed to better understand the nature of errors in such data sources,
particularly at the first stages of implementation of smart metering infrastructure. Also, the sensitivity of the
results to various types of errors in a big data system is presented and investigated.
1 INTRODUCTION
As a cost-saving measure, many municipalities have
decided to install wireless ‘smart’ water meters that,
in addition to all other benefits, primarily enable them
to read meters remotely. Toronto and Saskatoon, in
Canada, and Baltimore and Pittsburgh, in the United
States A substantial fraction of data obtained from
virtually all large-scale meter deployments can be
incorrect (such as examples in (Quilumba, F.L. and
Wei-Jen Lee and Heng Huang and Wang, D.Y. and
Szabados, R., 2014), (Liu et al., 2018), (Shishido,
Juan, 2012), (Kaisler, Stephen and Armour, Frank
and Espinosa, J Alberto and Money, William, 2013),
(Sivarajah et al., 2017), (Chen et al., 2013), (Lon
House, 2011), and (Courtney, 2014)).
The focus of this paper is to highlight the detri-
mental effects of data errors in reducing the benefits
of using the concept of big data. The impact of uncer-
tain data on the identification of customers contribut-
a
https://orcid.org/0000-0003-0566-727X
b
https://orcid.org/0000-0002-3257-2463
ing to a peak load is examined to evaluate the data
quality. The proposed progressive approach helps to
determine errors, their origins and find solutions to
remove them. Essentially, data cleaning or data qual-
ity evaluation must precede any data analysis from
smart meter data. The contributions of this work can
be summarized as (1) a systematic study of the errors
existing in large-scale smart water meter deployments
and water literature, (2) proposing a progressive data
cleaning approach to the problem of finding errors in
smart meter data (3) a careful study of the impact of
dirty data on peak load attribution, and (4) introduc-
ing and classification of techniques available for re-
moving errors from dirty data; including those meth-
ods applied in this study. The remainder of the paper
is structured as follows. Section 2 provides a gen-
eralized model of smart water meter infrastructure.
The progressive data cleaning approach is presented
in Section 3, the data quality issues mainly encoun-
tered in the current study, together with the adopted
or produced solutions. As the final part of the case
study, the results of using the cleaned dataset are pre-
436
Khaki, M. and Mortazavi, N.
Water Consumption Demand Pattern Analysis using Uncertain Smart Water Meter Data.
DOI: 10.5220/0010834900003116
In Proceedings of the 14th International Conference on Agents and Artificial Intelligence (ICAART 2022) - Volume 3, pages 436-443
ISBN: 978-989-758-547-0; ISSN: 2184-433X
Copyright
c
2022 by SCITEPRESS – Science and Technology Publications, Lda. All rights reserved

sented in Section 4, and the sensitivity of these results
to errors is also examined.
2 PROBLEM DEFINITION
The first part of the current section describes a top-
down architecture of a smart water metering infras-
tructure. In the second part, various errors that can be
encountered in such a system (based on experts’ ex-
perience and reports in the literature) are discussed.
Finally, the approaches adopted previously are pro-
vided in several distinct categories, and similar stud-
ies in smart electrical energy generation and transmis-
sion systems are also compared and analyzed.
2.1 Smart Metering Infrastructure
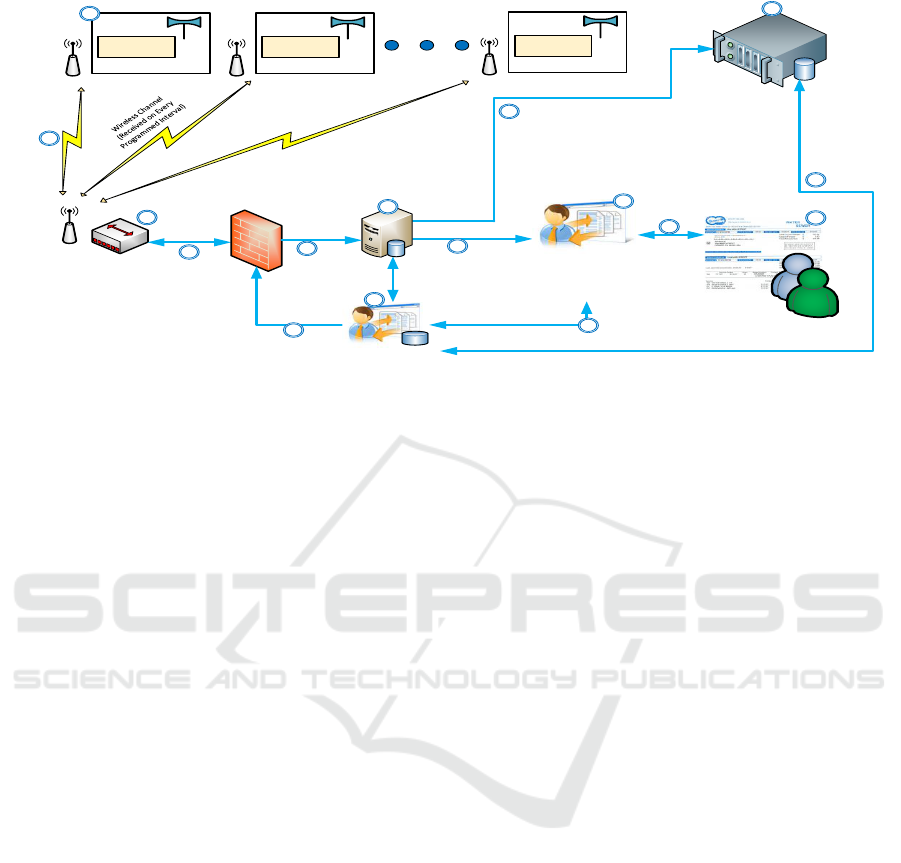
Figure 1 shows a general configuration of a smart
meter infrastructure in the case of water supply net-
works. The proposed figure is based on the current
case study. In addition, to keep it generalized, it is in-
fluenced by the diagrams suggested by the following
articles: (Stewart, Rodney A and Willis, Rachelle and
Giurco, Damien and Panuwatwanich, Kriengsak and
Capati, Guillermo, 2010), (Makki, A.A. and Stew-
art, R.A. and Panuwatwanich, K. and Beal, C., 2013),
(Quilumba, F.L. and Wei-Jen Lee and Heng Huang
and Wang, D.Y. and Szabados, R., 2014), (Hsia, S.C.
and Hsu, S.W. and Chang, Y.J., 2012), (Leeds, 2009),
(Zhang et al., 2017), and (Farhangi, H., 2010)). The
block diagram in Figure 1 is composed of the follow-
ing parts:
Block (A), wireless smart meters distributed
around the city measure water consumption in a stan-
dard unified unit, e.g. [m
3
]. Block (B), wireless
data collectors are hardware-specific data collection
servers responsible for collecting the readings from
meters at every interval and transferring them wire-
lessly/wired to the data warehouse Block (C) is the
control centre of the utility infrastructure. Commands
to re-configure the meters or collectors are relayed
through this block. Block (D) is the Temporary Mea-
surement Data Storage; it receives the raw measure-
ment data from the collectors and provides outputs for
blocks E, and F. Block (E) is the long-term storage or
archive of the network and stores the data for future
analyses. Any further access or modification to the
archived data is provided through Block C. Block (F)
is the billing system and can join the raw meter read-
ings received from the meters with the meter-specific
unit information.
2.2 Data Analysis Difficulties
As we are currently in a worldwide installation phase
of the SMI, the focus of most studies is the immediate
advantages, such as time-of-user pricing (Lon House,
2011), efficient automatic billing instead of the man-
ual process (Khalifa, T. and Naik, K. and Nayak, A.,
2011), and early fault detection in the network (Hsia,
S.C. and Hsu, S.W. and Chang, Y.J., 2012). Although
various SMIs provide various benefits, validity veri-
fication of the measurement data is essential. How-
ever, several reports of smart water meter measure-
ment errors among the growing body of studies, such
as (Mukheibir et al., 2012). The factors that influence
the data quality of water meter readings are discussed
by (Mukheibir et al., 2012) and (Arregui, Francisco
and Cabrera, E and Cobacho, Ricardo and Garc
´
ıa-
Serra, Jorge, 2005): 1) noisy communication chan-
nels that would lead to corruption of the incoming
data messages 2) minor inconsistencies in the meter
data input result in significant uncertainty in the re-
sults too (Aijun et al., 1996).
Data quality challenges are introduced in the re-
mainder of this section, and some possible starting
points will be suggested concerning Figure 1.
Duplicate Records, because of the communica-
tion channel problems, Paths (P) or (N), the server
might ask the collector or the meter to retransmit
the data. Missing Records, similarly, because of
the communication channel issues, some recordings
would be irreversibly lost. Any communication chan-
nel problems between Blocks A and B or an inter-
rupt in the storage services of Blocks D, E, or F can
cause this issue. Measurement Granularity Errors,
in some cases, a meter can have coarse grain res-
olution and cause this error, which is restricted to
Block A (i.e. [m
3
] instead of litres). As a result,
the accuracy of the meter would be virtually reduced.
Block C should ensure that the temporary data stored
at Block D do not have such problems. Spikes are
abrupt and short-duration changes in the consump-
tion pattern that are not a valid representation of the
actual consumption. The sources of spikes could be
mechanical faults of the meter or storage of multiple
inconsistent readings for the same timestamp Meter
Unit Inconsistencies. This error can be originated
by meter unit changes that are not back-propagated
in the archived records. In such cases, Block C’s de-
cisions are affecting Block A’s configuration. How-
ever, this error type would not necessarily change
Block E’s billing records, as, at the time of calculat-
ing corresponding billing values, there is no discrep-
ancy between meter readings and its respective unit.
Meter Counter Resets, the smart meters usually ac-
Water Consumption Demand Pattern Analysis using Uncertain Smart Water Meter Data
437
SWM
REGISTER
(Cumulative Int erval Readings)
A
Wireless Data
Collectors
CCUs
(Approximately one
per 1000
Smart Meter)
B
Current Billable
Readings
(D to F)
G
GPRS
or
Ethernet
Billings
For
Consumers
(F to G)
Consumer
Concerns
And complaints
(G to f)
SWM
REGISTER
(Cumulative Int erval Readings)
SWM
REGISTER
(Cumulative Int erval Readings)
Infrastructure
Administration
and Planning
Firewall
Primary Meter and Collector
configuration requests (F to C)
And Archived Billing Records
(C to F)
Transferring
Meter and Collector
Change Requests
(C to B and A )
Billing
Software and
GUI
F
Long Term
Storage for
Measurements
E
Temporary
Measurement
Data Storage
D
Customers
Smart Water Meter Smart Water Meter
Smart Water Meter
Transformed
(or Raw)
Reading and
Interval Data
Exports
for Archive
(D to E)
H
J
K
L
M
N
P
Q
C
Gathered
Data
From all
Meters
(A and B to D)
Consumption
Monitoring
Updates to
Archived Data
(C to E)
Receive Archive
Data for Analysis
and Data Mining
(E to C)
R
Figure 1: Block diagram of the wireless water metering infrastructure.
commodate a counter that registers the consumption
at every interval cumulatively. In general, the me-
ter only communicates these cumulative readings to
the server. Therefore, if the server re-configures the
meter, it can also cause a reset on its register with
a faulty command. In Figure 1, this inconsistency
is caused by Block C and affects Block A. Meter
Under/Non-Registration Errors; a popular belief is
that a smart meter has high precision and would not be
prone to measurement errors. As smart meters are the
next generation of traditional ones, the accuracy prob-
lems existing in the traditional meters also occur in
them (Khalifa, T. and Naik, K. and Nayak, A., 2011).
Analysis of the current literature in SMIs for Water
systems shows that most studies do not evaluate data
quality against the mentioned errors. However, data
quality errors have impeded gaining the expected re-
sults in most of these studies. In addition, few pa-
pers in electrical engineering-based smart meter in-
frastructures have focused on these errors either. Only
Quilumba et al. and Shishido, a technical report, have
acknowledged the existence of some of the mentioned
errors in their study and provided some solutions for
handling them ((Quilumba, F.L. and Wei-Jen Lee and
Heng Huang and Wang, D.Y. and Szabados, R., 2014)
and (Shishido, Juan, 2012)).
2.3 Related Works
The water meters are prone to data quality errors,
such as over- and under-registration, which are di-
rectly proportional to length and amount of us-
age (Mukheibir et al., 2012). As one of the contri-
butions of the current paper, a summary of the state-
of-art methods for evaluating and improving the data
quality of water meter data in the literature is pro-
vided. In general, three approaches to dealing with
data quality issues are presented, outlined in the re-
mainder of this section. The first approach to dealing
with errors is simplifying the problem and discard-
ing the detrimental effect of errors because of the low
proportion of errors to clean data. For example, (Beal
et al., 2011) and (Beal, Cara and Stewart, Rodney A.
and Huang, T. and Rey, E., 2011) provide consider-
able detail about the procedures for installing smart
meters and gathering data. However, as the data qual-
ity is not discussed, it is assumed that the collected
data is error-free.
The second approach is to discard the datastreams
that are highly suspected of having errors. For exam-
ple, (Heinrich, Matthias, 2007) performed a study us-
ing twelve household datastreams, of which two had
some missing data points because of various meter
failure issues and were removed from further analysis.
Similarly, Fielding et al. recognized the adverse effect
of excessive missing data on the results and removed
17% of the streams, which had insufficient valid data.
Makki et al. encountered the problem of missing data
while using smart water data and removed the affected
household measurements (Makki, A.A. and Stewart,
R.A. and Panuwatwanich, K. and Beal, C., 2013). De-
spite the reported problems, neither the nature of er-
rors is discussed nor any solutions to remove them is
provided in all cases above. Fielding et al. have only
suggested using more accurate hardware to improve
future data (Fielding et al., 2013). The advantage of
using the above approach is its simplicity, and it can
merely be used for instances where a negligible per-
centage of data is affected by errors. In these cases,
the omission of erroneous data would not cause the
ICAART 2022 - 14th International Conference on Agents and Artificial Intelligence
438

loss of valuable information.
The third approach is to approximate the missing
or corrupted data based on the readings in the tempo-
ral proximity of that specific point. The replacement
candidate is calculated using either a predefined de-
fault value or an average over the previously valid data
points or replacing the value from a similar location
of another datastream (Machell, J. and Mounce, SR.
and Boxall, JB., 2010; Umapathi et al., 2013). An-
other approach that has gained popularity during the
past decade is crowdsourcing of the cleaning process.
Traditionally, the cleaning process was performed by
domain and database experts. If the errors are sim-
ple errors such as typos or optical character recog-
nizer (OCR) issues, an untrained operator is capable
of checking the records for error (Chen et al., 2013).
However, if the data requires expert knowledge or it
would not be possible to share it with a third party,
this method is not possible.
The data quality issues in smart grids exist in the
electricity supply systems. They have gained more
in-depth analysis because of the effect that electri-
cal energy cannot be easily stored. Therefore, the
electricity industry has always been more forthcom-
ing in investment for research and implementation of
smart meters (Alquthami et al., 2019). The major-
ity of the efforts in Smart Electrical Energy Gener-
ation and Transmission Systems are done by the in-
dustries involved in this field. For example, Albert et
al., Shishido, and Quilumba et al. mention concerns
about errors occurring in the measurement data that
affect data quality that is quite similar to the current
study (such as missing data, reading errors, lack of
demographic survey data, zero readings, spikes and
duplicate readings) and provide preliminary analysis
for them ((Shishido, Juan, 2012) and (Quilumba,
F.L. and Wei-Jen Lee and Heng Huang and Wang,
D.Y. and Szabados, R., 2014)). In both Shishido and
Quilumba et al., these errors can propagate results and
deteriorate them. Moreover, Quilumba et al. present
more details of the errors’ nature and discuss an appli-
cation of consumer profile classification by k-means
clustering with the semi-cleaned data as training and
test inputs.
3 PROGRESSIVE DATA
CLEANING
Essentially, the goals of a smart infrastructure are to
analyze various states of the system, make it more
optimized in many aspects, and have a bi-directional
communication channel with the meter. As com-
promised data quality would directly affect analy-
sis results, the main concern is finding out how data
quality issues could impact them and how to avoid
them. Jia et al. have studied the results of bad data
on smart electrical energy generation and transmis-
sion systems and demonstrated how it would affect
decision-making results. They hypothesize that the
error in data comes in the nature of noise or misread-
ing of the actual measurement values. In addition,
a metric is defined to quantify the effect of bad data
on real-time price, which is called Average Relative
Price Perturbation. The authors have concluded that
errors in topographical data are more detrimental for
the pricing schemes than the measurement data (Jia,
L. and Kim, J. and Thomas, R.J. and Tong, L., 2014).
3.1 Filter-based Progressive Data
Inspection
Depending on the nature of data being processed and
previous experiences dealing with such systems, the
types and extent of errors in the dataset could be dif-
ferent. The current approach is an experimental error
detection technique that ensures that most of the de-
tectable errors by the applied filters are found. The
procedure consists of applying the filter to the most
updated date state and evaluating the results to ensure
its quality. If the data quality does not meet the re-
quirements, additional iterations might be required to
achieve the minimum required accuracy.
3.2 Pre-mining Issues
In general, smart meter data is acquired in two ways:
modifying existing infrastructure with equipment to
gather data or collaborating with an already imple-
mented metering infrastructure to use their data. The
former has the advantage of monitoring data acqui-
sition thoroughly, and data integrity can be validated
on each step. However, surveillance coverage is lim-
ited to the budget and customers’ willingness to par-
ticipate in the study. In contrast, the latter approach
mostly provides access to the entire infrastructure,
while the authorities in charge allow this access and
a great opportunity for the large-scale study of the as-
pects of the big data in the smart grid. Two main is-
sues encountered while dealing with large-scale smart
water meter data will be introduced and analyzed in
detail in the next two parts.
3.2.1 Primary Composite Key
As a part of the importing smart meter data, each me-
ter is required to be identified uniquely across all ta-
bles; therefore, as the original primary key was not
Water Consumption Demand Pattern Analysis using Uncertain Smart Water Meter Data
439

provided, a JOIN operation was required. Ideally, the
join should be performed on a single primary key or a
composite one constructed by combining more fields.
In theory, the main key used by the server, Blocks D,
E, and F in Figure 1, would unify all datasets. How-
ever, personal information can be disclosed, which is
a breach of customer information confidentiality, and
this primary key was not provided; one possible solu-
tion is to redefine the primary composite key.
Three individual fields shared among imported
datasets and were the most probable candidates for re-
constructing the primary key are Account ID, Meter
ID, and Recording Device ID. The join process was
changed to accept the strings with partial matches as
well as the complete ones.
3.3 Filter: Peak Definition and Peak
Contributors
“Peak Consumption” is a valuable character of WSS
that provides means to examine the network’s capa-
bility to handle the volume of water at any period of
peak consumption. Additionally, the system should
be designed for long-term peak consumption of the
entire network for water planning purposes. To find
the actual peak contributors, the highest consumption
over a period should be identified after finding the
temporal location of the peak period, a top-k query
analysis to identify the main contributors. After peak
consumers are narrowed down, their raw consumption
profiles are inspected to verify the validity of peaking
behaviour. Essentially, the errors in these records can
cause inaccurate calculation and, consequently, incor-
rect decision-making, which will be discussed in the
remainder of the paper.
After importing data in a correct format, it is re-
quired to adopt a filter with predictable outputs to
evaluate data quality. The peak contribution analysis
is important as it enables us to find the profiles that are
the worst candidates for being affected by errors and
are the focus of the current study. The peak contri-
bution filter is a starting point for more complex data
quality analyzes. Because of the inherent characteris-
tics of water supply systems, instantaneous peak con-
sumption does not have a significant practical value.
Thus, in the context of such large-scale systems, the
peak value is described as the maximum average con-
sumption of a consumer (or group of consumers), dur-
ing a specific time range R (in hours or days), for a
predefined constant window size (W in hours or days).
The peak averaging window (W ) can take values of a
few hours to a few weeks, depending on the natural
lag and physical size of the water transmission net-
work in question.
3.4 Evaluation Tool: Ranked List
Definition and Comparison
A ranking metric to evaluate their correlation requires
two lists of peak demand contributors calculated from
both clean and dirty data. The evaluation would quan-
tify the effect of each meter error on data quality
by comparing the corresponding ranked lists. The
ranking algorithm proposed by Kendal et al. is ex-
tensively used to compare an erroneous permuted or
partially permuted list with a given (correct) refer-
ence (Van Doorn et al., 2018). A variant of the al-
gorithm that permits weights for each rank is used in
the current paper that is proposed by (D’Alberto and
Dasdan, 2010).
4 EXPERIMENTAL RESULTS
AND SENSITIVITY ANALYSIS
This section analyzes the city’s smart meter data to
determine peak contributors and how their order and
ranking would respond to different errors.
4.1 Peak Contribution Results
It was reported that the highest peak consumption
record occurred on July 24, 2013. To find those con-
sumers who most contributed to this peak date, a peak
length is required to accommodate the natural lag in
water supply networks. Therefore, two peak win-
dow periods are selected for the current study: 24-
hours and one week (168 hours), as representatives
of short and medium-term consumption peaks. Ad-
ditionally, results are generated using clean and dirty
datasets to emphasize the effect of noise and data er-
rors. Dirty data contains errors described previously;
while, clean data is generated by removing the errors,
performed semi-automatically under expert supervi-
sion.
Table 1 compares the results of calculating peak
windows of length 24 and 168 hours and shows that
the peak event (in 24-hours) occurred on July 16,
2013, at 3:00 pm. However, at midnight, the respec-
tive peak event for the dirty original dataset started on
Feb 19, 2013. The detected time does not match the
correct peak, which exactly overlaps with the value
reported by the city, and no justifiable reason exists
for a peak occurring in winter. Similarly, consider-
able inconsistency is observable in the weekly peak
caused by enlargement and deformation of records by
associating high consumption to a small set of cus-
tomers.
ICAART 2022 - 14th International Conference on Agents and Artificial Intelligence
440
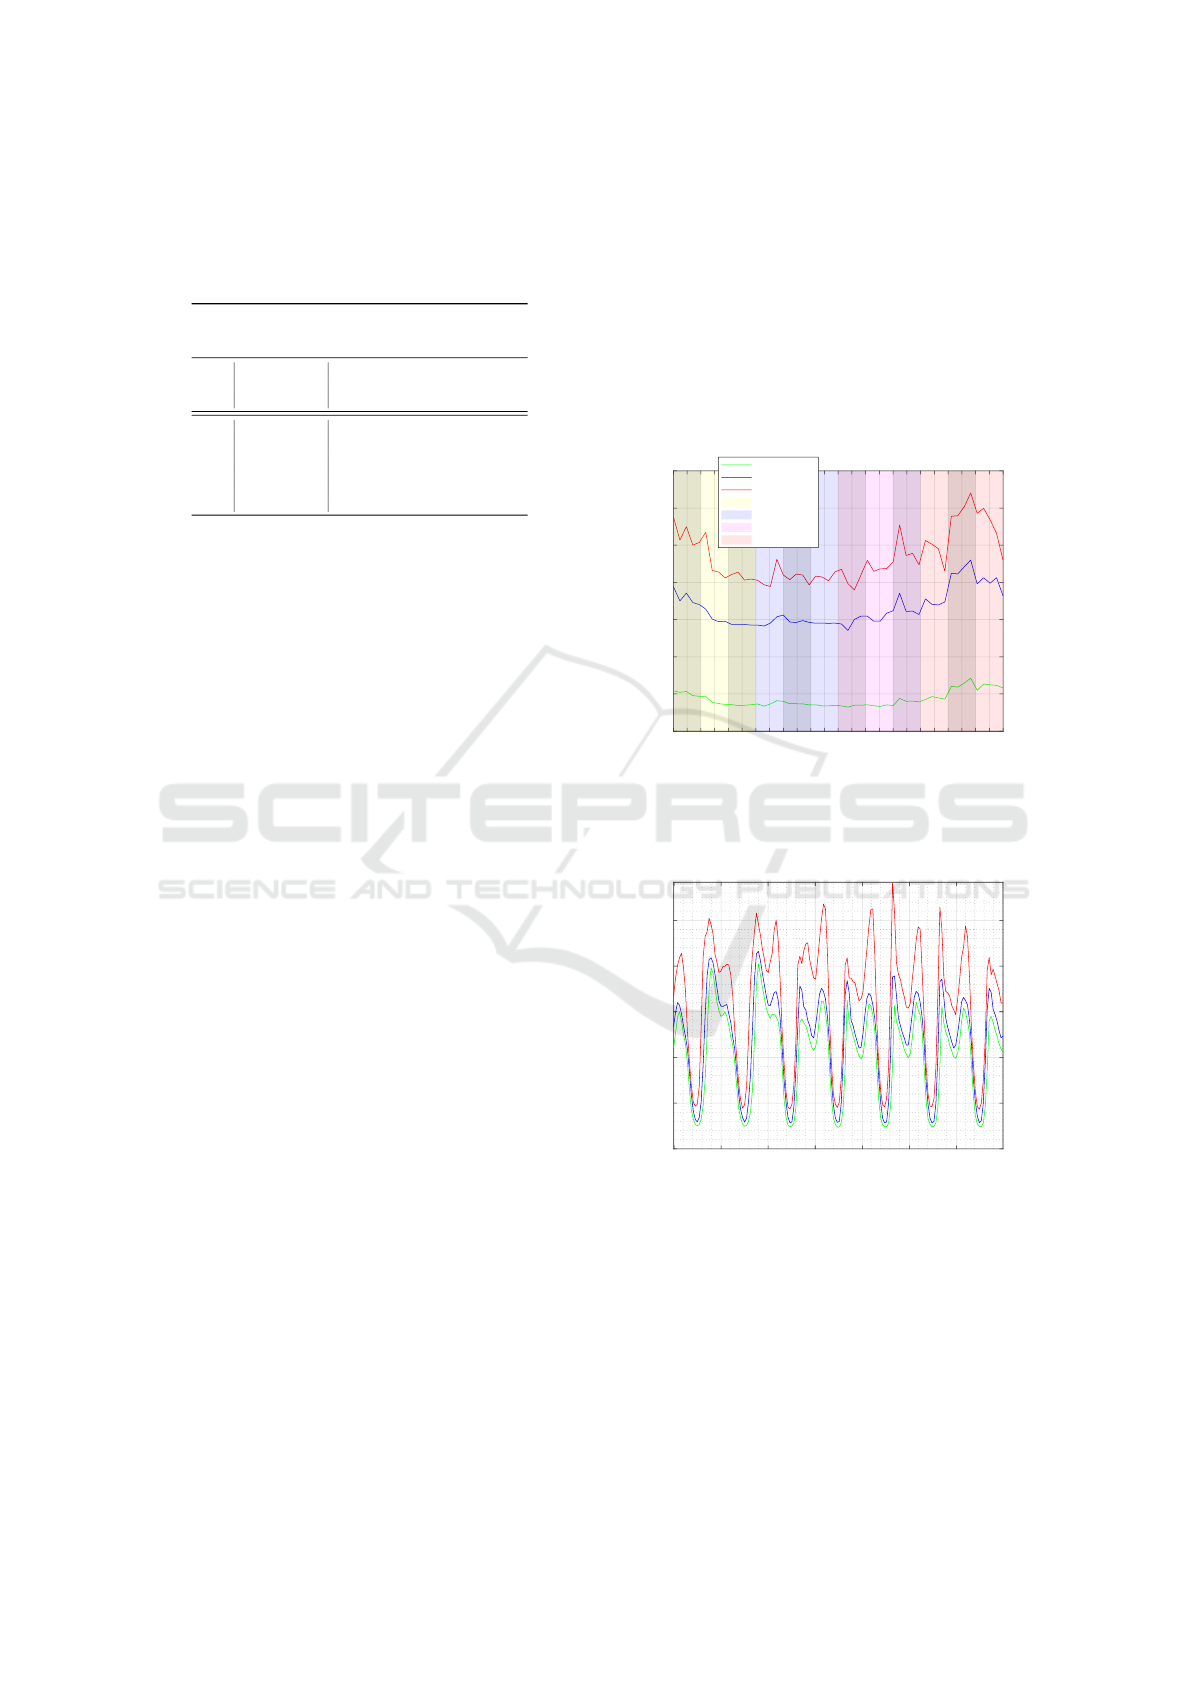
Table 1: Comparison of the top six peak contributors of
data for the peak window lengths of 168 hours. Categories
(CAT) are abbreviated as: Agricultural (AGR), Commercial
(COM), Industrial (IND), Institutional (INS), Multi-Family
Residences (MFR), and Single-Family Residence (SFR).
Clean Data (7 Day Peak) Dirty Data (7 Day Peak)
Start: Jul 19,2013,7:00pm Start: Feb 18,2013,4:00pm
End: Jul 26,2013,7:00pm End: Feb 25,2013,4:00pm
Rank
Clean Cons. Dirty Cons. Rank in Real
Data in Data in Clean Cons.
Cat. [m
3
] Cat. [m
3
] Data [m
3
]
1st IND 8,367.0 SFR 511,531.0 2832 5
2nd IND 7,539.0 COM 20,000.0 1170 20
3rd IND 4,569.1 MFR 17,000.0 1105 22
4th COM 4,480.0 IND 11,738.0 1 8367
5th AGR 4,373.7 MFR 9,748.0 497 96.24
6th IND 4,030.0 MFR 8,500.0 441 110
The table also provides the top ten consumers and
categories and the correct ranking of dirty data candi-
dates. Only two consumers in the clean top ten are de-
tected correctly in dirty data but with the wrong order,
and the remaining are not valid. Another unexpected
observation is that the first peak contributor in dirty
data for 24-hour window size, Table 1, has real con-
sumption of zero. It can be explained by the fact that
the peak period of dirty data is in a different season,
which explains that the consumer has high consump-
tion in one season and none in another one.
In comparison with current results, the reported
highest consumption day (Jul 24, 2013) falls exactly
into the range of the results of the seven-day peak con-
tribution, which confirms the cleaned dataset results.
4.2 The Single-family Residence
Consumption Profile
An important contribution of this work, which was
initially asked by the city providing the data, was to
predict the consumption patterns of different types
of customers. An accurately calculated consump-
tion profile can provide valuable information on how
the demand is distributed and correctly predict future
consumption values. A major hurdle in calculating
the demand pattern of water consumption is the het-
erogeneity of the consumers in a water distribution
system (Avni et al., 2015). The existence of the con-
sumption profile of a city that the validity and in-
tegrity of the data are established can shed light on
different aspects of this problem. Of the 25,000 ac-
tive consumers of the city, 85% or roughly 21,000
of them were single-family residences (SFRES), and
the hourly consumption data of such volume of con-
sumers can provide a highly reliable weekly con-
sumption pattern. The results of calculating the av-
erage consumption profile of the SFRES are shown
in Figures 3, and 2. Figure 2 shows the daily con-
sumption average changes during a year. The sea-
sonal effect is visible in the average profile. Like
the previous analysis of peak contributors, this anal-
ysis led to the finding and removal of different errors
in the datastreams (from Meter Unit inconsistencies
to spikes and missing data). Additionally, Figure 3
shows the hourly consumption profile average over
all single-family households. To better visualize the
changes in consumption during different weeks of the
year, the profiles are shown in three percentiles of 10,
50 and 90.
Sep Oct Nov Dec Jan Feb Mar Apr May Jun Jul Aug
Month
0
200
400
600
800
1000
1200
1400
Average Weekly Consumption per Customer [Litres/Day]
10th Percentile
50th Percentile
90th Percentile
Fall
Winter
Spring
Summer
Figure 2: Annual changes of average daily consumption
percentiles of the city (per customer), using hourly con-
sumption profiles of 21,000 streams of smart meter read-
ings.
Sat Sun Mon Tue Wed Thu Fri
Day of Week
0
10
20
30
40
50
Consumption [Litres/Hr]
Figure 3: Average weekly consumption percentiles of the
city (per customer), using hourly consumption profiles of
21,000 streams of smart meter readings (Green 10, Blue 50,
Red 90 Percentiles.
5 CONCLUSIONS AND FUTURE
WORK
To perform valuable data analysis tasks on smart me-
ter data, measurement data needs to be error-free as
Water Consumption Demand Pattern Analysis using Uncertain Smart Water Meter Data
441

an essential part of the process. Studies have found
that in a majority of the cases, data is not in the de-
sired condition, and measurements mixed with vari-
ous kinds of errors are generated by the meters.
This paper was focused on the progressive clean-
ing of data while analyzing the impact of data errors
on the performance of a specific filter, namely, peak
consumer identification and SFRES consumption pro-
files. During the progressive cleaning process, vari-
ous sources of errors, such as mistakes made by op-
erators, hardware failures, and context-dependent er-
rors, were identified. In addition, systematic ways
of removing the main contributing errors (meter unit
inconsistencies, the meter resets, spikes, duplicated
records, and duplicated datastreams) were provided
and more complex errors were characterized, as well.
The results of cleaning data and application of
the filter (performing peak detection tasks) were pre-
sented, and the cleaning process’s significance was
demonstrated. Also, the sensitivity of the outputs to
the errors in the data and the parameters of the peak
detection filter was examined.
To conclude, data cleaning is an essential part of
big data application in smart meter measurement anal-
ysis. However, prior knowledge of the state of data
quality and the sensitivity of the results to different
types of error is required. Smart meter data analysis
is still in its early stages and can benefit considerably
from further research. Some possible extensions of
the work were presented in this paper. The data qual-
ity should be evaluated using other physical charac-
teristics of the water supply infrastructure, assuming
feasibility of acquiring them, such as pressure infor-
mation of various key nodes, mass balancing of the
consumption and production, using bulk meter data of
the network. Many possible errors in the datastreams
have been detected in this work; however, other filters
can detect other potential errors. Examples of such
filters can be: “does the hourly consumption profile
of different customer categories follow the expected
minimum and maximum load?”
The other extension is to examine the effect of
quantized meters on data quality and devise clean-
ing methods that can deal with such error types more
effectively. In addition, missing data points, an in-
evitable aspect of every smart system, were analyzed,
compensating their effects. As a future project, sim-
ilar to the procedure performed for errors in this pa-
per, missing data can be characterized more system-
atically.
REFERENCES
Aijun, A., Ning, S., Chan, C., Cercone, N., and Ziarko, W.
(1996). Discovering rules for water demand predic-
tion: An enhanced rough-set approach. Engineering
Applications of Artificial Intelligence, 9:645–653.
Alquthami, T., Alsubaie, A., and Anwer, M. (2019). Impor-
tance of smart meters data processing – case of saudi
arabia. In 2019 International Conference on Elec-
trical and Computing Technologies and Applications
(ICECTA), pages 1–5.
Arregui, Francisco and Cabrera, E and Cobacho, Ricardo
and Garc
´
ıa-Serra, Jorge (2005). Key factors affecting
water meter accuracy. In Leakage 2005, pages 1–10,
Portugal. Leakage 2005.
Avni, N., Fishbain, B., and Shamir, U. (2015). Water con-
sumption patterns as a basis for water demand model-
ing. Water Resources Research, 51(10):8165–8181.
Beal, C., Stewart, R. A., Huang, T., and Rey, E. (2011).
SEQ residential end use study. Australian Water As-
sociation, 38(1):80–84.
Beal, Cara and Stewart, Rodney A. and Huang, T. and Rey,
E. (2011). South East Queensland residential end use
study: Final Report. Journal of the Australian Water
Association, 38(1):80–84.
Chen, J., Chen, Y., Du, X., Li, C., Lu, J., Zhao, S., and
Zhou, X. (2013). Big data challenge: a data man-
agement perspective. Frontiers of computer Science,
7(2):157–164.
Courtney, M. (2014). How utilities are profiting from Big
Data analytics. Engineering and Technology Maga-
zine.
D’Alberto, P. and Dasdan, A. (2010). On the Weakenesses
of Correlation Measures used for Search Engines’ Re-
sults. Cornell University Library. Access on: 2014-
12-15.
Farhangi, H. (2010). The path of the smart grid. IEEE
power and energy magazine, 8(1).
Fielding, K. S., Spinks, A., Russell, S., McCrea, R., Stew-
art, R. A., and Gardner, J. (2013). An experimental
test of voluntary strategies to promote urban water de-
mand management. Journal of Environmental Man-
agement, 114(0):343–351.
Heinrich, Matthias (2007). Water End Use and Efficiency
Project (WEEP): Final Report. Technical report,
BRANZ Ltd., Judgeford, New Zealand. BRANZ
Study Report 159.
Hsia, S.C. and Hsu, S.W. and Chang, Y.J. (2012). Remote
monitoring and smart sensing for water meter system
and leakage detection. IET Wireless sensor systems,
2(4):402–408.
Jia, L. and Kim, J. and Thomas, R.J. and Tong, L.
(2014). Impact of data quality on real-time locational
marginal price. IEEE Transactions on Power Systems,
29(2):627–636.
Kaisler, Stephen and Armour, Frank and Espinosa, J Al-
berto and Money, William (2013). Big data: Issues
and challenges moving forward. In System Sciences
(HICSS), 46th International Conference on, pages
995–1004, Hawaii. IEEE.
ICAART 2022 - 14th International Conference on Agents and Artificial Intelligence
442

Khalifa, T. and Naik, K. and Nayak, A. (2011). A survey of
communication protocols for automatic meter reading
applications. IEEE Communications Surveys & Tuto-
rials, 13(2):168–182.
Leeds, D. (2009). The smart grid in 2010: market seg-
ments, applications and industry players. Gtm Re-
search, pages 1–145.
Liu, F., He, Q., Hu, S., Wang, L., and Jia, Z. (2018). Es-
timation of smart meters errors using meter reading
data. In 2018 Conference on Precision Electromag-
netic Measurements (CPEM 2018), pages 1–2.
Lon House (2011). Time of Use Water Meter Impacts on
Customer Water Use. Technical report, California En-
ergy Commission.
Machell, J. and Mounce, SR. and Boxall, JB. (2010). On-
line modelling of water distribution systems: a uk
case study. Drinking Water Engineering and Science,
3:21–27.
Makki, A.A. and Stewart, R.A. and Panuwatwanich, K.
and Beal, C. (2013). Revealing the determinants of
shower water end use consumption: enabling better
targeted urban water conservation strategies. Journal
of Cleaner Production, 60:129–146.
Mukheibir, P., Stewart, R. A., Giurco, D., and O’Halloran,
K. (2012). Understanding non-registration in domes-
tic water meters: Implications for meter replacement
strategies. Australian Water Association.
Quilumba, F.L. and Wei-Jen Lee and Heng Huang and
Wang, D.Y. and Szabados, R. (2014). An overview of
AMI data preprocessing to enhance the performance
of load forecasting. In Industry Applications Soci-
ety Annual Meeting, pages 1–7, Vancouver, Canada.
IEEE.
Shishido, Juan (2012). Smart meter data quality insights.
ACEEE Summer Study on Energy Efficiency in Build-
ings, 12:277–288.
Sivarajah, U., Kamal, M., Irani, Z., and Weerakkody, V.
(2017). Critical analysis of big data challenges and
analytical methods. Journal of Business Research,
70:263–286.
Stewart, Rodney A and Willis, Rachelle and Giurco,
Damien and Panuwatwanich, Kriengsak and Capati,
Guillermo (2010). Web-based knowledge manage-
ment system: linking smart metering to the future of
urban water planning. Australian Planner, 47(2):66–
74.
Umapathi, S., Chong, M. N., and Sharma, A. K. (2013).
Evaluation of plumbed rainwater tanks in households
for sustainable water resource management: a real-
time monitoring study. Journal of Cleaner Produc-
tion, 42(0):204–214.
Van Doorn, J., Ly, A., Marsman, M., and Wagenmakers,
E.-J. (2018). Bayesian inference for kendall’s rank
correlation coefficient. The American Statistician,
72(4):303–308.
Zhang, G., Wang, G. G., Farhangi, H., and Palizban, A.
(2017). Data mining of smart meters for load cate-
gory based disaggregation of residential power con-
sumption. Sustainable Energy, Grids and Networks,
10:92–103.
Water Consumption Demand Pattern Analysis using Uncertain Smart Water Meter Data
443
