
Evaluation of Long-term Deep Visual Place Recognition
Farid Alijani
1 a
, Jukka Peltom
¨
aki
1 b
, Jussi Puura
2
, Heikki Huttunen
3 c
,
Joni-Kristian K
¨
am
¨
ar
¨
ainen
1 d
and Esa Rahtu
1 e
1
Tampere University, Finland
2
Sandvik Mining and Construction Ltd, Finland
3
Visy Oy, Finland
Keywords:
Tracking and Visual Navigation, Content-Based Indexing, Search, and Retrieval, Deep Convolutional Neural
Network, Deep Learning for Visual Understanding.
Abstract:
In this paper, we provide a comprehensive study on evaluating two state-of-the-art deep metric learning meth-
ods for visual place recognition. Visual place recognition is an essential component in the visual localization
and the vision-based navigation where it provides an initial coarse location. It is used in variety of autonomous
navigation technologies, including autonomous vehicles, drones and computer vision systems. We study recent
visual place recognition and image retrieval methods and utilize them to conduct extensive and comprehensive
experiments on two diverse and large long-term indoor and outdoor robot navigation datasets, e.g., COLD
and Oxford Radar RobotCar along with ablation studies on the crucial parameters of the deep architectures.
Our comprehensive results indicate that the methods can achieve 5 m of outdoor and 50 cm of indoor place
recognition accuracy with high recall rate of 80 %.
1 INTRODUCTION
The question of “where this photo was taken?” has
been a widespread research interest in multiple fields,
including computer vision and robotics for many
years (Zhang et al., 2020). Recently, researchers
have employed advanced deep learning techniques to
address this question (Masone and Caputo, 2021).
The performance of a good navigation algorithm is
deeply incorporated with an accurate robot localiza-
tion which makes it an important research topic in
robotics.
Visual place recognition is the problem of recog-
nizing a previously visited place using the visual con-
tent and information. Similar to the image retrieval
problem, the visual content can be matched with the
places already stored in the gallery database. It is
the first step in hierarchical visual localization (Sarlin
et al., 2019; Xu et al., 2002) that consists of two steps:
(1) coarse localization and (2) pose refinement.
a
https://orcid.org/0000-0003-3928-7291
b
https://orcid.org/0000-0002-9779-6804
c
https://orcid.org/0000-0002-6571-0797
d
https://orcid.org/0000-0002-5801-4371
e
https://orcid.org/0000-0001-8767-0864
Visual localization itself is a core component of
vision-based mobile robot navigation (DeSouza and
Kak, 2002; Bonin-Font et al., 2008). Our paper
presents and study an extensive evaluation of two
state-of-the-art deep learning methods for long-term
visual place recognition in indoor and outdoor envi-
ronments.
Two recent papers (Sattler et al., 2020; Pion et al.,
2020) demonstrate the superior localization perfor-
mance of approaches that are solely rely on deep met-
ric learning methods, compared with the conventional
engineered features or feature transforms. They mea-
sure the refined 6-Degree-of-Freedom localization ac-
curacy in 3D, but do not factorize the contributions of
(1) coarse localization and (2) pose refinement.
In this paper, we focus mainly on the coarse lo-
calization step for our contribution. In particular,
we define the coarse localization as place recogni-
tion problem and study the performance and settings
of two state-of-the-art deep metric learning architec-
tures with two diverse and large long-term indoor and
outdoor robot navigation datasets. We utilized one
of the best performing CNN architectures in deep vi-
sual place recognition, e.g., NetVLAD (Arandjelovi
´
c
et al., 2018), and another in deep image retrieval by
Radenovi
´
c et al. (Radenovi
´
c et al., 2019).
Alijani, F., Peltomäki, J., Puura, J., Huttunen, H., Kämäräinen, J. and Rahtu, E.
Evaluation of Long-term Deep Visual Place Recognition.
DOI: 10.5220/0010834700003124
In Proceedings of the 17th International Joint Conference on Computer Vision, Imaging and Computer Graphics Theory and Applications (VISIGRAPP 2022) - Volume 5: VISAPP, pages
437-447
ISBN: 978-989-758-555-5; ISSN: 2184-4321
Copyright
c
2022 by SCITEPRESS – Science and Technology Publications, Lda. All rights reserved
437

Both methods utilize the deep metric learning
methods to learn feature embedding and representa-
tion of images where the distance of images captured
in nearby places are clearly smaller than those from
the distant locations. We compare two methods us-
ing two largest available outdoor and indoor datasets:
Oxford Radar RobotCar (Barnes et al., 2020) and
CoSy Localization Database (COLD) (Pronobis and
Caputo, 2009). We also provide an ablation study on
the main performance factors of deep learning meth-
ods, the selection of the backbone network and the
amount of training data.
The rest of this paper is organized as follows.
Section 2 briefly discusses the related work in visual
place recognition. In section 3, we provide the base-
line methods utilized in our paper. Section 4 explains
two real-world indoor and outdoor datasets to address
the visual place recognition problem. In section 5,
we show the experimental results and finally, we con-
clude the paper in section 6.
2 RELATED WORK
Visual Place Recognition Methods. Given a query
image, an image retrieval system aims to retrieve all
images from a large database containing similar fea-
tures to the query image. Visual place recognition can
be also interpreted as an image retrieval system which
recognize a place by matching it with all places from
the reference dataset. Prior research has thoroughly
surveyed visual place recognition methods in recent
papers. Lowry et al. (Lowry et al., 2016) define the
problem and survey the classical hand-crafted or shal-
low learned descriptors. while Zhang et al. (Zhang
et al., 2020) and Masone et al. (Masone and Caputo,
2021) focus entirely on the deep learning approaches
incorporated with visual place recognition.
The conventional methods of place recognition
use mainly handcrafted local features and global de-
scriptors on their core to obtain feature descriptors.
Popular local feature descriptors are SIFT (Lowe,
2004), SURF (Bay et al., 2008) and HOG (Dalal and
Triggs, 2005). Commonly used global descriptors
including DBoW (Galvez-L
´
opez and Tardos, 2012),
FAB-MAP (Cummins and Newman, 2008; Cummins
and Newman, 2011) and the landmark-based relocal-
ization approach (Williams et al., 2011), are all based
on handcrafted local image features and have been
widely used for visual SLAM or localization tasks.
Today, handcrafted features are being constantly
outperformed by deep features that can be trained
to be robust to geometric transformations and illu-
mination changes. The deep architectures often em-
ploy pre-trained backbone networks that extract pow-
erful semantic features. The backbone networks are
trained with image classification datasets such as Im-
ageNet (Russakovsky et al., 2015). By localization
specific fine-tuning the deep features are optimized
for image matching (Zhang et al., 2020; Radenovic
et al., 2018).
The main objective of utilizing deep architec-
tures for image retrieval and visual place recogni-
tion is to learn powerful and meaningful feature map-
ping which allows to compare images using similarity
measures such as Euclidean distance or cosine simi-
larity.
In this context, large number of architectures
have been proposed: MAC (Azizpour et al., 2015),
SPoC (Yandex and Lempitsky, 2015), CroW (Kalan-
tidis et al., 2016), GeM (Radenovi
´
c et al., 2019), R-
MAC (Tolias et al., 2016b), modified R-MAC (Gordo
et al., 2017) and NetVLAD (Arandjelovi
´
c et al.,
2018). For this paper, we selected two methods which
perform well with public benchmarks in which the
original code is publicly available: GeM (Raden-
ovi
´
c et al., 2019) and NetVLAD (Arandjelovi
´
c et al.,
2018).
Visual Place Recognition Datasets. For the past few
years, researchers have collected and published sev-
eral datasets for the problem of visual place recogni-
tion with various sensor modalities, including monoc-
ular and stereo cameras, LiDAR, IMU, radar and
GNSS/INS sensors. For example, Cummins and
Newman (Cummins and Newman, 2008) introduced
the New College and City Centre dataset. The other
popular datasets are the KITTI Odometry bench-
mark (Geiger et al., 2012), Canadian Adverse Driving
Conditions dataset (Pitropov et al., 2021), Ford cam-
pus vision and LiDAR dataset (Pandey et al., 2011),
InLoc dataset (Taira et al., 2021), extended CMU
seasons dataset (Badino et al., 2011; Sattler et al.,
2018), M
´
alaga Urban dataset (Blanco-Claraco et al.,
2014), Alderley dataset (Milford and Wyeth, 2012),
Aachen dataset (Sattler et al., 2012) and Nordland
dataset (Olid et al., 2018).
Our objective is to address both outdoor and in-
door place recognition and focus more specifically on
long-term visual place recognition, i.e., how robust
the deep representations are to changes over time, in-
cluding illumination and weather. Therefore, we se-
lected the two challenging datasets, COLD (Pronobis
and Caputo, 2009) for indoor experiments and Oxford
Radar RobotCar (Barnes et al., 2020) for outdoor ex-
periments, that provide the same places captured in
various different conditions.
VISAPP 2022 - 17th International Conference on Computer Vision Theory and Applications
438

3 METHODS
In this work, we concentrate on deep image repre-
sentation obtained by deep convolutional neural net-
work (CNN) architectures in which given an input
an image, it produces a global descriptor, feature
vector, to describe the visual content of the image.
In the following, we briefly explain the processing
pipelines of the Generalized Mean (GeM) by Rade-
novi
´
c et al. (Radenovi
´
c et al., 2019) that obtains
good performance with image retrieval datasets and
NetVLAD (Arandjelovi
´
c et al., 2018) that performs
well on place recognition datasets.
3.1 Radenovi
´
c et al.
For training, Radenovi
´
c et al. (Radenovi
´
c et al., 2016;
Radenovi
´
c et al., 2019) adopt the Siamese neural net-
work architecture. The Siamese architecture is trained
using positive and negative image pairs and the loss
function enforces large distances between negative
pairs (images from two distant places) and small dis-
tances between positive pairs (images from the same
place). Radenovi
´
c et al. (Radenovi
´
c et al., 2019) use
the contrastive loss (Chopra et al., 2005) that acts
on matching (positive) and non-matching (negative)
pairs and is defined as follows:
L =
(
l(
~
f
a
,
~
f
b
) for matching images
max
0,M −l(
~
f
a
,
~
f
b
)
otherwise
(1)
where l is the pair-wise distance term (Euclidean dis-
tance) and M is the enforced minimum margin be-
tween the negative pairs.
~
f
a
and
~
f
b
denote the deep
feature vectors of images I
a
and I
b
computed using
the convolutional head of a backbone network such
as AlexNet, VGGNet or ResNet.
The typical feature vector lengths K are 256, 512
or 2048, depending on the backbone. Feature vectors
are global descriptors of the input images and pooled
over the spatial dimensions. The feature responses
are computed from K convolutional layers X
k
follow-
ing with max pooling layers that select the maximum
spatial feature response from each layer of MAC vec-
tor as follows:
~
f = [ f
1
f
2
... f
K
], f
k
= max
x∈X
k
(x) . (2)
Radenovi
´
c et al. originally used the MAC vec-
tors (Radenovi
´
c et al., 2016), but in their more re-
cent paper (Radenovi
´
c et al., 2019) compared MAC
vectors to average pooling SPoC vector and General-
ized Mean pooling (GeM) vector and found that GeM
pooling layer provides the best average retrieval accu-
racy.
Radenovi
´
c et al. (Radenovi
´
c et al., 2019) propose
GeM pooling layer to modify the MAC (Azizpour
et al., 2015; Tolias et al., 2016a) and SPoC (Yan-
dex and Lempitsky, 2015). This is a pooling layer
which takes χ as an input and produces a vector
f = [ f
1
, f
2
, f
i
,..., f
K
]
T
as an output of the pooling pro-
cess which results in:
f
i
=
1
|χ
i
|
∑
x∈χ
i
x
p
i
!
1
p
i
(3)
MAC and SPoC pooling methods are special cases
of GeM depending on how pooling parameter p
k
is
derived in which p
i
→ ∞ and p
i
= 1 correspond to
max-pooling and average pooling, respectively. The
GeM feature vector is a single value per feature map
and its dimension varies depending on different net-
works, i.e. K = [256, 512, 2048]. It also adopts a
Siamese architecture to train the networks for image
matching.
The Radenovi
´
c et al. (Radenovi
´
c et al., 2019) main
pipeline is shared by the most deep metric learning
approaches for image retrieval, but the unique com-
ponents are the proposed supervised whitening post-
processing and effective positive and negative sam-
ple mining. More details are described in (Radenovi
´
c
et al., 2016) and (Radenovi
´
c et al., 2018) and avail-
able in the code provided by the original authors.
3.2 NetVLAD
The main advantage of Radenovi
´
c et al. (Radenovi
´
c
et al., 2019) architecture is its straightforward imple-
mentation as it uses standard CNN layers available in
PyTorch and TensorFlow libraries: conv-layers, soft-
max, L
2
-normalization and the final aggregation lay-
ers MAC, SPoC and GeM. NetVLAD architecture,
on the contrary, contains special layer that provides
higher dimensional feature vector.
NetVLAD (Arandjelovi
´
c et al., 2018) implements
a function f as a global feature vector for a given
image I
i
as f (I
i
). This function is used to ex-
tract the feature vectors from the entire database I
i
,
identified as gallery set. Then visual search be-
tween f (q), query image, and f (I
i
) takes place us-
ing Euclidean distance d(q, I
i
) and to obtain the top-
N matches. NetVLAD is inspired by the conventional
VLAD (J
´
egou et al., 2010) which uses handcrafted
SIFT descriptors (Lowe, 2004) and uses VLAD en-
coding to form f (I). NetVLAD is a data optimized
version of VLAD for place recognition or image re-
trieval. NetVLAD is defined by a set of parame-
ters θ and identified as f
θ
(I) in which the Euclidean
distance d
θ
(I
i
,I
j
) = ||f
θ
(I
i
) − f
θ
(I
j
)|| depends on the
same parameters.
Evaluation of Long-term Deep Visual Place Recognition
439

In order to learn the representation end-to-end,
NetVLAD contains two main building blocks. (1)
Cropped CNN at the last convolutional layer, iden-
tified as a dense descriptor with the output size of
H ×W ×D, correspond to set of D-dimensional de-
scriptors extracted at H ×W spatial locations. (2)
Trainable generalized VLAD layer, e.g., NetVLAD
which pools extracted descriptors into a fixed im-
age representation in which its parameters trained via
backpropagation.
The original VLAD image representation V is
D×K matrix in which D is the dimension of the input
local image descriptor~x
i
and K is the number of clus-
ters. It is reshaped into a vector after L
2
-normalization
and ( j, k) element of V is calculated as follows:
V ( j, k) =
N
∑
i=1
a
k
(~x
i
)(x
i
( j) −c
k
( j)), (4)
where x
i
( j) and c
k
( j) are the jth dimensions of the
ith descriptor and kth cluster centers, respectively. It
should be noted that a
k
(~x
i
) = 0 , 1 corresponds to
whether or not the descriptor ~x
i
belongs to kth visual
word. Compared to original VLAD, NetVLAD layer
is differentiable thanks to its soft assignment of de-
scriptors to multiple clusters:
V ( j, k) =
N
∑
i=1
e
w
T
k
x
i
+b
k
∑
k
0
e
w
T
k
0
x
i
+b
k
0
(x
i
( j) −c
k
0
( j)) (5)
where w
k
, b
k
and c
k
are gradient descent optimized
parameters of the k-th cluster.
For our implementation, we obtain 64 clusters
with 512-dimensional VGG16 backbone and 2048-
dimensional ResNet50 backbones. Consequently, the
NetVLAD feature vector dimension becomes 512 ×
64 = 32, 768 and 2048 ×64 = 131, 072, respectively.
Arandjelovi
´
c et al. (Arandjelovi
´
c et al., 2018) used
PCA dimensionality reduction method as a post-
processing stage of the implementation. However,
we utilized the full size of feature vector. Since
NetVLAD layer can be easily plugged into any other
CNN architecture in an end-to-end manner, we in-
vestigate its performance with VGG16 and ResNet50
backbones and report the results in section 5.
Apart from designing a CNN architecture as an
image representation, obtaining enough annotated
training data and designing appropriate loss func-
tion for place recognition task is crucial. Follow-
ing (Arandjelovi
´
c et al., 2018), we adopted a weakly
supervised triplet ranking loss L
θ
for training. The
idea of triplet ranking loss is two folds: (1) to obtain
training dataset of tuples (q,{p
i
q
},{n
j
q
}) in which
for every query image q, there exists set of positives
{p
i
q
} with at least one image matching the query and
negatives {n
j
q
}, (2) to learn an image representation
f
θ
so that d
θ
(q, p
i
q
) < d
θ
(q,n
j
q
),∀j. L
θ
is defined as
a sum of individual losses for all n
q
j
and computed as
follows:
L
θ
=
∑
j
max(
|f
θ
(q) − f
θ
(p
q
i
)|
2
−|f
θ
(q) − f
θ
(n
q
j
)|
2
+ α
,0), (6)
where α is the given margin in meter. If the margin
between the distance to the negative image and to the
best matching positive is violated, the loss is propor-
tional to the amount of violation.
4 DATASETS
For our experiments, we selected two publicly avail-
able and versatile outdoor and indoor datasets. We
assigned three different tests, as query sequences ac-
cording to their difficulty levels: (1) Test 01 with sim-
ilar set of images to the gallery set, but acquired at
different time; (2) Test 02 with moderately changed
conditions (e.g, time of day or illumination) and (3)
Test 03 with different set of images from the gallery
set. In the following, we briefly describe the datasets
and selection process of training, gallery and the three
query sequences. Training data is required to fine-
tune the networks for the indoor and outdoor datasets
by pairing positive and negative matches from train-
ing and gallery sets.
4.1 Oxford Radar RobotCar
The Oxford Radar RobotCar dataset (Barnes et al.,
2020) is a radar extension to the Oxford RobotCar
dataset (Maddern et al., 2017). The dataset pro-
vides optimized ground-truth data using a Navtech
CTS350-X Millimetre-Wave FMCW radar. The data
acquisition was performed in January 2019 over 32
traversals in central Oxford with a total route of
280 km of urban driving.
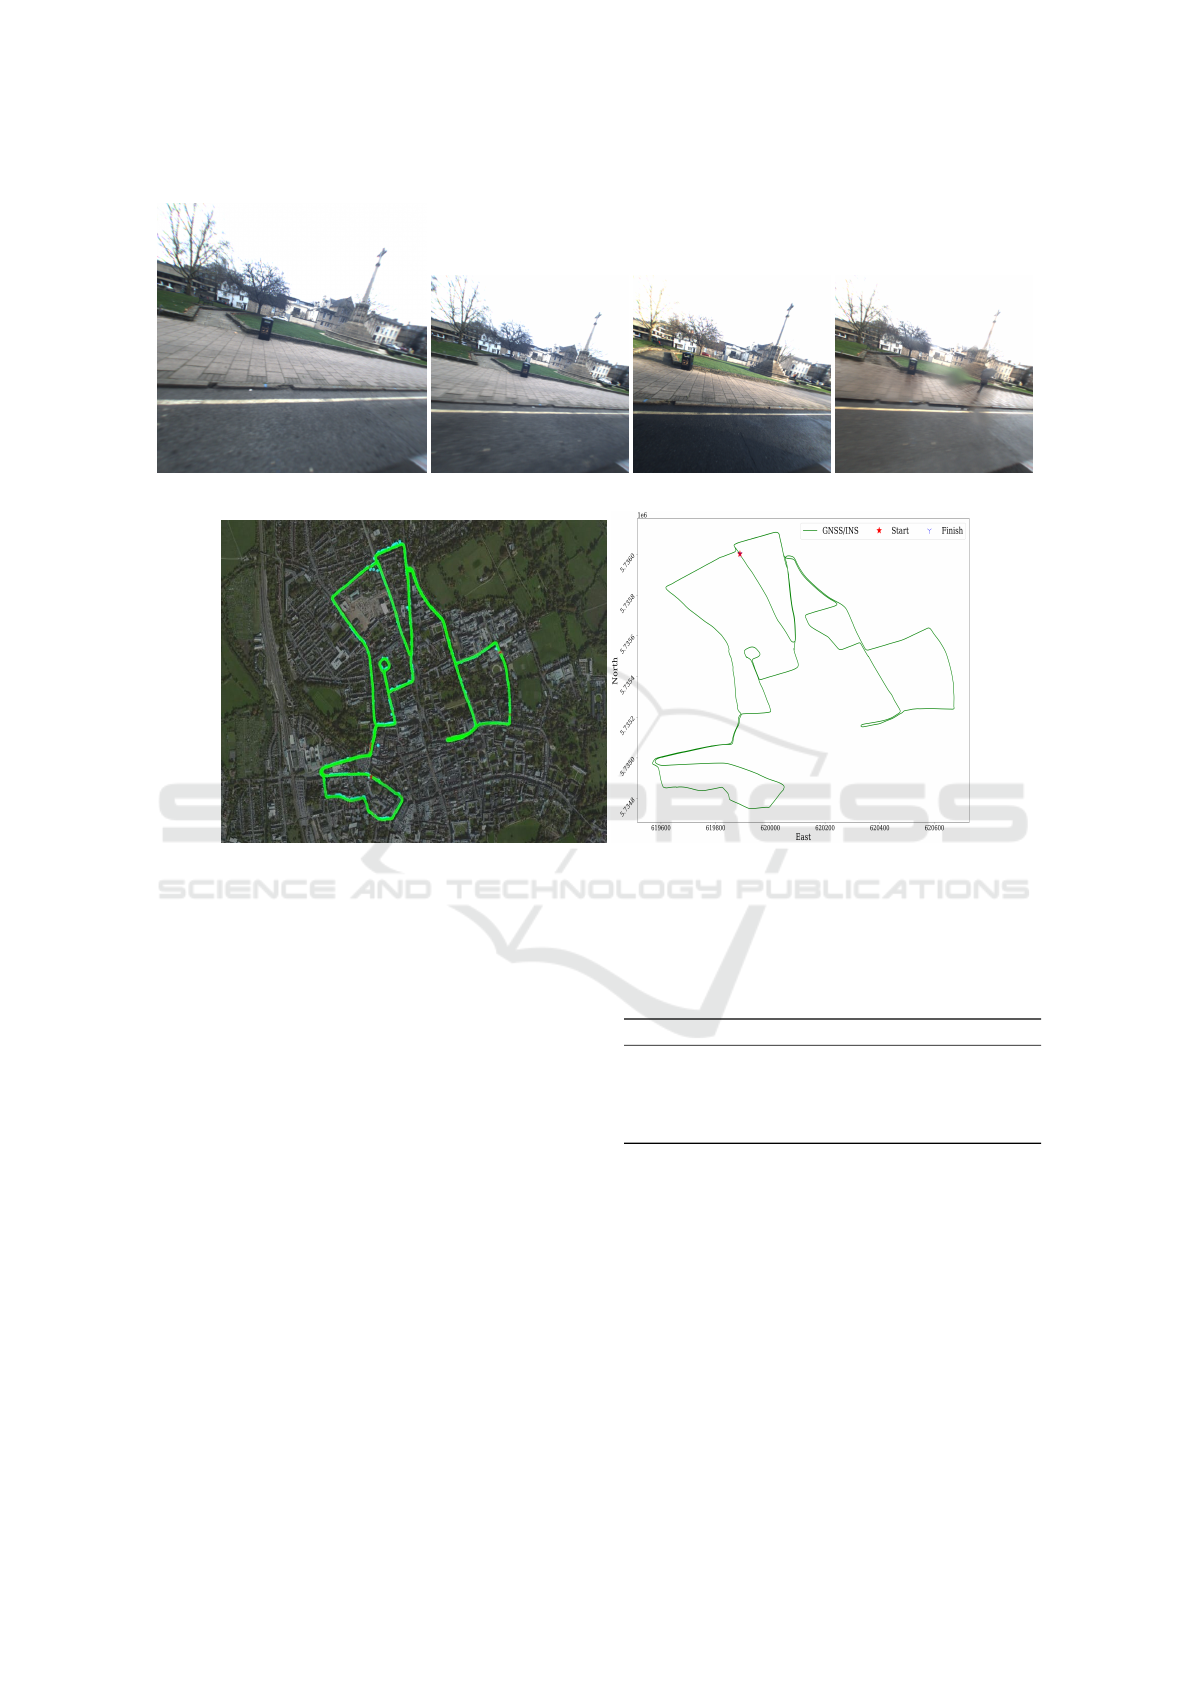
This dataset addresses a wide variety of challeng-
ing conditions including weather, traffic, and light-
ing alterations (Figure 1). The combination of one
Point Grey Bumblebee XB3 trinocular stereo and
three Point Grey Grasshopper2 monocular cameras
provide a 360 degree visual coverage of the scene
around the vehicle platform. The Bumblebee XB3 is
a 3-sensor multi-baseline IEEE-1394b stereo camera
designed for improved flexibility and accuracy. It fea-
tures 1.3 mega-pixel sensors with 66° horizontal FoV
and 1280 ×960 image resolution logged at maximum
frame rate of 16 Hz.
The three monocular Grasshopper2 cameras with
fish-eye lenses mounted on the back roof of the ve-
hicle are synchronized and obtained 1024 ×1024 im-
VISAPP 2022 - 17th International Conference on Computer Vision Theory and Applications
440
(a) (b) (c) (d)
(e) (f)
Figure 1: Examples from the Oxford Radard RobotCar outdoor dataset. Top: Images from the same location in the three
selected test sequences: a) Gallery: cloudy b) Test 01: cloudy c) Test 02: sunny d) Test 03: rainy (Grasshopper2 left monocular
camera). Bottom: 19 km route of the test sequences, e) satellite view f) GNSS/INS.
ages at average frame rate of 11.1 Hz with 180° hori-
zontal FoV. To simplify our experiments, we selected
images from only one of the cameras. We selected
the Point Grey Grasshopper2 monocular camera, e.g.,
left, despite the fact that using multiple cameras could
potentially improve the results. The selected camera
points toward the left side of the road and thus en-
codes the stable urban environment such as the build-
ings, vehicles and traffic lights.
From the dataset, we selected sequences for a
training set, to perform network fine-tuning, a gallery
set against which the query images from the test se-
quence are matched and three distinct test sets: (1) the
same day but different time, (2) the different day but
approximately at same time and (3) the different day
and different time along with different weather con-
ditions. Table 1 summarizes different sets used for
training, gallery and testing sequences.
Table 1: The Oxford Radar RobotCar outdoor sequences
used in our experiments.
Sequence Size Date Start [GMT] Condition
Train 37,724 Jan. 10 2019 11:46 Sunny
Gallery 36,660 Jan. 10 2019 12:32 Cloudy
Test 01 29,406 Jan. 10 2019 14:50 Cloudy
Test 02 32,625 Jan. 11 2019 12:26 Sunny
Test 03 28,633 Jan. 16 2019 14:15 Rainy
4.2 COLD
The CoSy Localization Database (COLD) (Prono-
bis and Caputo, 2009) comprises annotated data se-
quences, acquired using visual and laser range sen-
sors on a mobile platform. The dataset provides a
large-scale, flexible testing environment for evaluat-
ing mainly vision-based topological localization and
semantic knowledge extraction methods aiming to
work on mobile robots in realistic indoor scenarios.
It consists of several video sequences collected
in three different indoor laboratory environments lo-
Evaluation of Long-term Deep Visual Place Recognition
441

cated in three different European cities: the Visual
Cognitive Systems Laboratory at the University of
Ljubljana, Slovenia; the Autonomous Intelligent Sys-
tems Laboratory at the University of Freiburg, Ger-
many; and the Language Technology Laboratory at
the German Research Center for Artificial Intelli-
gence in Saarbr
¨
ucken, Germany.
The COLD data acquisition was performed using
three different mobile robotic platforms (an Activ-
Media People Bot, an ActiveMedia Pioneer-3 and an
iRobot ATRV-Mini) with two Videre Design MDCS2
digital cameras to obtain perspective and omnidirec-
tional views. Each frame is registered with the as-
sociated absolute position recovered using laser and
odometry data and annotated with a label represent-
ing the corresponding place.
The data was collected over a path when visit-
ing several rooms and office environments and under
different illumination conditions, including cloudy,
night and sunny.
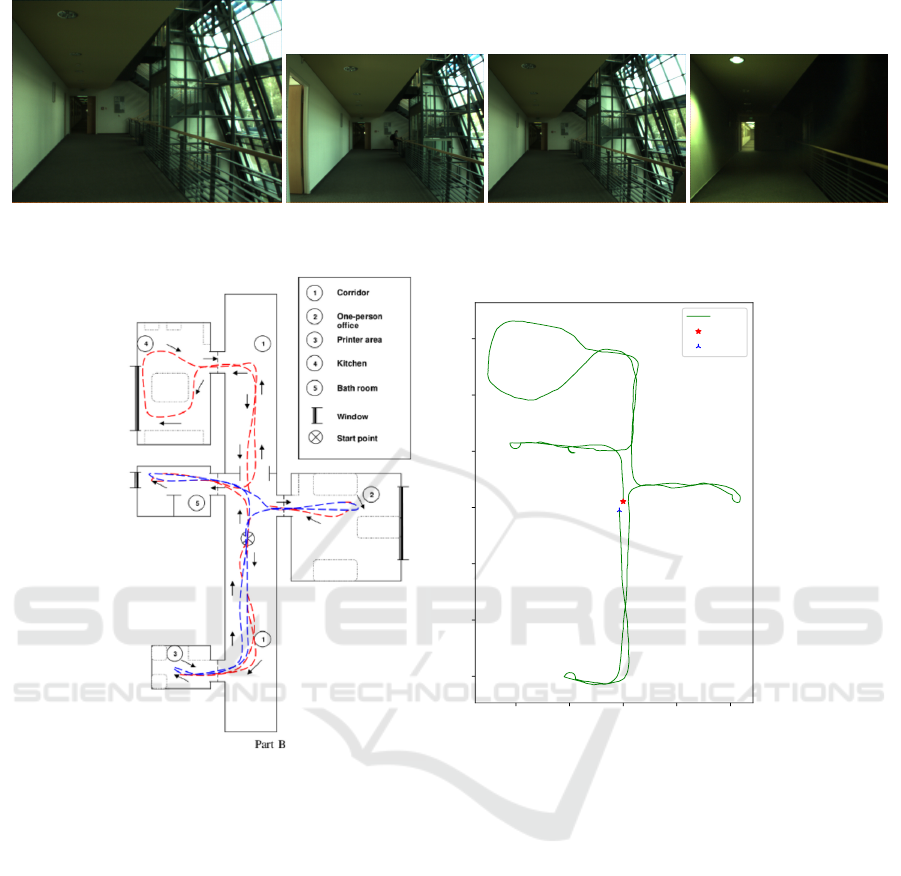
For our experiments, we selected the extended,
e.g., long path on Map B of Saarbr
¨
ucken labora-
tory. The training sequence is Sunny-seq3, gallery se-
quence is Cloudy-seq1, and the three test sequences
are (1) Sunny-seq1, (2) Cloudy-seq2 and (3) Night-
seq3. See Figure 2 for examples. We used the cap-
tured images acquired using the monocular center
camera form this setup. Table 1 summarizes differ-
ent sequences used for training, gallery and testing.
Table 2: The COLD indoor sequences used in our experi-
ments.
Sequence Size Date Start [GMT] Condition
Train 1036 July 7 2006 14:59 Sunny
Gallery 1371 July 7 2006 17:05 Cloudy
Test 01 1104 July 7 2006 14:28 Sunny
Test 02 1021 July 7 2006 18:59 Cloudy
Test 03 970 July 7 2006 20:34 Night
5 EXPERIMENTS
We organize our experiments such that they address
the following research questions: (1) how accurate lo-
calization can be achieved using image retrieval meth-
ods? (2) which of the two selected deep metric learn-
ing methods performs the best (NetVlad or Raden-
ovi
´
c et al. in Section 3)? and (3) how much data
specific training data is required?
Performance Metric. Similar to (Arandjelovi
´
c et al.,
2018), we measure the place recognition performance
by the fraction of correctly matched queries. Fol-
lowing (Chen et al., 2011), we denote the fraction of
top-N shortlisted correctly recognized candidates as
recall@N. Given the available ground-truth annota-
tions and thresholds for indoor and outdoor datasets,
recall@N varies accordingly. To evaluate the perfor-
mance of the methods, described in Section 3, we re-
port only the top-1 matches, i.e., recall@1 for multi-
ple thresholds τ.
The methods in Section 3 are used to compute
a feature vector representation for the given query
image f (q). After obtaining the image representa-
tion, a similarity score which indicates how precise
two images belong to the same location is crucial
to measure the performance. In this way, the fea-
ture vector is matched to all gallery image representa-
tions of f (G
i
),i = 1, 2,..., M using Euclidean distance
d
q,G
i
= ||f (q) − f (G
i
)||
2
and the smallest distance is
selected as the top-1 best match. If the best match
position is within the given distance threshold, e.g.,
d
q,G
i
≤ τ, it is identified as true positive. In other
cases, it is identified as false positive. We then for-
mulate the recall as the ratio of true positive to the
total number of the query images.
To demonstrate the generalization of our observa-
tions, we report the results of experiments using two
backbones, e.g., ResNet50 and VGG16. ResNet50
is a deeper architecture which contains more convo-
lutional, pooling and fully connected layers with 50
weight layers, over 25 million parameters and 3.8 bil-
lion FLOPs (He et al., 2016). VGG16 backbone with
16 weight layers contains nearly 138 million param-
eters and 15.3 billion FLOPs (Simonyan and Zisser-
man, 2015).
Indoor Place Recognition. The results are presented
in Table 3. From the results of the indoor experi-
ments, we obtain the following findings: (1) Rade-
novi
´
c et al. method systematically obtains better ac-
curacy than NetVLAD method, (2) the testing perfor-
mance of ResNet50 backbone is slightly better than
VGG16, with a 4 % improvement on average accu-
racy of the recall@1 at Test 01, 2 % at Test 02, and
6.0 % at Test 03. However, Radenovi
´
c et al. with
VGG16 backbone also performs relatively well con-
sidering less computational expenses, and (3) the in-
door precision drops rapidly when the threshold falls
below τ = 50.0 cm.
It simply indicates that the localization accuracy
of ± 50.0 cm can be achieved with 80% recall@1 rate
even in conditions where the query dataset is substan-
tially different from the gallery dataset. This happens,
for instance, in day vs. night samples.
Outdoor Place Recognition. The results are sum-
marized in Table 4. Our findings from the outdoor
experiments of Oxford Radar RobotCar dataset are
similar to those of the indoor COLD database: Rade-
novi
´
c et al. method outperforms NetVLAD method.
VISAPP 2022 - 17th International Conference on Computer Vision Theory and Applications
442
(a) (b) (c) (d)
(e)
−4 −2 0 2 4
Y [m]
−6
−4
−2
0
2
4
6
X [m]
Trajectory
Path
start
end
(f)
Figure 2: Examples of COLD indoor database (Pronobis and Caputo, 2009). Images of same location in different sequences:
a) Gallery: Cloudy-seq1 b) Test 01: Sunny-seq1, c) Test 02: Cloudy-seq2, d) Test 03: Night-seq3, e) Map view of the lab: blue
dashes: standard path consisting of rooms in most typical office environments, red dashes: extended path containing rooms
specific to this environment or its part, arrows: direction of driving the robot and f) Robot path of approximately 50 m.
ResNet50 provides better accuracy than the VGG16
backbone.
The higher recall@1 rates in Test 01, using both
methods, compared to Test 02 and Test 03 is due to
its high similarity to the gallery dataset, e.g., different
time during the same day. However, Radenovi
´
c et al.
method performs relatively better in small threshold,
τ = 2 m, in Test 03 which indicates its robustness
even in extreme conditions, including night and rain.
The testing performance of ResNet50 backbone
achieves a 0.2 % improvement on average accuracy
of the recall@1 at Test 01, 4.6 % at Test 02, and 2.3 %
at Test 03 compared to VGG16 architecture in the cor-
responding tests. This surely comes with higher com-
putation for ResNet50 backbone.
The results of the Table 4 also demonstrate that lo-
calization accuracy of ± 5.0 m can be achieved with
the recall rate of 80% or greater for different illumina-
tion and weather conditions in an urban environment.
This is reasonable due to the more versatile features
of the outdoor environments, compared to the indoor
environments.
The results of both Table 3 and Table 4 demon-
strate that Radenovi
´
c et al. method outperforms the
NetVLAD in both indoor and outdoor datasets. The
main clarification of better performance is the selec-
tion procedure of training image pairs for positives
and negatives samples with queries forming the train-
ing tuples.
Evaluation of Long-term Deep Visual Place Recognition
443
Table 3: Indoor place recognition results for the COLD Saarbr
¨
ucken sequences, given various distance thresholds τ.
COLD recall@1
Method BB τ = 100 cm τ = 75 cm τ = 50 cm τ = 25 cm
Test 01 (sunny)
Radenovi
´
c (Radenovi
´
c et al., 2019) VGG16 93.03 91.49 78.26 43.12
ResNet50 97.19 95.74 82.43 43.39
NetVLAD (Arandjelovi
´
c et al., 2018) VGG16 92.30 89.58 76.36 41.85
ResNet50 91.94 91.76 78.35 44.75
Test 02 (cloudy)
Radenovi
´
c (Radenovi
´
c et al., 2019) VGG16 94.32 92.75 84.62 46.13
ResNet50 95.20 91.67 80.12 46.62
NetVLAD (Arandjelovi
´
c et al., 2018) VGG16 90.70 87.37 78.45 46.33
ResNet50 93.44 89.72 79.63 45.05
Test 03 (night)
Radenovi
´
c (Radenovi
´
c et al., 2019) VGG16 82.99 82.06 75.36 44.64
ResNet50 91.13 88.97 80.72 47.32
NetVLAD (Arandjelovi
´
c et al., 2018) VGG16 81.03 78.66 70.52 45.05
ResNet50 82.06 79.90 71.34 44.43
In NetVLAD method, the image with the lowest
descriptor distance to the query is chosen as posi-
tive pairs. In this naive approach, the network is not
capable of sufficient learning from positive samples
given only the GPS coordinates and camera orienta-
tion is not available. In Radenovi
´
c et al. method, on
the contrary, the positive samples are chosen at ran-
dom from a pool of images with similar camera posi-
tions. This ensures selecting harder matching exam-
ples along with increasing variability of viewpoints.
Negative samples are selected from clusters different
that the cluster of the query images as clusters are
non-overlapping. Non matching images with similar
descriptors are selected as hard negatives.
Amount of Training Data. Finally, in this exper-
iment we investigate to what extent the data spe-
cific fine-tuning can further improve the visual place
recognition performance results. Based on the ob-
tained results of the Table 3 and the Table 4, we assign
the fixed indoor distance threshold to τ = 50 cm and
outdoor threshold to τ = 5 m. We evaluate the most
challenging test sequence, Test 03, for both indoor and
outdoor datasets.
In our experiments, we compared ResNet50 and
VGG16 backbones in terms of training time using
NVIDIA V100 Tensor core GPU with 32 GB of mem-
ory for the outdoor and indoor datasets. Our find-
ings indicated that VGG16 is less computationally
expensive and less prone to overfitting. The fine-
tuning of CNN using ResNet50 backbone took ap-
proximately 9 hours and 45 minutes for the Oxford
Radar RobotCar dataset with ≈ 37k images with size
of 1024 ×1024 pixels and roughly 85 minutes for
COLD dataset with 1036 training images of 640×480
pixels for 50 epochs and mini-batch of 5 images.
However, VGG16 was slightly lighter since it took ap-
proximately 8 hours and 25 minutes for Oxford Radar
RobotCar and 73 minutes for the COLD dataset.
Despite the high similarity of two backbones in
the performance, we utilized VGG16 backbone. Con-
sequently, we repeat the experiment with different
amounts of training data to study how much and
to what extent, the fine-tuning improves the perfor-
mance. The results are presented in Table 5.
Table 5 demonstrates the absolute outperforming
results of Radenovi
´
c et al. method over NetVLAD
with VGG16 backbone in both indoor and outdoor
datasets. The accomplished performance results is
regardless of how much training data is utilized for
fine-tuning with new datasets. Interestingly, there is
a substantial improvement from absolute zero fine-
tuning data to the full training dataset (37k images)
for the outdoor Oxford Radar RootCar dataset. How-
ever, there is not a significant difference for the indoor
COLD dataset. This can partly be due to the fact that
there are not enough training samples in the indoor
dataset (approximately 1000 samples per sequence).
According to Table 5, there is also a significant
improvement of the results (approximately 50 %) for
the outdoor Oxford Radar RobotCar dataset when
Radenovi
´
c et al. method is utilized considering all
the versatile characteristics of an urban environment.
This is similar for the indoor COLD database even
though the results of Radenovi
´
c et al. method indi-
cates approximately 10% of improvement compared
to the outdoor dataset.
VISAPP 2022 - 17th International Conference on Computer Vision Theory and Applications
444
Table 4: Outdoor place recognition results for the Oxford Radar RobotCar dataset, given various distance thresholds τ.
Oxford Radar RobotCar recall@1
Method BB τ = 25 m τ = 10 m τ = 5 m τ = 2 m
Test 01 (later time of day)
Radenovi
´
c (Radenovi
´
c et al., 2019) VGG16 98.39 97.42 95.82 59.86
ResNet50 98.01 97.23 95.96 59.94
NetVLAD (Arandjelovi
´
c et al., 2018) VGG16 80.14 76.81 72.29 44.25
ResNet50 92.67 89.60 84.24 52.14
Test 02 (diff. day, same time)
Radenovi
´
c (Radenovi
´
c et al., 2019) VGG16 91.37 89.37 82.16 42.02
ResNet50 95.11 93.43 86.91 48.09
NetVLAD (Arandjelovi
´
c et al., 2018) VGG16 36.11 29.32 22.40 9.65
ResNet50 70.54 63.35 52.42 23.83
Test 03 (diff. day and time)
Radenovi
´
c (Radenovi
´
c et al., 2019) VGG16 89.64 86.63 82.83 62.42
ResNet50 92.00 89.00 84.62 65.08
NetVLAD (Arandjelovi
´
c et al., 2018) VGG16 33.58 28.05 23.12 13.36
ResNet50 49.68 44.46 38.07 22.23
Furthermore, we evaluated the pre-trained mod-
els of both Radenovi
´
c et al. and NetVLAD meth-
ods to investigate how much fine-tuning with our
custom indoor and outdoor datasets could improve
the visual place recognition performance. For both
datasets, there is a significant improvement of the re-
sults. For instance, we find out that considering nearly
20 −50 % of queries which are randomly drawn per
one training epoch in the indoor COLD database
could potentially enhance the performance results up
to approximately 80 % during fine-tuning.
6 CONCLUSIONS
In this paper, we evaluated the performance of two
state-of-the-art deep metric learning methods for the
problem of visual place recognition. We used both
indoor and outdoor datasets with diverse and large
long-term variations, including time, illumination and
weather to investigate the performance results of
these methods. Our evaluation results indicate that
fine-tuning the Radenovi
´
c et al. (Radenovi
´
c et al.,
2019) method with visual place recognition datasets
achieves recall rate of 80 % or greater for a given lo-
calization accuracy in the indoor and outdoor datasets,
respectively.
As an alternative, we compared the obtained re-
sults of the NetVLAD (Arandjelovi
´
c et al., 2018)
method which is trained and fine-tuned for our cus-
tom indoor and outdoor datasets. Compared to Rade-
novi
´
c et al. (Radenovi
´
c et al., 2019) method, it re-
vealed less robust performance due to challenging
illumination and weather conditions in both indoor
and outdoor datasets. Our findings from the two
state-of-the-art deep learning architectures confirms
that ResNet50 performs slightly better than VGG16
backbones considering the larger computational ex-
penses. Therefore, we adopt VGG16 backbone since
it is more computationally affordable.
Based on our findings from multiple experiments
for both indoor and outdoor datasets, the deep archi-
tecture by Radenovi
´
c et al. (Radenovi
´
c et al., 2019)
outperforms the NetVLAD architecture by Arand-
jelovi
´
c et al. (Arandjelovi
´
c et al., 2018) with a clear
margin. The reason to clarify the better perfor-
mance of Radenovi
´
c et al. method lies in selection
of training image pairs for the positives and the neg-
atives samples with queries forming the training tu-
ples. NetVLAD method suffers from the insufficient
learning of the positive and the negative pairs which
are selected based on the lowest and the highest de-
scriptor distance to the query, respectively. Further-
more, our comprehensive study confirms that both
deep learning architectures obtain the best results with
ResNet50 backbone and by fine-tuning the architec-
ture with data specific training data.
One possible direction for the future work can be
an indoor data acquisition to a larger extent with more
challenging illumination conditions, suitable for the
problem of visual place recognition with more pre-
cise ground-truth and complementary sensors, e.g.,
Evaluation of Long-term Deep Visual Place Recognition
445

Table 5: Results for different number of queries randomly drawn per one training epoch using the most challenging test
sequences, Test 03, in both indoor and outdoor datasets. The gallery and test sets contain all images. “0” indicates that the
dataset specific fine-tuning is skipped.
Oxford Radar RobotCar (τ = 5 m)
recall@1
Method BB 37k (all) 10k 5k 2k 0
Test 03 (diff. day and time)
Radenovi
´
c (Radenovi
´
c et al., 2019) VGG16 95.82 86.10 87.53 88.91 72.62
NetVLAD (Arandjelovi
´
c et al., 2018) VGG16 80.14 13.82 20.48 21.83 23.35
COLD (τ = 50 cm)
recall@1
Method BB 1k (all) 500 250 100 0
Test 03 (diff. day and time)
Radenovi
´
c (Radenovi
´
c et al., 2019) VGG16 77.73 78.35 80.10 77.53 77.22
NetVLAD (Arandjelovi
´
c et al., 2018) VGG16 66.80 70.52 71.86 71.13 71.55
LiDAR. It is useful to (1) investigate to what ex-
tent and how number of queries randomly drawn per
one train epoch could potentially influence the re-
call@1 rate within certain localization accuracy and
(2) whether or not sensor fusion of RGB and LiDAR
could further improve the performance results in the
indoor environment.
REFERENCES
Arandjelovi
´
c, R., Gronat, P., Torii, A., Pajdla, T., and Sivic,
J. (2018). NetVLAD: Cnn architecture for weakly su-
pervised place recognition. TPAMI.
Azizpour, H., Razavian, A. S., Sullivan, J., Maki, A., and
Carlsson, S. (2015). From generic to specific deep
representations for visual recognition. In 2015 IEEE
Conference on Computer Vision and Pattern Recogni-
tion Workshops (CVPRW), pages 36–45.
Badino, H., Huber, D., and Kanade, T. (2011). Visual topo-
metric localization. In 2011 IEEE Intelligent Vehicles
Symposium (IV), pages 794–799.
Barnes, D., Gadd, M., Murcutt, P., Newman, P., and Posner,
I. (2020). The oxford radar robotcar dataset: A radar
extension to the oxford robotcar dataset. In 2020 IEEE
International Conference on Robotics and Automation
(ICRA), pages 6433–6438.
Bay, H., Ess, A., Tuytelaars, T., and Van Gool, L. (2008).
Speeded-up robust features (surf). Computer Vision
and Image Understanding, 110(3):346–359. Similar-
ity Matching in Computer Vision and Multimedia.
Blanco-Claraco, J.-L.,
´
Angel Moreno-Due
˜
nas, F., and
Gonz
´
alez-Jim
´
enez, J. (2014). The m
´
alaga urban
dataset: High-rate stereo and lidar in a realistic ur-
ban scenario. The International Journal of Robotics
Research, 33(2):207–214.
Bonin-Font, F., Ortiz, A., and Oliver, G. (2008). Visual
navigation for mobile robots: A survey. J Intell Robot
Syst.
Chen, D. M., Baatz, G., K
¨
oser, K., Tsai, S. S., Vedantham,
R., Pylv
¨
an
¨
ainen, T., Roimela, K., Chen, X., Bach, J.,
Pollefeys, M., Girod, B., and Grzeszczuk, R. (2011).
City-scale landmark identification on mobile devices.
In CVPR 2011, pages 737–744.
Chopra, S., Hadsell, R., and LeCun, Y. (2005). Learning a
similarity metric discriminatively with application to
face verification. In CVPR.
Cummins, M. and Newman, P. (2008). Fab-map: Proba-
bilistic localization and mapping in the space of ap-
pearance. The International Journal of Robotics Re-
search, 27(6):647–665.
Cummins, M. and Newman, P. (2011). Appearance-only
slam at large scale with fab-map 2.0. The Inter-
national Journal of Robotics Research, 30(9):1100–
1123.
Dalal, N. and Triggs, B. (2005). Histograms of oriented gra-
dients for human detection. In 2005 IEEE Computer
Society Conference on Computer Vision and Pattern
Recognition (CVPR’05), volume 1, pages 886–893
vol. 1.
DeSouza, G. and Kak, A. (2002). Vision for mobile robot
navigation: A survey. TPAMI.
Galvez-L
´
opez, D. and Tardos, J. D. (2012). Bags of binary
words for fast place recognition in image sequences.
IEEE Transactions on Robotics, 28(5):1188–1197.
Geiger, A., Lenz, P., and Urtasun, R. (2012). Are we ready
for autonomous driving? the kitti vision benchmark
suite. In 2012 IEEE Conference on Computer Vision
and Pattern Recognition, pages 3354–3361.
Gordo, A., Almaz
´
an, J., Revaud, J., and Larlus, D. (2017).
End-to-End Learning of Deep Visual Representa-
tions for Image Retrieval. Int. J. Comput. Vision,
124(2):237–254.
He, K., Zhang, X., Ren, S., and Sun, J. (2016). Deep resid-
ual learning for image recognition. In 2016 IEEE Con-
VISAPP 2022 - 17th International Conference on Computer Vision Theory and Applications
446

ference on Computer Vision and Pattern Recognition
(CVPR), pages 770–778.
J
´
egou, H., Douze, M., Schmid, C., and P
´
erez, P. (2010).
Aggregating local descriptors into a compact image
representation. In 2010 IEEE Computer Society Con-
ference on Computer Vision and Pattern Recognition,
pages 3304–3311.
Kalantidis, Y., Mellina, C., and Osindero, S. (2016). Cross-
Dimensional Weighting for Aggregated Deep Convo-
lutional Features. In Computer Vision – ECCV 2016
Workshops, pages 685–701. Springer, Cham, Switzer-
land.
Lowe, D. G. (2004). Distinctive Image Features from Scale-
Invariant Keypoints. Int. J. Comput. Vision, 60(2):91–
110.
Lowry, S., S
¨
underhauf, N., Newman, P., Leonard, J. J.,
Cox, D., Corke, P., and Milford, M. J. (2016). Vi-
sual place recognition: A survey. IEEE Transactions
on Robotics, 32(1):1–19.
Maddern, W., Pascoe, G., Linegar, C., and Newman, P.
(2017). 1 year, 1000 km: The oxford robotcar
dataset. The International Journal of Robotics Re-
search, 36(1):3–15.
Masone, C. and Caputo, B. (2021). A survey on deep visual
place recognition. IEEE Access, 9:19516–19547.
Milford, M. J. and Wyeth, G. F. (2012). Seqslam: Vi-
sual route-based navigation for sunny summer days
and stormy winter nights. In 2012 IEEE International
Conference on Robotics and Automation, pages 1643–
1649.
Olid, D., F
´
acil, J. M., and Civera, J. (2018). Single-view
place recognition under seasonal changes. CoRR,
abs/1808.06516.
Pandey, G., McBride, J. R., and Eustice, R. M. (2011). Ford
campus vision and lidar data set. The International
Journal of Robotics Research, 30(13):1543–1552.
Pion, N., Humenberger, M., Csurka, G., Cabon, Y., and Sat-
tler, T. (2020). Benchmarking image retrieval for vi-
sual localization. In Int. Conf. on 3D Vision (3DV).
Pitropov, M., Garcia, D. E., Rebello, J., Smart, M., Wang,
C., Czarnecki, K., and Waslander, S. (2021). Canadian
adverse driving conditions dataset. The International
Journal of Robotics Research, 40(4-5):681–690.
Pronobis, A. and Caputo, B. (2009). Cold: The cosy
localization database. The International Journal of
Robotics Research, 28(5):588–594.
Radenovi
´
c, F., Tolias, G., and Chum, O. (2019). Fine-tuning
cnn image retrieval with no human annotation. IEEE
Transactions on Pattern Analysis and Machine Intel-
ligence, 41(7):1655–1668.
Radenovic, F., Iscen, A., Tolias, G., Avrithis, Y., and Chum,
O. (2018). Revisiting oxford and paris: Large-scale
image retrieval benchmarking. In 2018 IEEE/CVF
Conference on Computer Vision and Pattern Recog-
nition, pages 5706–5715.
Radenovi
´
c, F., Tolias, G., and Chum, O. (2016). CNN
image retrieval learns from BoW: Unsupervised fine-
tuning with hard examples. In ECCV.
Radenovi
´
c, F., Tolias, G., and Chum, O. (2018). Deep shape
matching. In ECCV.
Russakovsky, O., Deng, J., Su, H., Krause, J., Satheesh,
S., Ma, S., Huang, Z., Karpathy, A., Khosla, A.,
Bernstein, M., Berg, A. C., and Fei-Fei, L. (2015).
ImageNet Large Scale Visual Recognition Challenge.
International Journal of Computer Vision (IJCV),
115(3):211–252.
Sarlin, P., Cadena, C., Siegwart, R., and Dymczyk, M.
(2019). From coarse to fine: Robust hierarchical lo-
calization at large scale. In CVPR.
Sattler, T., Maddern, W., Toft, C., Torii, A., Hammarstrand,
L., Stenborg, E., Safari, D., Okutomi, M., Pollefeys,
M., Sivic, J., Kahl, F., and Pajdla, T. (2018). Bench-
marking 6dof outdoor visual localization in changing
conditions. In 2018 IEEE/CVF Conference on Com-
puter Vision and Pattern Recognition, pages 8601–
8610.
Sattler, T., Maddern, W., Toft, C., Torii, A., Hammarstrand,
L., Stenborg, E., Safari, D., Okutomi, M., Pollefeys,
M., Sivic, J., Kahl, F., and Pajdla, T. (2020). Bench-
marking 6DOF outdoor visual localization in chang-
ing conditions. In Int. Conf. on 3D Vision (3DV).
Sattler, T., Weyand, T., Leibe, B., and Kobbelt, L. (2012).
Image retrieval for image-based localization revisited.
In Proceedings of the British Machine Vision Confer-
ence, pages 76.1–76.12. BMVA Press.
Simonyan, K. and Zisserman, A. (2015). Very deep con-
volutional networks for large-scale image recognition.
In International Conference on Learning Representa-
tions.
Taira, H., Okutomi, M., Sattler, T., Cimpoi, M., Pollefeys,
M., Sivic, J., Pajdla, T., and Torii, A. (2021). Inloc: In-
door visual localization with dense matching and view
synthesis. IEEE Transactions on Pattern Analysis and
Machine Intelligence, 43(4):1293–1307.
Tolias, G., Sicre, R., and J
´
egou, H. (2016a). Particular
Object Retrieval With Integral Max-Pooling of CNN
Activations. In ICL 2016 - RInternational Confer-
ence on Learning Representations, International Con-
ference on Learning Representations, pages 1–12, San
Juan, Puerto Rico.
Tolias, G., Sicre, R., and J
´
egou, H. (2016b). Particular ob-
ject retrieval with integral max-pooling of cnn activa-
tions.
Williams, B., Klein, G., and Reid, I. (2011). Automatic
relocalization and loop closing for real-time monocu-
lar slam. IEEE Transactions on Pattern Analysis and
Machine Intelligence, 33(9):1699–1712.
Xu, M., Snderhauf, N., and Milford, M. (2002). Vision for
mobile robot navigation: A survey. TPAMI.
Yandex, A. B. and Lempitsky, V. (2015). Aggregating local
deep features for image retrieval. In 2015 IEEE In-
ternational Conference on Computer Vision (ICCV),
pages 1269–1277.
Zhang, X., Wang, L., and Su, Y. (2020). Visual place recog-
nition: A survey from deep learning perspective. Pat-
tern Recognition, page 107760.
Evaluation of Long-term Deep Visual Place Recognition
447
