
Anvil: A Tool for Visual Debugging of Rendering Pipelines
Kevin Napoli
a
, Keith Bugeja, Sandro Spina, Mark Magro and Adrian De Barro
CGVG, Department of Computer Science, Faculty of ICT, University of Malta, Msida, Malta
Keywords:
Graphical Applications, Render Pipeline Debugging, Ray Tracing.
Abstract:
Debugging software can be challenging and numerous tools are used to aid in this task. Moreover, inspecting
and debugging software of a certain nature such as those found in the subdomain of physically based rendering,
where stochastic methods are often utilised, can be even more challenging. Traditional debugging in these
cases is not ideal and in many cases not sufficient to help pinpoint certain issues, such as finding defects in the
distribution of reflected rays in a ray-based rendering scenario. To address these issues we propose Anvil, a
visual debugging tool that aims to seamlessly integrate within user applications, adhering to the what you don’t
use, you don’t pay for C++ zero-overhead principle. Anvil is meant to be flexible, reusable, and extensible
while adopting a low memory footprint. To achieve its goals, Anvil makes use of reflection-like techniques,
adopts in situ analysis, and provides event hooks to communicate with the user application.
1 INTRODUCTION
Software debugging is a process employed to find and
fix issues in applications. Common debuggers such as
GDB, LLDB and NVIDIA Nsight include the ability
to breakpoint, watch variables and execute code line
by line while inspecting all the variables that are in
scope. Typically, GPU debuggers record frames and
allow for later analysis. Stepping through code is pos-
sible, such as in Microsoft’s Visual Studio Graphics
Diagnostics and PIX, where one can step through Di-
rectX shaders. GPU debuggers allow one to inspect
how the whole render pipeline is executed to gener-
ate a frame. The information presented to the user
is very detailed and includes a view of the resources
used, such as textures. Undoubtedly, GPU debuggers
are useful in that they allow one to inspect and step
through every detail of an application. However, these
debuggers operate at a very low level and as a result
are too generic.
Physically based rendering is a subdomain in
computer graphics that tries to solve the rendering
equation (Kajiya, 1986). As this equation has no an-
alytical solution, stochastic methods are employed to
find an approximative solution. Ensuring correctness
and finding implementation issues in such cases is not
trivial. For example, with traditional debuggers, one
can analyse the fields making up a directional vec-
tor and try to imagine where it is pointing. One can
a
https://orcid.org/0000-0001-9749-0509
also try to debug a path in a ray tracing based ap-
plication, however one can appreciate how difficult
this becomes. This is particularly the case when is-
sues manifest after a large number of samples. Often-
times, a rendered image may look fine but the energy
propagation does not match the ground truth. Achiev-
ing this level of correctness is particularly important
when visualising cultural heritage sites and artefacts.
In these cases, it might be important to verify proba-
bility distributions. This again can be hard to do and
it is evident that current debugging tools are ill-suited
for such cases.
In this paper we present Anvil, a visual debugging
and analysis tool that aids in such scenarios. It aims
to seamlessly integrate in user applications and im-
prove upon the debugging process. It aims to be effi-
cient, flexible and extensible. Anvil needs to be effi-
cient within the constraints of interactive debugging.
It needs to be extensible so that users may be able to
add visualisations, and tweak existing ones easily. It
also needs to be flexible, in that it should not only
solve problems in the domain of computer graphics
but ideally should be usable in other domains where
debugging at a higher level of abstraction is needed.
Finally, Anvil aims to identify common structures in
three-dimensional graphics which we call atoms and
molecules. An example of an atom and a molecule is
a vector and a ray respectively. The end user should
also be able to add both via extension.
196
Napoli, K., Bugeja, K., Spina, S., Magro, M. and De Barro, A.
Anvil: A Tool for Visual Debugging of Rendering Pipelines.
DOI: 10.5220/0010834200003124
In Proceedings of the 17th International Joint Conference on Computer Vision, Imaging and Computer Graphics Theory and Applications (VISIGRAPP 2022) - Volume 1: GRAPP, pages
196-203
ISBN: 978-989-758-555-5; ISSN: 2184-4321
Copyright
c
2022 by SCITEPRESS – Science and Technology Publications, Lda. All rights reserved

Figure 1: Anvil debugging session. From left to right: Application framebuffer view, path view, debug view, overlay.
2 BACKGROUND
The Entity Component System (ECS) is a data-driven
design pattern popular in game architecture. Scott Bi-
las (Bilas, 2002) introduced the idea of a data-driven
approach to game design in a presentation where the
problems resulting from the use of Object Oriented
Programming (OOP) in the context of Massively Mul-
tiplayer Online (MMO) games were discussed. Bilas
explained that when using OOP, one ends up with a
large inheritance tree that tends to resist code changes.
To get around this, in some cases developers resort to
shortcuts such as hoisting, resulting in large mono-
lithic classes. In such games, using OOP, develop-
ers end up hard coding a database into a class hi-
erarchy. Instead, Bilas introduced the concept of a
component system, where each component is a self-
contained piece of game logic. The game object, an
item that represents a particular object or element in
a game, stores a list of such components. The key
idea is that an application whose functionality is cen-
tred around data cannot work by data-driving object
properties but by data-driving the structure of objects.
Martin (Martin, 2007) furthered Bilas’s work by
refining the component system into an ECS. Martin
defines an entity to simply be a GUID, a component
to store raw data that provides an aspect to an entity
and finally a system where all logic acting on com-
ponent data is placed. ECS is powerful when data
is the main driver, because it allows one to change an
object’s capabilities simply by adding/removing com-
ponents. To achieve this in classic OOP, one would
need to change the class hierarchy.
Software quality attributes help one understand
how a system performs with respect to certain aspects.
They also help one compare how one system fares
with respect to another one and are useful in guiding
design decisions. Extensibility is a software quality
attribute that measures how easy it is for software to
grow in time (Szyperski, 1996). Flexibility is another
software quality attribute. Software is flexible if it is
easy to perform changes to it in order to add func-
tionality for use in different domains. Flexibility is
directly linked to the amount of code that is affected
upon change. Eden et al. (Eden and Mens, 2006)
quantify flexibility by introducing the notion of evo-
lution complexity. An evolution function is used to
characterise evolution steps which are then evaluated
using a cost metric.
3 RELATED WORK
To the extent of our knowledge, a debugging tool sim-
ilar to Anvil does not exist. The reason for this may be
because most graphics engines and applications are
debugged using custom debugging tools developed
for a specific engine, and these tools hardly ever make
it into the public domain.
Total Recall (Sharif and Lee, 2008) is a debugging
framework specifically made for GPU debugging. It
works by observing the API calls that are made by the
application to the rendering API and replaying them
during debugging. Total Recall allows full execution
history by building a buffer dependency graph to be
able to obtain shader input values. Once all data is
collected, it is passed to the CPU emulator for analy-
sis. Additionally, hardware acceleration can be used
to speed up the emulation.
In (Hou et al., 2009) the authors implement an au-
tomatic dataflow recording and visualisation debug-
ger. This work is targeted mainly at general purpose
GPU applications. The CUDA language is extended
to offer a mechanism where the GPU can interrupt the
CPU. This is accomplished by passing the user shader
into a compiler that generates a new shader containing
instrumentation code. The advantage of this method
is that debugging is essentially being performed on
the GPU which means that the original code remains
Anvil: A Tool for Visual Debugging of Rendering Pipelines
197

faithful to the architecture. For example, it is some-
times the case that floating point operations on the
GPU do not implement the same standard as the CPU.
Therefore, debuggers that replay or emulate the GPU
on the host tend to suffer from such inconsistencies.
The Ray Tracing Visualisation Toolkit (rtVTK)
(Gribble et al., 2012) is a tool supporting visualisation
and analysis of ray-based rendering algorithms. Ap-
plications send data to rtVTK via the ray logger API
where ray data such as origin, direction and length are
recorded. Visualisation plugins are then developed in
order to consume this data. Gribble et al. show this us-
ing a ray visualiser plugin amongst others, such as a
BVH viewer. rtVTK is designed to help debug issues
in ray-tracing applications as well as aid students to
better understand ray-based algorithms. rtVTK pro-
vides debugging through visualisation which can be
extended via plugins, however it is only limited to
rays. In contrast, Anvil is more flexible as there is
no such limitation and through its design achieves a
wider range of functionality.
GLDebug (Van Dyk et al., 2013) is a graphics
debugger targeted at OpenGL applications. It is de-
signed to inspect state changes occurring in OpenGL.
OpenGL is implemented as a state machine and third-
party libraries might modify its state erroneously.
GLDebug is capable of detecting such issues and lets
one avoid the use of cluttering the code with state
queries. It also allows state history comparison, so
that a working version can be compared with a faulty
version allowing one to pinpoint issues.
Podila & Zhu developed a tool that visualises data
flow transfers between the CPU and the GPU (Podila
and Zhu, 2016). Their implementation generates a
graph showing how host variables are connected to
shader variables. While current tools will detect er-
rors such as not binding needed variables, they will
not visualise broken data connections and developers
will need to find the issue manually by reading the
source code.
NVIDIA Nsight is a tool that can be used to anal-
yse the shading pipeline running on the GPU. It shows
all the draw calls, allows one to record frames that can
later be replayed and shows statistics in order to be
able to find bottlenecks. Microsoft PIX is a tool that
offers similar features. cuPrintF is another tool that
may be used for easier debugging scenarios. It allows
one to use printf-like functionality inside a shader.
The Unity framework also offers similar debugging
functionalities, such as the Frame Debugger.
All of the above options are very useful for debug-
ging but do not offer ways to visualise common data
structures that are more specific. On top of that, in
most of the above, debugging happens after recording
and as such, one debugs the application offline. Anvil
allows one to perform online debugging and to use
ready-made visualisers that can be shared with other
users to visualise and debug higher-level data struc-
tures.
4 ANVIL
One important design principle that has been adopted
in Anvil is simplicity (see Figure 1). Anvil is a tool
that helps one analyse and debug graphics applica-
tions; it is important for end users to stay focussed
on their current task and not waste time trying to set
up an external tool. This is the reason we strongly
believe Anvil should be simple to set up and use. Re-
flection together with macros are used to make inter-
facing with Anvil as simple as possible.
Anvil has been designed to promote component
reusability. Anvil is divided into two functional
groups: instrumentation and analysis/visualisation.
Instrumentation is tightly coupled to the user code,
however analysis and visualisation are independent of
the user code. This means that any implemented vi-
sualisation and analysis logic can be reused.
Anvil is data-driven and has been designed pri-
marily to make use of the Entity Component System
(ECS) design pattern. This design pattern has been
chosen as it provides Anvil with the flexibility it re-
quires. It allows Anvil to decouple the data from the
logic. As the user is expected to seamlessly post a
stream of data, this design is a natural fit. An ad-
vantage of this is that complex and deep inheritance
hierarchies are avoided. Without an ECS-like design,
an entity would have to potentially implement multi-
ple interfaces, where an interface implementation in
addition to related data would represent a component
in ECS.
To address flexibility, Anvil is designed to be
cross-platform and modular. It is not tightly coupled
to the graphics domain and it is API agnostic. This
loose coupling allows it to run on any platform with
few dependencies. A plugin system addresses the ex-
tensibility aims. Finally, Anvil makes use of reflec-
tion, a concept that is missing in C++, in order to be
able to understand and visualise user data structures.
4.1 Design
Figure 2 illustrates at a high level the architecture of
Anvil. Atoms and molecules are used during the in-
strumentation phase of the application. The required
visualisation and analysis both depend on the instru-
mentation. Systems communicate through events.
GRAPP 2022 - 17th International Conference on Computer Graphics Theory and Applications
198
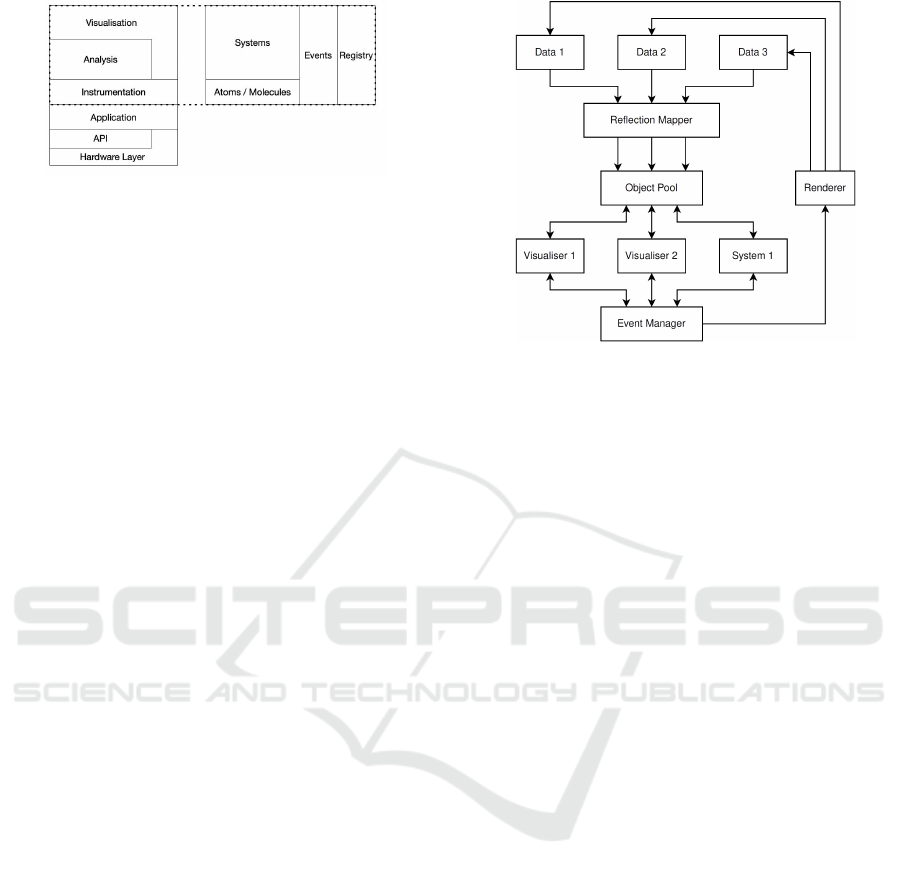
Figure 2: Anvil architecture.
The registry is used throughout Anvil to store atoms
and molecule definitions which are then used by the
application and systems. Anvil is intended to be used
across different hardware architectures and APIs (for
example, OpenGL, DirectX, etc).
In an ECS context, an entity is the object that we
want to debug. A component is a field/method inside
the object and a system is a debugger. Anvil provides
a number of systems out of the box, such as a camera
visualiser and a mesh visualiser. Reflection is used
to register and categorise class members as compo-
nents. Systems can then operate on these components
as required. For instance, a wireframe viewer system
could iterate through all mesh entities that have a po-
sition component, in order to render a wireframe of a
scene.
An atom is the smallest piece of data that Anvil
operates upon. Additionally, atoms have semantic at-
tributes attached to them. For instance, even though
position and direction can be represented as vectors
that contain the same data representation, they have
different meaning. Therefore, an atom is tagged
to preserve its semantics. A molecule ties multiple
atoms together, the aggregation of which forms new
semantics. For example, a ray is a molecule made
up of a position atom and a direction atom. Through
a user-provided mapping, a reflection component is
used to extract data from the user object, and trans-
forms it into a stream of atoms and molecules. This
stream is what Anvil is designed to operate upon.
Visualisers and analysers are implemented as sys-
tems in the context of the ECS design pattern. Vi-
sualisers operate directly on the atom and molecule
stream. They work only with certain atoms and
molecules. For instance, a path visualiser can un-
derstand a path molecule and will not operate on a
ray molecule. Additionally, molecules can be broken
down into atoms and these atoms can be re-injected
into the stream. This allows other systems to oper-
ate on these atoms if required. This behaviour can be
achieved by using the Anvil Decomposer system.
Anvil is called from the render loop commonly
found in most rendering applications. Users are
first expected to register the objects that need to be
Figure 3: Anvil data flow diagram.
watched and then delegate control to Anvil. At this
point, Anvil enumerates all available systems and
these in turn process the user data. Users can commu-
nicate directly with these systems via event callbacks.
Figure 3 illustrates how data flows in Anvil. Data is
mapped via the reflection mapper and transformed to
objects containing atoms and molecules. These ob-
jects are stored in the Object Pool. The visualisers
and other systems can consume and edit these objects.
Additionally, they can publish events for internal and
external communication.
4.2 Usage
The data that needs to be monitored must first be iden-
tified. Then, the relevant atoms and molecules must
be loaded and registered. If an atom/molecule does
not exist it must first be developed. The next step is to
instrument the application. This consists of mapping
the atoms and molecules with the user data structures
and submitting the actual data to Anvil for analysis
and visualisation. Listing 1 shows how a mapping
from the user’s Vector3 class occurs. Part of the atom,
“X”, is mapped to the public class data member x in-
side Vector3.
REFLECT_BEGIN(Vector3);
addMember("X", &Vector3::x);
addMember("Y", &Vector3::y);
addMember("Z", &Vector3::z);
REFLECT_END();
Listing 1: Anvil registrations.
If data members are private but there are public
getter methods, then these can be referenced instead.
If there are no public getter methods, the user must
use the REFLECT() macro. This macro sets a class to
be a friend with the relevant reflection class (in C++,
Anvil: A Tool for Visual Debugging of Rendering Pipelines
199

a class that is listed as a friend in another class can
access the private fields of the latter class). Listing 2
shows the usage of this macro. If the user cannot mod-
ify the class that needs to be mapped and this class
has private data that is exposed through other means,
a wrapper class must be used. The user can wrap the
class and expose the data using getter methods to the
wrapper class.
class Vector3 {
float x, y, z;
REFLECT(Vector3);
}
Listing 2: Handling private data members.
The final instrumentation step is to sub-
mit the actual data. This is performed us-
ing the addReflectionEntity method. For in-
stance, to monitor a ray, the user would call
Anvil::addReflectionEntity("Ray", ray);
where ray is the user’s ray instance and the string
“Ray” is the molecule semantics. In order to debug
GPU-based applications, an additional step of copy-
ing the data of interest from the shader to the host is
required.
The user should then identify what type of anal-
ysis is needed. This determines which system one
may use. The list of available and compatible sys-
tems can be queried from the registry by using the
previously identified atoms/molecules. If the desired
system is not available, it must be developed and reg-
istered within the global registry. Systems can be de-
veloped easily as they only need to implement an ‘ex-
ecute’ method.
Events in Anvil are used to propagate messages
between systems and to provide feedback to the user
application. Events can be used to dispatch mes-
sages related to breakpoints as well as system-related
data. Finally, whenever analysis and visualisation are
needed, the user calls Anvil::tick();
5 EVALUATION
Anvil was evaluated on three problems in the context
of real-time physically based rendering (PBR). In this
section, we present the results of our evaluation and
compare it to the traditional debugging approach.
5.1 Path Tracing
In path tracing, Monte Carlo methods are typically
used to compute an approximative solution to the ren-
dering equation. In these stochastic methods, reduc-
Figure 4: Rendering artefacts (fireflies) persisting after 50K
samples.
ing variance accelerates convergence to the solution.
One such variance-reduction method is next event es-
timation (NEE).
Figure 4 shows the Cornell Box scene with an area
light source directed towards the ceiling. Numerous
very bright pixels, or fireflies, were observed. The
fireflies persisted even after computing 50000 sam-
ples per pixel, but would slowly fade away after many
more samples. It was not obvious whether this was
an implementation issue or a normal occurrence when
using NEE.
Traditional Approach: NVIDIA Nsight was used to
debug this problem. The radiance values of the of-
fending pixels were read and it was noted that the
values were abnormally high for these pixels. Even
though a large number of radiance samples were
taken, the average of these values was still high since
there was one sample that caused a big spike. The
next step consisted of capturing a ray that gener-
ates this phenomenon. The strategy employed was
to replicate the issue and capture the seed of the ran-
dom number generator (RNG). The application was
modified so that the RNG could be seeded. As shader
debugging is limited in DirectX 12, the only op-
tion to capture the required data was to copy it from
the GPU to the host in every frame. As the appli-
cation was seeded, the pixel that generated the un-
wanted issue was known ahead of time and therefore,
ray data could be captured only for that particular
pixel. Whenever the radiance value exceeded a pre-
set threshold, the path data for that particular frame
and pixel were saved for offline analysis. The data
was analysed by painstakingly going through the path
data. To visualise the data, the rays were manually
drawn in a third-party modelling application on top
of the Cornell Box scene. Eventually, it was ob-
GRAPP 2022 - 17th International Conference on Computer Graphics Theory and Applications
200
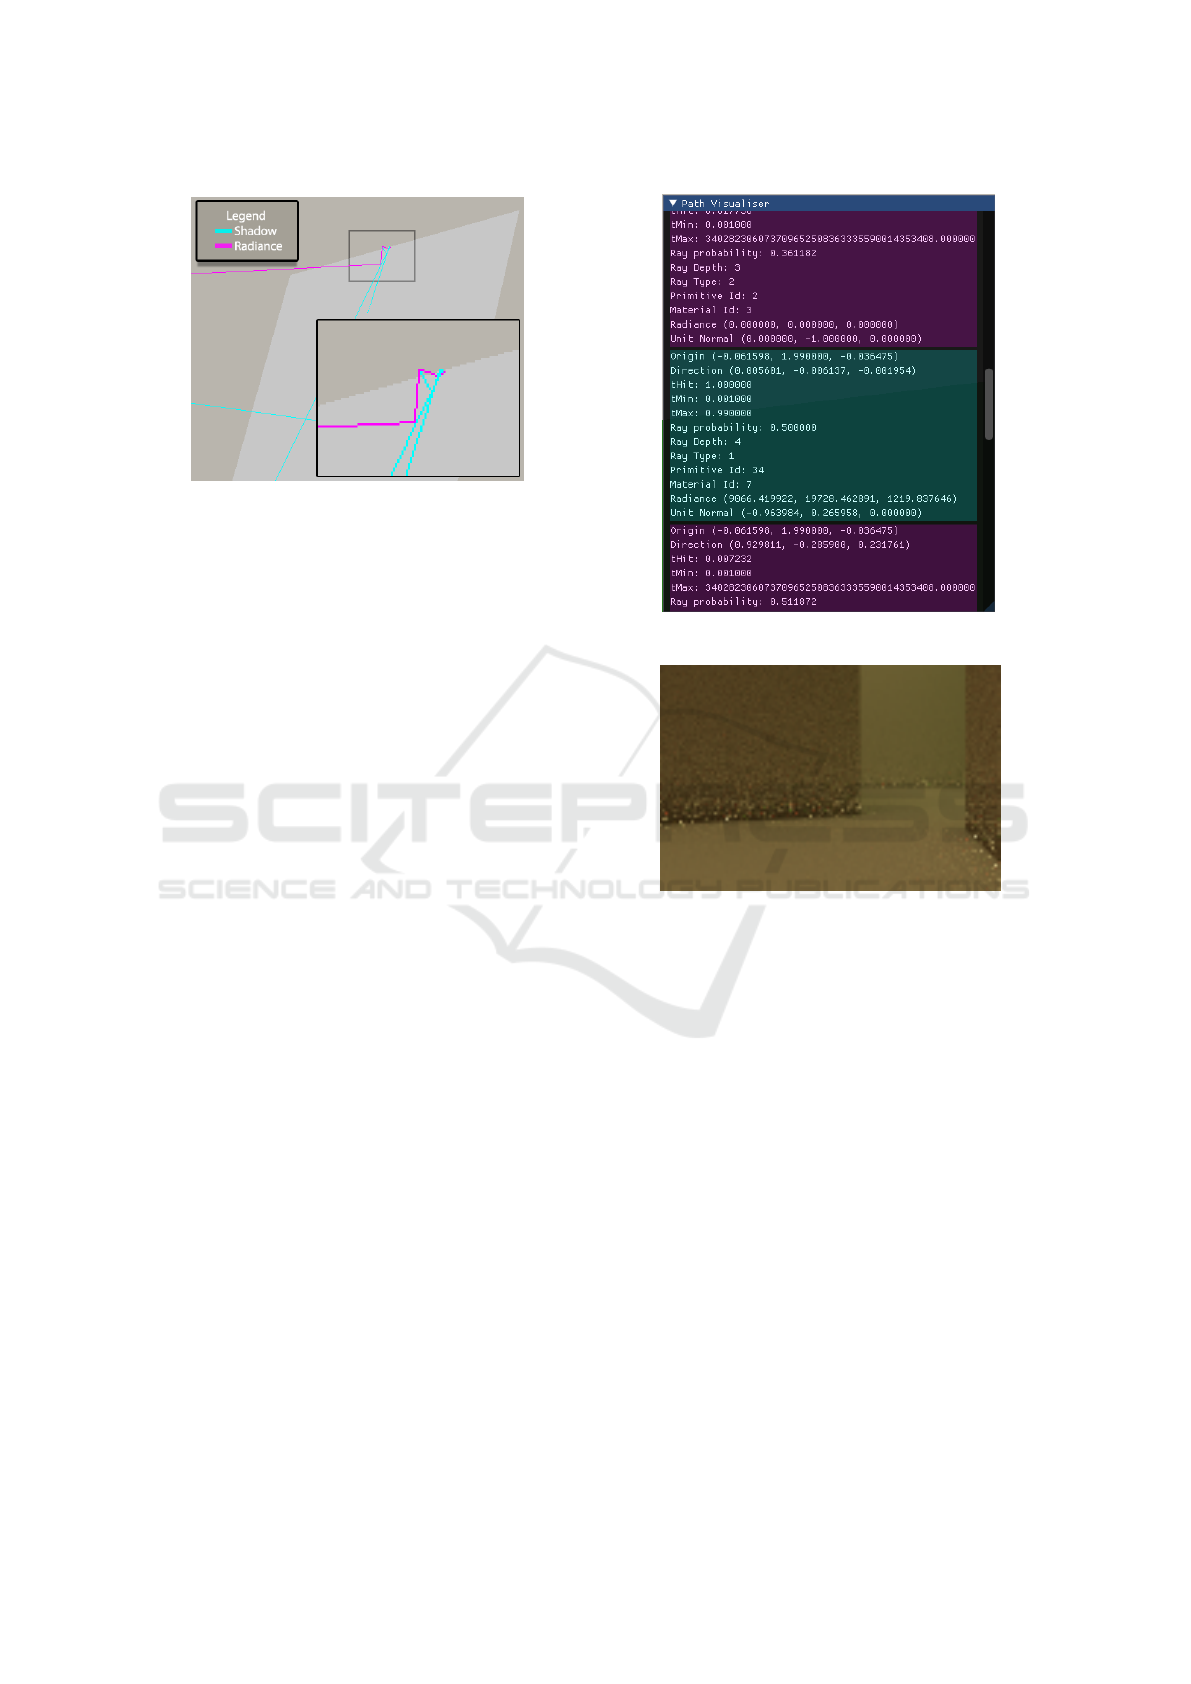
Figure 5: Path visualiser focusing on the anomaly.
served that paths that collect radiance close to the
light source had extremely high values that propagate
back to the root ray of the path.
Anvil Approach: The application was first changed
in order to allow RNG seeding. Additionally, the
functionality to copy data from the GPU to the host
for a particular pixel was implemented. For this sce-
nario, Anvil’s path visualiser was used. The visualiser
requires a path molecule, and therefore host data re-
trieved from the GPU needs to be mapped accord-
ingly. This is accomplished by adding another source
file to the application where all required mappings
are performed. Once all the necessary mappings are
registered, the data for the selected pixel can be sent
to Anvil by using the host’s original data structures
which are tagged with the string “Path”. Under the
hood, Anvil adds the path molecule to an entity. At
the end of the frame, control is delegated to Anvil.
For this debugging session, a conditional breakpoint
was set in the path visualiser to pause when the radi-
ance value exceeded a certain threshold. The renderer
was left to run until the breakpoint hit.
Figure 5 shows the paused path visualiser, where
the rays for the current frame are displayed alongside
the scene geometry. Every hit point is listed in Fig-
ure 6. The green panel captures the moment where the
radiance value went abnormally high. It can be seen
that the ray in this case is very short (since this is a
shadow ray, the magnitude of the direction vector de-
termines its length). The magnitude was calculated to
be 0.0086 units and the conclusion was that the issue
was due to the nature of NEE (when using the inverse
square law, a division by 0.0086 squared is required,
resulting in the high radiance value observed).
5.2 Bidirectional Path Tracing
The Bidirectional Path Tracing (BPT) algorithm is a
technique typically used to render PBR scenes. Sam-
pling a pixel requires starting paths from both the
Figure 6: Path visualiser showing additional information.
Figure 7: Rendering artefacts persisting after 4K samples.
camera and a light source. The two paths are then
connected and weighted appropriately. Our CPU-
based implementation follows Lafortune’s algorithm
(Lafortune and Willems, 1993). A problem was noted
where shading was not properly applied at the edges
of objects. Figure 7 shows a close-up of an intersect-
ing edge of the tall box and the floor in the Cornell
Box scene. After 4000 samples, the edges were still
very noisy. It was not clear whether this was an imple-
mentation issue or a consequence of how Lafortune’s
algorithm works in this context.
Traditional Approach: Breakpoints were employed
at the points where radiance contributions are added
to check whether all pixels were being sampled in
that region, and this was the case. A second test
was employed to check whether any NaN values were
present, but this was not the case. Debugging by step-
ping through the code proved futile. All the paths with
the relevant information pertaining to all samples in a
small area. A Python script was developed to run sta-
tistical analysis and help visualise ray positions, di-
rections and distributions. We expected the edge to
Anvil: A Tool for Visual Debugging of Rendering Pipelines
201
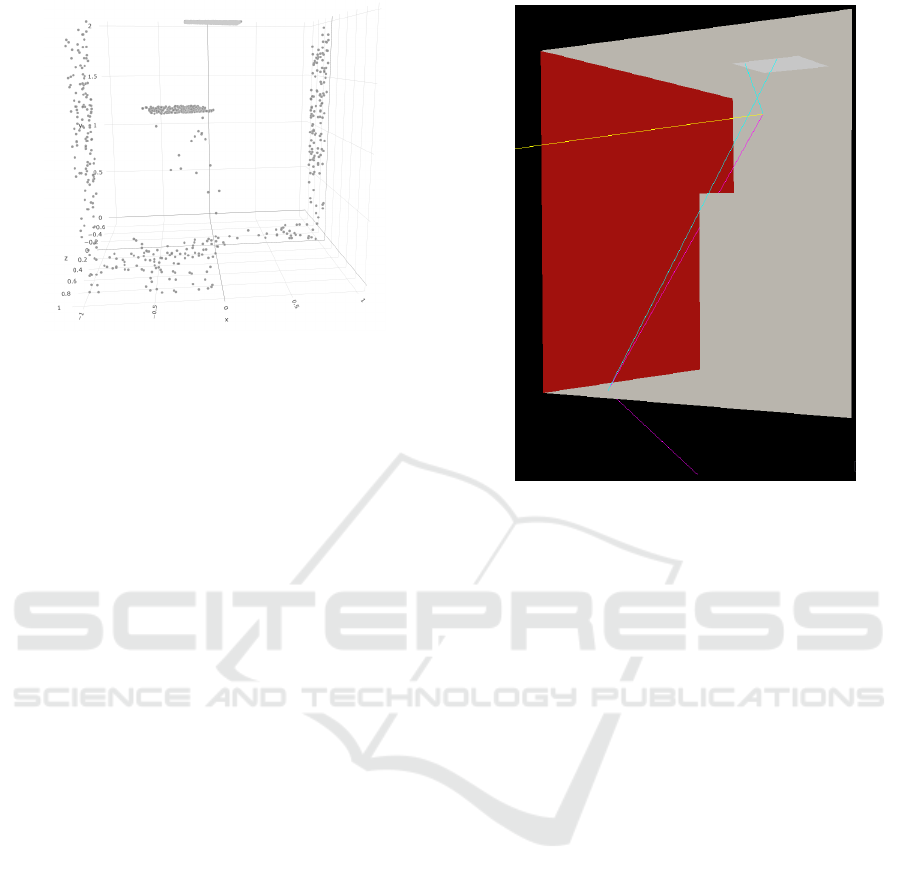
Figure 8: Web visualiser showing hit points at depth 2.
be illuminated well by indirect light, specifically by
light reflecting off the short box. However, from the
information gathered, we determined that hardly any
light was being reflected towards the edge due to the
narrow angle that the area light makes with the verti-
cal face of the short box.
Anvil Approach: The first step was to identify which
visualiser to use in this case. As the problem persisted
across an area, it made sense to capture data across the
area and visualise it. To achieve this, a web-based ra-
diance and point visualiser was used. Moreover, the
ability to select points on the image and analyse the
distribution of shadow/probe rays was required. The
second step involved understanding what the visu-
aliser’s molecule is composed of. Once all the atoms
were identified, the required mappings were imple-
mented. These mappings allow Anvil to understand
the user’s data structures. Finally, the renderer is run
and the required frame buffer is passed to Anvil at
each frame. Figure 8 illustrates a filtered view of a
particular pixel inside the web visualiser. This view
shows all the points that the area light reached and
was able to connect to the selected point on the prob-
lematic dark edge. This view shows that no light was
being reflected from the short box to the tall box, and
also that the short box acts as an occluder to indirect
light from the surrounding environment.
5.3 Verification Testing
In exploratory testing, an individual performs tests
without following a predetermined script. Rather,
the individual tests the system by questioning how it
would react in a specific scenario. The results of pre-
vious tests can then be used to guide further testing
and explore other scenarios. In Section 5.1, a GPU
path tracer with NEE is used. Although this path
tracer appears to be functioning correctly, it would be
Figure 9: Anvil debug view during exploratory analysis.
ideal to check whether some properties hold, such as
energy conservation.
Traditional Approach: An assertion was added to
check that the energy added via all paths is positive.
A second assertion tests whether light is being added
from the back face of an area light. These assertions
did not fail and this served to increase confidence in
the implementation. However, test coverage was low
and many other cases needed to be tested.
Anvil Approach: The path visualiser was used to ex-
plore the scene while the renderer was running and it
was noted that a ray was being emitted from the back
face of a primitive. This behaviour is not desirable as
computation is wasted in order to generate a new ray
and propagate it into the scene. Figure 9 shows the
offending ray at the very bottom. The ray information
extracted from Anvil showed that this ray was facing
in the right direction, however the ray’s ‘t’ value was
negative. As a consequence the ray propagated back-
wards, which is faulty behaviour.
6 DISCUSSION
The evaluation in Section 5 suggests that Anvil indeed
helps in debugging graphics applications. It provides
an interactive environment suitable for debugging and
analysis. Anvil is easy to use and it only takes a few
steps to get it up and running. Once linked to an ap-
plication, it only requires the user to implement the
instrumentation steps discussed in Section 4.2 unless
GRAPP 2022 - 17th International Conference on Computer Graphics Theory and Applications
202

a visualisation/analysis system is already available.
The usability of Anvil depends on the number of sys-
tems provided out of the box, plugins shared by other
users and on the ease of extensibility. The traditional
approach may be more straightforward to set up but
Anvil provides a much richer debugging experience.
7 CONCLUSION
In this paper we have presented Anvil, a visual de-
bugging tool for PBR. Anvil is different from other
debuggers in that it is not tightly coupled to any API
or hardware. Due to its flexibility, it can be used in
other fields such as pedagogy where it would allow
students to grasp fundamentals, especially in the areas
related to stochastic rendering. For instance, teachers
could visualise the propagation of light as it happens,
allowing the students a deeper understanding of the
subject.
Overall, results suggest Anvil complements ex-
isting tools. While current debuggers help to find
low-level issues, Anvil analyses and visualises higher-
level primitives through components called atoms
and molecules. Through its design, Anvil achieves
seamless integration with the user’s application, en-
abling interactive debugging at the cost of mapping
molecules and atoms.
7.1 Limitations
Currently, there are only a small number of visualisers
and analysis tools that have been implemented. Thus,
new users will most likely need to implement their
own tools in Anvil. However, this problem is expected
to diminish with adoption. One other issue is that the
reflection component in Anvil is currently limited to
read-only access to the user data. This limits visualis-
ers/systems as these components are not able to mod-
ify data on the fly. While this can be bypassed using
events, it is not ideal as this requires the user to patch
the code and add modifications for every write that is
needed. One other problem stems from the fact that
if Anvil and the user both depend on the same library,
there can be interference. For instance, if both a visu-
aliser and the user application uses ImGui, and both
depend on ImGui’s dynamic library, the state needs to
be guarded carefully.
7.2 Future Work
The reflection component needs to be relaxed so that
it allows writing back to the user data. This would
allow a more comprehensive debugging experience.
Additionally, specialised macros and helper functions
to ease transfer of GPU to host data need to be de-
veloped. This would entail implementing function-
ality for OpenGL, DirectX, etc. Finally, since the
most time-consuming aspect in Anvil is the mapping
of data to molecules and atoms, a possible improve-
ment could be to provide a tool that facilitates/infers
these mappings. Since atoms and molecules are regis-
tered with Anvil, this tool would be able to understand
the required structure and given a user structure, au-
tomatically generate mappings.
ACKNOWLEDGEMENTS
This work was supported by the Notarial Archives of
Malta.
REFERENCES
Bilas, S. (2002). A data-driven game object system. In
Game Developers Conference Proceedings.
Eden, A. H. and Mens, T. (2006). Measuring software flex-
ibility. IEE Proceedings-Software, 153(3):113–125.
Gribble, C., Fisher, J., Eby, D., Quigley, E., and Ludwig, G.
(2012). Ray tracing visualization toolkit. In Proceed-
ings of the ACM SIGGRAPH Symposium on Interac-
tive 3D Graphics and Games, pages 71–78.
Hou, Q., Zhou, K., and Guo, B. (2009). Debugging gpu
stream programs through automatic dataflow record-
ing and visualization. In ACM SIGGRAPH Asia 2009
papers, pages 1–11.
Kajiya, J. T. (1986). The rendering equation. In Computer
Graphics, pages 143–150.
Lafortune, E. P. and Willems, Y. D. (1993). Bi-directional
path tracing. In PROCEEDINGS OF THIRD INTER-
NATIONAL CONFERENCE ON COMPUTATIONAL
GRAPHICS AND VISUALIZATION TECHNIQUES
(COMPUGRAPHICS ’93, pages 145–153.
Martin, A. (2007). Entity systems are the
future of mmog development. http://t-
machine.org/index.php/2007/09/03/entity-systems-
are-the-future-of-mmog-development-part-1.
Podila, S. and Zhu, Y. (2016). A visualization tool for 3d
graphics program comprehension and debugging. In
2016 IEEE Working Conference on Software Visual-
ization (VISSOFT), pages 111–115. IEEE.
Sharif, A. and Lee, H.-H. S. (2008). Total recall: a de-
bugging framework for gpus. In Proceedings of the
23rd ACM SIGGRAPH/EUROGRAPHICS symposium
on Graphics hardware, pages 13–20.
Szyperski, C. (1996). Independently extensible systems-
software engineering potential and challenges. Aus-
tralian Computer Science Communications, 18:203–
212.
Van Dyk, B., Lutteroth, C., Weber, G., and W
¨
unsche, B.
(2013). Using opengl state history for graphics de-
bugging. V
´
aclav Skala-UNION Agency.
Anvil: A Tool for Visual Debugging of Rendering Pipelines
203
