
Unsupervised Learning to Understand Patterns of Comorbidity in
633,330 Patients Diagnosed with Osteoarthritis
Marta Pineda-Moncusi
a
, Victoria Y. Strauss
b
, Danielle E. Robinson
c
, Daniel Prieto-Alhambra
d
and Sara Khalid
e
Centre for Statistics in Medicine, Nuffield Department of Orthopaedics,
Rheumatology and Musculoskeletal Sciences (NDORMS), University of Oxford, Oxford, U.K.
Keywords: Cluster Analysis, Electronic Healthcare Records, Osteoarthritis, Comorbidity Pattern, Data Mining.
Abstract: With the advent of big data in healthcare, machine learning has rapidly gained popularity due to its potential
to analyse large volumes of complex data from a variety of sources. Unsupervised learning can be used to
mine data and discover patterns such as sub-groups within large patient populations. However challenges with
implementation in large-scale datasets and interpretability of solutions in a real-world context remain. This
work presents an application of unsupervised clustering techniques for discovering patterns of comorbidities
in a large dataset of osteoarthritis patients with a view to discover interpretable and clinically-meaningful
patterns.
1 INTRODUCTION
Electronic health records present a wealth of routinely
collected patient care information that can be used for
data-driven health research (Binder and Blettner
2015), (Ehrenstein, Kharrazi et al. 2019).
Machine learning has shown potential for analysis
of large volumes of complex, multi-modality health
data, including pattern recognition to unravel sub-
groups of patients within a large population (Cohen,
Vawdrey et al. 2015, Pinedo-Villanueva, Khalid et al.
2018, Windgassen, Moss-Morris et al. 2018, Khalid
and Prieto-Alhambra 2019, Agrawal and Prabakaran
2020). A variety of algorithms, clustering strategies,
and evaluation criteria exist, as these choices are
largely dataset- and application- dependent (Liao, Li
et al. 2016, Grant, McCloskey et al. 2020).
In this paper we demonstrate the application of
unsupervised learning methods for the task of
identifying patterns of comorbidities within a large
cohort of osteoarthritis and methods for evaluating an
optimal clustering solution.
a
https://orcid.org/0000-0003-0567-0137
b
https://orcid.org/0000-0002-5172-512X
c
https://orcid.org/0000-0002-0940-9211
d
https://orcid.org/0000-0002-3950-6346
e
https://orcid.org/0000-0002-2845-5731
1.1 Clinical Context
Osteoarthritis (OA) is a musculoskeletal disorder that
occurs when joint cartilage deteriorates, causing
inflammation, stiffness, reduction of the mobility and
pain on joins. The most commonly affected areas
include knees, hands, hip and spine. OA is considered
the most common type of arthritis and it is estimated
to affect one of ten adults just in the UK (Swain,
Sarmanova et al. 2020). Patients diagnosed with OA
can experience considerable deterioration of their life
quality and severe cases can require a joint
replacement to reduce pain and restore joint function.
In addition to the personal and social implications
of the disease, OA has an important economic impact.
The National Joint Registry estimate that more than
90% of hip, knee and ankles replacements, and 59%
of shoulder replacements in 2019 at the UK were
caused by OA (NJR Report 2020). Moreover, patients
with OA are more likely to have other comorbidities
such as hypertension, dyslipidaemia and back pain
(Swain, Sarmanova et al. 2020).
Pineda-Moncusi, M., Strauss, V., Robinson, D., Prieto-Alhambra, D. and Khalid, S.
Unsupervised Learning to Understand Patterns of Comorbidity in 633,330 Patients Diagnosed with Osteoarthritis.
DOI: 10.5220/0010833500003123
In Proceedings of the 15th International Joint Conference on Biomedical Engineering Systems and Technologies (BIOSTEC 2022) - Volume 3: BIOINFORMATICS, pages 121-129
ISBN: 978-989-758-552-4; ISSN: 2184-4305
Copyright
c
2022 by SCITEPRESS – Science and Technology Publications, Lda. All rights reserved
121

The study of comorbidity patterns in OA patients
at the time of OA diagnosis can help to identify sub-
groups of patients e.g., individuals who might require
additional care. This can in turn aid patient care
decision-making and healthcare resource allocation.
1.2 Contribution in This Paper
Unsupervised machine learning methods such as
cluster analysis are well-suited to the problem of
patient sub-group identification (Pinedo-Villanueva,
Khalid et al. 2018, Violan, Roso-Llorach et al. 2018,
Grant, McCloskey et al. 2020, Hansen, Angquist et al.
2020, Wartelle, Mourad-Chehade et al. 2021).
In this work, we demonstrated the application of
cluster analysis methods to a large routinely collected
dataset representative of patients diagnosed with OA
to unravel patterns of OA comorbidities.
Although cluster analysis methods are widely
known, their use for detecting comorbidity patterns in
a large and representative database of OA patients is
presented for the first time in this work, and we
describe key methodological challenges in
implementing cluster analysis with a large sample
size using an open-source software.
2 METHODS
2.1 SIDIAP Database
The Information System for Research in Primary
Care (SIDIAP) is a healthcare database that contains
de-identified patients records from more than 370
primary care teams in Catalonia (Spain), covering
approximately 80% of the Catalan population
(https://www.sidiap.org/).
2.2 Data
Participants aged ≥18 years with at least one
physician-recorded diagnosis of OA for hip, knee,
ankle/foot, wrist/hand, or site recorded as
‘unspecified’ from 1
st
of January 2006 to 31
st
of June
2020 in SIDIAP database were included in the study
cohort. Incident cases i.e., first-ever diagnoses of OA
cases were identified, and individuals were followed-
up from the first diagnosis date (index date).
Patients with data recorded for less than a year
before index date were excluded. Exclusion criteria
also included any record of specific non-OA
diagnosis (soft-tissue disorders, other bone/cartilage
diseases) at the same joint in the 12 months before or
after the recorded OA/joint pain consultation.
For the OA cohort, a total of 58 comorbidities of
OA, identified by clinical experts and literature, were
available in the dataset. Patient characteristics
included socio-demographics, medical history,
clinical procedures, laboratory tests, and treatments.
2.3 Pre-processing
Prevalence of the 58 OA comorbidities was
measured. Comorbidities with less than 1%
prevalence in the dataset were excluded. Highly
correlated variables were identified using Pearson
correlation: if a pair of comorbidities had a
correlation coefficient > ±0.6, clinical expert opinion
was used to consolidate the two comorbidities.
2.4 Cluster Analysis
Cluster analysis was used to split the dataset based on
patterns of comorbidities and identify sub-groups of
individuals with similar comorbidities.
The choice of clustering technique can be guided
by the nature of data (e.g., categorical or continuous
distribution) and the goal of the clustering task.
Hard clustering may be preferred where it is desirable
to assign each individual to a single group (non-
overlapping clusters). Conversely, soft clusters
generate cluster membership probabilities for each
individual, such that an individual may have
membership in more than one cluster (overlapping-
clusters).
2.4.1 K-means
K-means is one the most popular hard clustering
approaches, perhaps for being one of the simplest and
less computational demanding. Ideally, it is meant for
continuous data, but it can be applied to binary
variables not highly correlated (Henry, Dymnicki et
al. 2015).
In k-means we must pre-specify the desired
number of clusters (k). Then, k randomly selected
points from the d-dimensional space are assigned to
be the cluster centroids (in our case, k random
individuals became centroids). The distance between
each individual and the centroids is computed, and
each individual is assigned with its closest centroid.
After that, clusters centroids are re-calculated based
on the values within each group, and individuals are
re-allocated to the new closest centroid.
Re-calculation and re-allocation steps are repeated
until position of cluster centroids stops changing.
Since k-means is sensitive to initial random
selection of centroids, the obtained solution might
become trapped in a local minimum. To prevent this
BIOINFORMATICS 2022 - 13th International Conference on Bioinformatics Models, Methods and Algorithms
122
limitation, the algorithm should be repeated with
random initialisation and the results pooled.
Cluster Evaluation in K-means
The choice of the optimal number of clusters (𝑘
) can
be subjective, but we can use a set of internal and
external evaluation criteria to assist us in the decision.
Additionally, both evaluations can provide us a better
understanding of the performance of the cluster
algorithm, and the existing grouping behaviour of the
data.
The internal evaluation aims to find the solution
of k clusters that maximizes the homogeneity of
individuals within a cluster, while enhances the
heterogeneity between different clusters. The
simplest criteria to evaluate this is based on
measuring the variance or scatter within a cluster: the
within-cluster sum of squares (WCSS).
𝑊𝐶𝑆𝑆 Σ
Σ
∈
Σ
𝑥
𝑥̅
(1)
where S
k
is the subset of individuals assigned in
the k
th
cluster, x
̅
represents the cluster mean, and k is
the candidate number of clusters, k = 1:K. K is the
maximum numbers of clusters considered.
Other methods that are well described in the literature
and are frequently used are Calinski-Harabasz
(Caliński and Harabasz 1974), Gap (Tibshirani,
Walther et al. 2001), and Silhouette (Rousseeuw
1987). The 𝑘
is the k solution where all or most of the
criteria concur, but when the results are not clear, the
best is to select few models and assess them through
an external and clinical evaluation.
The external evaluation uses independent
variables (i.e., external, not included in the
clusterization, but related to cluster features) to
describe the cluster solutions, and therefore externally
validating it. It can be especially useful when there is
no clear consensus of 𝑘
using the internal evaluation.
In our example, we have included age (< 50 years,
between 50 and 70 years, and > 70 years), index of
deprivation (rural areas, socioeconomic status > 3),
and current smoking status.
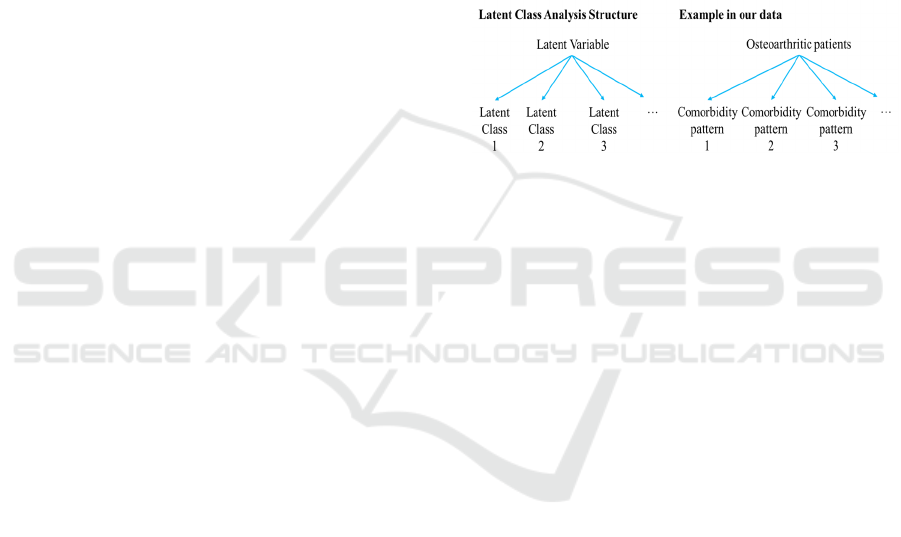
2.4.2 Latent Class Analysis
Latent Class Analysis (LCA) is a type of soft
clustering that explains the heterogeneity between
individuals regarding a particular compilation of
measured items. LCA is a finite mixture model:
instead of measuring the distance between
individuals, LCA uses a mix of distributions to
determine the most likely model that describes the
heterogeneity of the data as a finite number of groups
(latent classes) (figure 1). In other words, it produces
an estimate of how likely is for an individual to
belong to a cluster by summarizing their patterns of
characteristics into a pre-specified number of latent
classes.
In fact, the larger number of features involved in
the analysis, the higher number of patterns can be
found in the data (the increment is exponential),
which increases the difficulty of the results
interpretation. But LCA can reduce the total number
of possible patterns by compressing them into
subsets, showing us the most prevalent of them at the
cost of losing certain amount of specificity.
Nonetheless, the provided patterns will be more
comprehensible and practical while still
parsimonious.
Figure 1: Structure of latent class analysis and application
in our data. A latent variable can be represented by latent
classes (i.e., groups/subgroups of the latent variable that
cannot be measured). In our example, we want to represent
patients with osteoarthritis into groups according to their
combination of comorbidities (i.e., patterns).
LCA was originally designed for discrete
variables, which is the case of the assessed variables
presented in this work, but there is an extension for
dealing with longitudinal data (Jung and Wickrama
2008). As with k-means, LCA requires the
introduction of the expected number of k classes, but
in this case we can statistically determine the
performance of the proposed models in representing
the studied population.
Cluster Evaluation in Latent Class Analysis
The 𝑘
in LCA is obtained by comparing the
performance of the models from k = 1 or 2, to a
reasonable number of subgroups. For example, we
will analyse up to k = 10. We can calculate different
criteria methods to compare the models, such as the
likelihood and its logarithm, the entropy, entropy R
2
,
the Akaike's Information Criteria (AIC), Bozdogan's
Criterion (CAIC), the Bayesian Information Criteria
(BIC, as well known as Schwartz's Bayesian
Criterion) and the Akaike's Bayesian information
criterion (ABIC).
In this paper, we have used the entropy R2, the
ABIC, BIC, CAIC criteria methods and log-
likelihood ratio.
Unsupervised Learning to Understand Patterns of Comorbidity in 633,330 Patients Diagnosed with Osteoarthritis
123

Entropy in cluster analysis explains the amount of
disorder (dispersion) in the data, and points how good
the prediction of the cluster membership can be. The
score ranges from 0 to 1, where low values represent
less different characteristics/patterns; and high
numbers represent greater disorder, where is more
likely for the model to be distributed correctly across
different groups. A common desired threshold to set
a good entropy is > 0.7. Boeschoten et al. (2017) fully
report the methodology to calculate the entropy R
2
in
LCA models (Boeschoten, Oberski et al. 2017).
The AIC criteria measures of the goodness of fit
of the proposed model derived from frequentist
probability (Akaike 1987), while BIC is derived from
Bayesian probability (Schwarz 1978). Compared to
BIC, complex models are less penalized in AIC. The
CAIC is an extension of the AIC procedure with a
stronger penalty for overparametrized models
(Bozdogan 1987), and ABIC is a sample-sized
adjusted BIC (Sclove 1987). In all these parameters,
the lowest value reflects the best model. In mixed
models, we can measure these parameters as follows:
𝐴𝐼𝐶 2Λ 2Φ (2)
𝐶𝐴𝐼𝐶 2Λ Φ
1𝑙𝑛𝑁
(3)
𝐵𝐼𝐶 2Λ Φln𝑁 (4)
𝐴𝐵𝐼𝐶 2Λ ln
(5)
Where Λ
is the maximum log-likelihood and Φ is
the total number of estimated parameters (degrees of
freedom) of the model, and N is the number of
participants in the subset.
Ideally, the optimal LCA model will be the one
with the lowest value obtained in CAIC, BIC and
ABIC criteria, and the highest entropy R
2
, but it might
happen that criteria values keep decreasing and
entropy increasing. Like the strategy of selecting the
𝑘
in K-means, we choose few models for a manual
evaluation to unravel the underlying patterns of
comorbidities from each cluster by observing the
posterior probabilities (i.e., probability from patients
to be allocated to one cluster).
2.5 Software Used
All the analysis were conducted using R 4.1.1 for
Windows.
3 RESULTS
We identified 633,330 patients diagnosed with OA in
SIDIAP database, and from the total 58
comorbidities, only 36 were present in more than 1%
of the population (Table 1). No correlations equal or
above 0.6 were found.
Table 1: Prevalence of OA patients’ comorbidities. In bold:
comorbidities excluded in the analysis (<1.0% of
prevalence). Abbreviations: BHP, benign prostate
hypertrophy; COPD, chronic obstructive pulmonary
disease; GERD, gastroesophageal reflux disease; IBD,
inflammatory bowel disease; PVD, peripheral vascular
disease; SLE, Systemic lupus erythematosus.
Comorbidities
(
total = 58
)
N=633330
Anaemia 48281
(
7.62%
)
Ank
y
losin
g
s
p
ond
y
litis 550
(
0.09%
)
Anxiet
y
80554 (12.7%)
Arrythmia 32605 (5.15%)
Asthma 15960 (2.52%)
Autism 24
(
0.00%
)
Back/neck pain 212986 (33.6%)
BHP 33560
(
5.30%
)
Cateract 0
(
0%
)
Chronic heart disease 34300 (5.42%)
Chronic heart failure 15850 (2.50%)
Sinusitis 2675
(
0.42%
)
Chronic Kidney disease 36098 (5.70%)
COPD 23961 (3.78%)
Vitamin D deficienc
y
7569 (1.20%)
Dementia 12467
(
1.97%
)
De
p
ression 48757
(
7.70%
)
Diabetes 57498 (9.08%)
Hyperlipidemia 11602 (1.83%)
Eczema 21924 (3.46%)
E
p
ile
p
s
y
2671
(
0.42%
)
Fatigue 16852 (2.66%)
Fibrom
y
al
g
ia 10008
(
1.58%
)
Gall
b
ladde
r
stone
21346 (3.37%)
GERD
6474 (1.02%)
Gout 12388 (1.96%)
Hearing impairment 41563 (6.56%)
He
p
atitis 455
(
0.07%
)
H
yp
oth
y
roidis
m
22153 (3.50%)
HIV/AIDs
252 (0.04%)
H
yp
ertension
149092 (23.5%)
H
yp
erth
y
roidism 4789
(
0.76%
)
IBD 14810
(
2.34%
)
Insomnia 44278 (6.99%)
Irritable bowel syndrome 4520 (0.71%)
Leukaemia 915
(
0.14%
)
Liver 2336 (0.37%)
L
y
m
p
homa 948
(
0.15%
)
Migrane 10401 (1.64%)
Multiple sclerosis 248 (0.04%)
Obesity 80387 (12.7%)
Osteoporosis 45261 (7.15%)
Other vessel diseases 9621 (1.52%)
BIOINFORMATICS 2022 - 13th International Conference on Bioinformatics Models, Methods and Algorithms
124
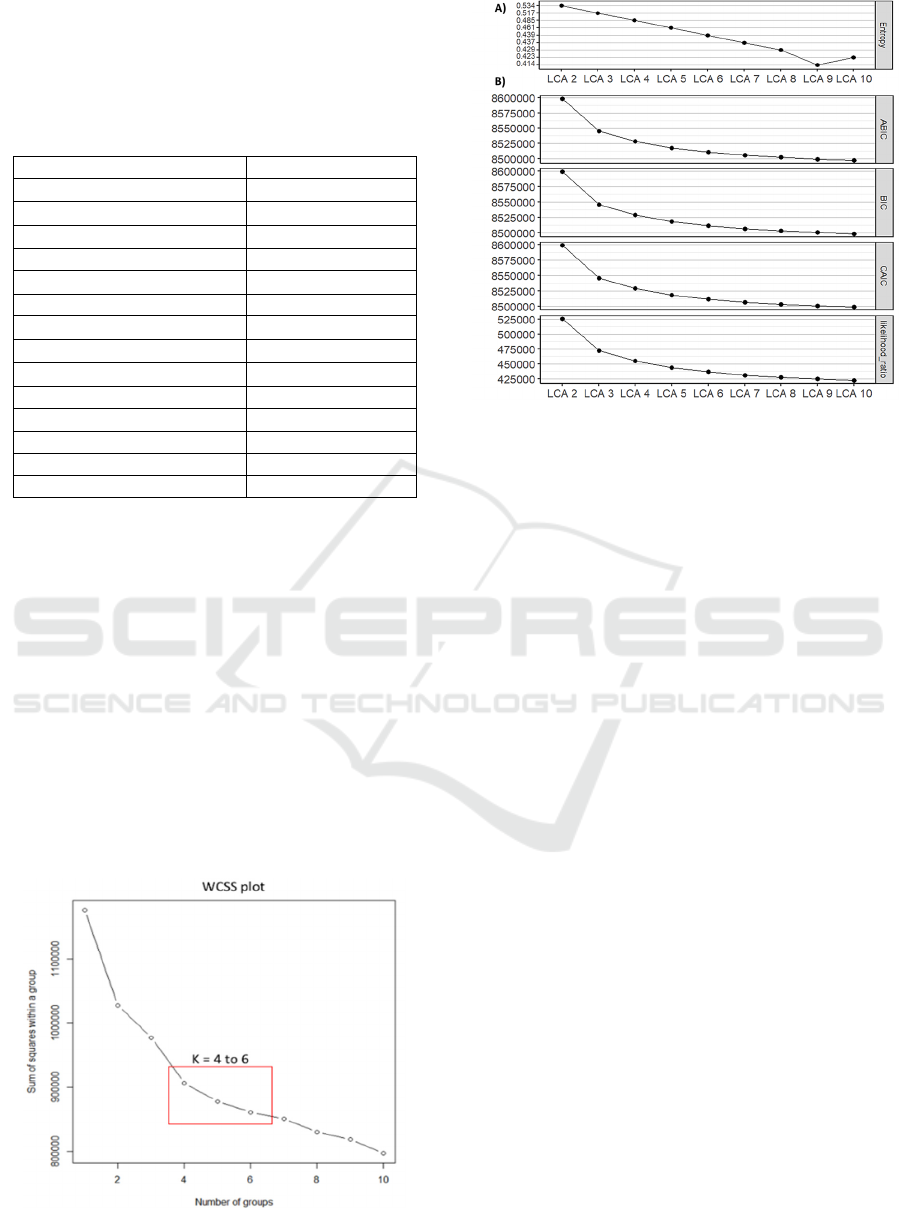
Table 1: Prevalence of OA patients’ comorbidities. In bold:
comorbidities excluded in the analysis (<1.0% of
prevalence). Abbreviations: BHP, benign prostate
hypertrophy; COPD, chronic obstructive pulmonary
disease; GERD, gastroesophageal reflux disease; IBD,
inflammatory bowel disease; PVD, peripheral vascular
disease; SLE, Systemic lupus erythematosus (cont).
Parkinson 3872 (0.61%)
PVD 2773 (0.44%)
Polymyagia rheumatica 3408 (0.54%)
Psoriasis 8179 (1.29%)
Psoriatic arthritis 580 (0.09%)
Rheumatoid arthritis 3250 (0.51%)
Schizo
p
hrenia 985 (0.16%)
Allergy 80449 (12.7%)
Sjogen’s syndrome 2070 (0.33%)
SLE 504 (0.08%)
Solid malignancy 23946 (3.78%)
Stroke 20986 (3.31%)
Substance abuse 40423
(
6.38%
)
Thrombotic diseases 823 (0.13%)
Tuberculosis 1321 (0.21%)
3.1 Internal Evaluation
Figure 2 shows the results for internal validation of k-
means using WCSS, and figure 3 for LCA using
Entropy R
2
, goodness of fit tests and likelihood
values. Other metrics (e.g., Gap, Silhouette and
Calinski-Harabasz) were unable to converge given
the sample size. Running times for LCA were larger,
especially for higher numbers of k (up to three weeks
when k = 10 in LCA vs. one day in K-means). WCSS
did not change by more than ±1 std after k=6, and
similar effect was observed in curves from internal
validation of LCA analysis. Therefore, to determine
an optimal number of clusters, cluster visualisation
was performed for k=4, 5, and 6 in both methods.
Figure 2: Representation of the Within-Cluster-Sum-of-
Squares (WCSS) for each number of k.
Figure 3: Representation of A) entropy R
2
values and, B)
goodness of fit tests and likelihood ratio for each LCA when
k ranges from 1 to 10.
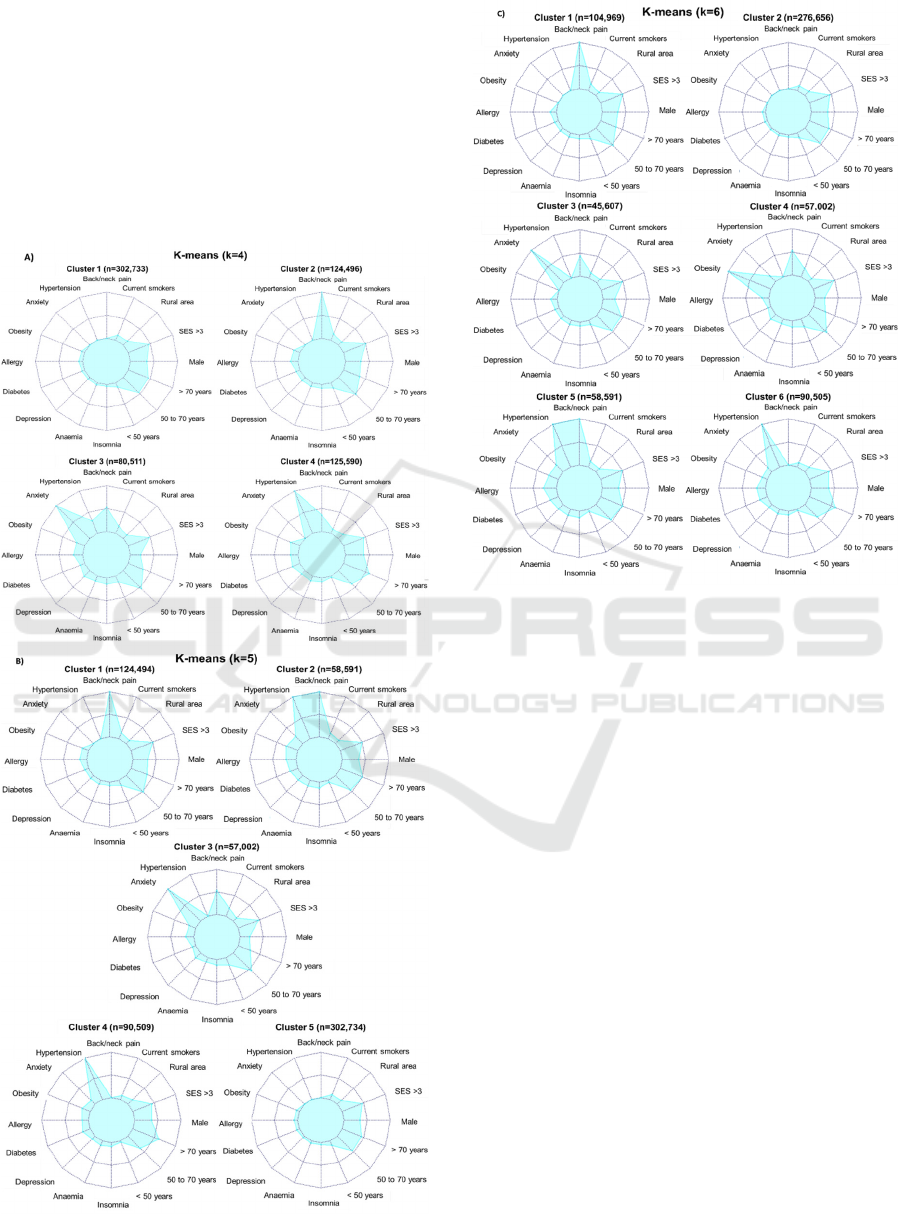
When using k = 4, k-means (figure 4A) show a
generally healthy cluster, a back/neck pain cluster, an
anxiety cluster with half of the patients experiencing
back/neck pain, and a hypertension cluster with
around forty percent of patients experiencing
back/neck pain. In LCA (figure 5A), first 2 clusters
present the same main comorbidities: relatively
healthy group and back/neck pain. Back/neck pain
cluster is also linked with mental disorders (anxiety
and depression), migraine, insomnia, and/or other
pain conditions (fatigue and fibromyalgia). Third and
fourth clusters present a main prevalence of
hypertension and back/neck pain. However, third
cluster is linked to more comorbidities, including
mental disorders, insomnia, anaemia, diabetes, and/or
set of different cardiovascular disorders (arrythmia,
stroke, chronic heart disease and chronic heart
failure), among others.
When using k = 5, k-means (figure 4B) distinguish
patients in back/neck pain, back/neck pain plus
hypertension, anxiety with half of them experiencing
back/neck pain, hypertension, and healthy clusters.
LCA (figure 5B) distinguish patients among
hypertension and back/neck pain plus many other
comorbidities; hypertension and back/neck pain, but
less presence of other comorbidities; back/neck pain,
combined with mental disorders and/or allergy;
hypertension; and healthy clusters.
When using k = 6, k-means (figure 4C) stratify
patients into back/neck pain, healthy, anxiety,
obesity, hypertension and back/neck pain, and
hypertension clusters. LCA results (figure 5C) show:
a cluster with prevalence of hypertension followed by
Unsupervised Learning to Understand Patterns of Comorbidity in 633,330 Patients Diagnosed with Osteoarthritis
125
back/neck pain, obesity and diabetes; second cluster
with hypertension followed by back/neck pain, plus
different cardiovascular disorders, anaemia and/or
diabetes; third cluster with back/neck pain followed
by hypertension, plus allergy, mental disorders and/or
obesity; forth cluster with back/neck pain and low
presence of other comorbidities; fifth cluster with
hypertension followed by back/neck pain, and low
occurrence of other comorbidities; and last, a
generally healthy cluster.
Figure 4: Distribution of comorbidity patterns within a
cluster using K-means: A) k = 4, B) k = 5, and C) k=6.
Number of patients in each cluster is described. External
variables not included in the cluster algorithm: smoke, rural
area, SES, male and age groups. Abbreviations: SES, urban
socioeconomic status where >3 are more deprived areas.
3.2 External Evaluation
In k-means graphs, we included the external features
along with the 10 most prevalent comorbidities
(figure 4). In k = 4, clusters 1 and 4 are older patients.
These clusters were annoted as healthy and
hypertension groups, respectively. Cluster 3, the
anxiety group, has the lower proportion of men.
When k = 5, cluster 4 had the oldest population,
followed by cluster 5 and 2 (identified as
hypertension, healthy and hypertension plus
back/neck pain, respectively). Cluster 3, once again
anxiety group, had the lowest proportion of males.
When k = 6, clusters 3 and 4 (anxiety and obesity,
respectively) had lower male patients, and clusters 1
and 4 (back/neck pain and obesity, respectively) tend
to have younger patients.
BIOINFORMATICS 2022 - 13th International Conference on Bioinformatics Models, Methods and Algorithms
126
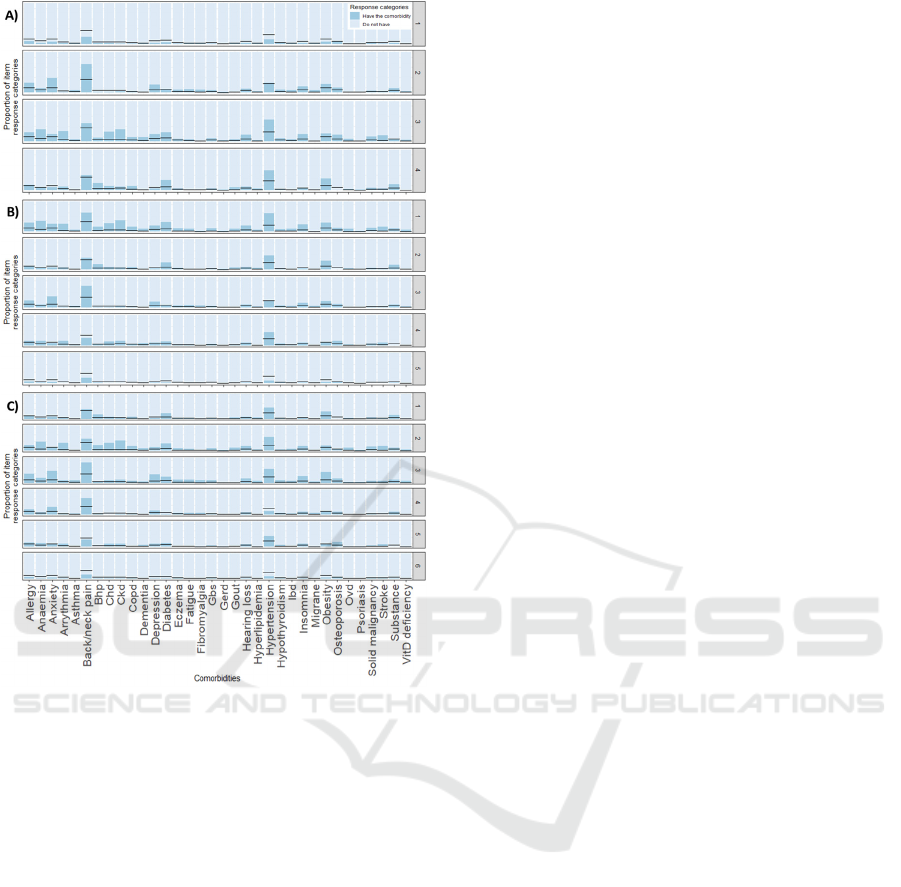
Figure 5: Distribution of comorbidity patterns within a
cluster using LCA: A) k = 4, B) k = 5, and C) k=6.
Black horizontal lines represent the prevalence of the
comorbidity before the clusterization. Abbreviations: Bhp,
benign prostate hypertrophy; Chd, chronic heart disease;
Ckd, chronic kidney disease; Copd, chronic obstructive
pulmonary disease; Gbs, gall bladder stone; Gerd,
gastroesophageal reflux disease; Ibd, inflammatory bowel
disease; Ovd, other vessel diseases; Substance, substance
abuse.
4 DISCUSSION
Cluster analysis is a type of unsupervised learning
methods and therefore, we cannot test in absolute
terms whether the number of groups and the obtained
grouping is accurate or the most optimal. The general
practice is to include more than one method and to
compare the subsequent solutions.
In terms of the limitations of each cluster method,
we have observed that large datasets imply
difficulties in calculating the internal validation
methods based on distance matrix in K-means, and
larger running times in LCA. In terms of
interpretability, results from k-means are easier to
interpret than LCA. Distinct clusters are assigned to
patients, and therefore, highly distinguishable groups
are created. Despite this, soft classification by LCA
allows us to detect more complex patterns that
possibly represents better the behaviour and
interaction of comorbidities among the OA patients.
Comparing the composition of the different
clusters across both methods, similar clusters can be
found: a healthy group, patients with high prevalence
of back/neck pain and hypertension (alone or
combined), mental disorders (i.e., anxiety and/or
depression), etc. Observing the evolution of clusters
when incrementing the k, higher number of groups in
k-means seems to enhance patients’ differences. But
in LCA, clustering patients in 6 different groups
obscures the interpretability rather than show more
hidden patterns. In this method, our proposed
optimum number of stratification is 5, where we can
distinguish a cluster of patients with high complex
comorbidities profiles (cluster 1: hypertension and
back/neck pain plus many other comorbidities) from
a cluster of patients with hypertension and back/neck
pain but less prevalence of other complications
(cluster 2), and from patients with not only back/neck
pain but also mental disorders (cluster 3).
Simultaneous comorbidities exacerbate pain and
diminish the physical function (Calders and Van
Ginckel 2018). Differentiation of individuals from
cluster 1 and 2 leaded us to identify a sub-group of
patients that potentially require further supervision.
To confirm that, next steps will include an evaluation
of the obtained clusters with an external outcome
such as 10-years death or a change in a quality of life
index.
Another limitation to note is that this work
included all OA patients regardless of site. The
location of the affected joint (e.g., OA in knee or hip)
might have a different impact in the clinical profile of
OA patients (and therefore their respective
comorbidity patterns). Thus, examination of site-
specific OA cohorts, such as knee OA, is part of the
on ongoing work.
5 CONCLUSIONS
In this work, patterns of co-morbidities within a large
OA population were examined and sub-groups
identified. We have shown some of the challenges
and strategies of unsupervised machine learning
applied to a large dataset from a representative
primary care database, including lack of convergence
of several methods in K-means and the alternatives to
Unsupervised Learning to Understand Patterns of Comorbidity in 633,330 Patients Diagnosed with Osteoarthritis
127

overcome it, large running times in LCA, and the
complexity of interpreting the results.
ACKNOWLEDGEMENTS
This research was founded by the Foundation for
Research in Rheumatology (FOREUM).
Further acknowledgements were removed for
review purposes.
DISCLAIMER
This paper presents independent research funded by
the Foundation for Research in Rheumatology
(FOREUM) that currently is ongoing. Views
expressed are those of the author(s) and not necessary
those of all partners involved in FOREUM study.
REFERENCES
Agrawal, R. and S. Prabakaran (2020). "Big data in digital
healthcare: lessons learnt and recommendations for
general practice." Heredity 124(4): 525-534.
Akaike, H. (1987). "Factor analysis and AIC."
Psychometrika 52(3): 317-332.
Binder, H. and M. Blettner (2015). "Big data in medical
science--a biostatistical view." Dtsch Arztebl Int
112(9): 137-142.
Boeschoten, L., D. Oberski and T. d. Waal (2017).
"Estimating Classification Errors Under Edit
Restrictions in Composite Survey-Register Data Using
Multiple Imputation Latent Class Modelling (MILC)."
Journal of Official Statistics 33(4): 921-962.
Bozdogan, H. (1987). "Model selection and Akaike's
Information Criterion (AIC): The general theory and its
analytical extensions." Psychometrika 52(3): 345-370.
Calders, P. and A. Van Ginckel (2018). "Presence of
comorbidities and prognosis of clinical symptoms in
knee and/or hip osteoarthritis: A systematic review and
meta-analysis." Semin Arthritis Rheum 47(6): 805-813.
Caliński, T. and J. Harabasz (1974). "A dendrite method for
cluster analysis." Communications in Statistics 3(1):1-
27.
Cohen, B., D. K. Vawdrey, J. Liu, D. Caplan, E. Y. Furuya,
F. W. Mis and E. Larson (2015). "Challenges
Associated with Using Large Data Sets for Quality
Assessment and Research in Clinical Settings." Policy
Polit Nurs Pract 16(3-4): 117-124.
Ehrenstein, V., H. Kharrazi, H. Lehmann and C. O. Taylor
(2019). Chapter 4 Obtaining Data From Electronic
Health Records. Tools and Technologies for Registry
Interoperability, Registries for Evaluating Patient
Outcomes: A User’s Guide, 3rd Edition, Addendum 2
[Internet]. R. E. Gliklich, M. B. Leavy and N. A.
Dreyer, Rockville (MD): Agency for Healthcare
Research and Quality (US).
Grant, R. W., J. McCloskey, M. Hatfield, C. Uratsu, J. D.
Ralston, E. Bayliss and C. J. Kennedy (2020). "Use of
Latent Class Analysis and k-Means Clustering to
Identify Complex Patient Profiles." JAMA Netw Open
3(12): e2029068.
Hansen, N. S., L. Angquist, P. Lange and R. Jacobsen
(2020). "Comorbidity Clusters and Healthcare Use in
Individuals With COPD." Respir Care 65(8): 1120-
1127.
Henry, D., A. B. Dymnicki, N. Mohatt, J. Allen and J. G.
Kelly (2015). "Clustering Methods with Qualitative
Data: a Mixed-Methods Approach for Prevention
Research with Small Samples." Prev Sci 16(7): 1007-
1016.
Jung, T. and K. A. S. Wickrama (2008). "An Introduction
to Latent Class Growth Analysis and Growth Mixture
Modeling." Social and Personality Psychology
Compass 2(1): 302-317.
Khalid, S. and D. Prieto-Alhambra (2019). "Machine
Learning for Feature Selection and Cluster Analysis in
Drug Utilisation Research." Current Epidemiology
Reports 6(3): 364-372.
Liao, M., Y. Li, F. Kianifard, E. Obi and S. Arcona (2016).
"Cluster analysis and its application to healthcare
claims data: a study of end-stage renal disease patients
who initiated hemodialysis." BMC Nephrol 17: 25.
Pinedo-Villanueva, R., S. Khalid, V. Wylde, R.
Gooberman-Hill, A. Soni and A. Judge (2018).
"Identifying individuals with chronic pain after knee
replacement: a population-cohort, cluster-analysis of
Oxford knee scores in 128,145 patients from the
English National Health Service." BMC Musculoskelet
Disord 19(1): 354.
NJR Report. (2020). "National Joint Registry 17th Annual
Report 2020.", from https://reports.njrcentre.
org.uk/downloads.
Rousseeuw, P. J. (1987). "Silhouettes: A graphical aid to
the interpretation and validation of cluster analysis."
Journal of Computational and Applied Mathematics 20:
53-65.
Schwarz, G. (1978). "Estimating the dimension of a
model." The annals of statistics: 461-464.
Sclove, S. L. (1987). "Application of model-selection
criteria to some problems in multivariate analysis."
Psychometrika 52(3): 333-343.
Swain, S., A. Sarmanova, C. Coupland, M. Doherty and W.
Zhang (2020). "Comorbidities in Osteoarthritis: A
Systematic Review and Meta-Analysis of
Observational Studies." Arthritis Care Res (Hoboken)
72(7): 991-1000.
Swain, S., A. Sarmanova, C. Mallen, C. F. Kuo, C.
Coupland, M. Doherty and W. Zhang (2020). "Trends
in incidence and prevalence of osteoarthritis in the
United Kingdom: findings from the Clinical Practice
Research Datalink (CPRD)." Osteoarthritis Cartilage
28(6): 792-801.
BIOINFORMATICS 2022 - 13th International Conference on Bioinformatics Models, Methods and Algorithms
128

Tibshirani, R., G. Walther and T. Hastie (2001).
"Estimating the number of clusters in a data set via the
gap statistic." Journal of the Royal Statistical Society:
Series B (Statistical Methodology) 63(2): 411-423.
Violan, C., A. Roso-Llorach, Q. Foguet-Boreu, M.
Guisado-Clavero, M. Pons-Vigues, E. Pujol-Ribera and
J. M. Valderas (2018). "Multimorbidity patterns with
K-means nonhierarchical cluster analysis." BMC Fam
Pract 19(1): 108.
Wartelle, A., F. Mourad-Chehade, F. Yalaoui, J. Chrusciel,
D. Laplanche and S. Sanchez (2021). "Clustering of a
Health Dataset Using Diagnosis Co-Occurrences."
Applied Sciences 11(5): 2373.
Windgassen, S., R. Moss-Morris, K. Goldsmith and T.
Chalder (2018). "The importance of cluster analysis for
enhancing
clinical practice: an example from irritable
bowel syndrome." Journal of Mental Health 27(2): 94-96.
Unsupervised Learning to Understand Patterns of Comorbidity in 633,330 Patients Diagnosed with Osteoarthritis
129
