
Training Machine Learning Models to Detect Group Differences in
Neurophysiological Data using Recurrence Quantification Analysis
based Features
Gianluca Guglielmo
a
, Travis J. Wiltshire
b
and Max Louwerse
c
Department of Cognitive Science and Artificial Intelligence, Tilburg University, Warandelaan 2, Tilburg, The Netherlands
Keywords: Mathematical Skills, Cognitive Task, Machine Learning, Complex Systems, Recurrence Quantification
Analysis.
Abstract: Physiological data have shown to be useful in tracking and differentiating cognitive processes in a variety of
experimental tasks, such as numerical skills and arithmetic tasks. Numerical skills are critical because they
are strong predictors of levels of ability in cognitive domains such as literacy, attention, and understanding
contexts of risk and uncertainty. In this work, we examined frontal and parietal electroencephalogram signals
recorded from 36 healthy participants performing a mental arithmetic task. From each signal, six RQA-based
features (Recurrence Rate, Determinism, Laminarity, Entropy, Maximum Diagonal Line Length and, Average
Diagonal Line Length) were extracted and used for classification purposes to discriminate between
participants performing proficiently and participants performing poorly. The results showed that the three
classifiers implemented provided an accuracy above 0.85 on 5-fold cross-validation, suggesting that such
features are effective in detecting performance independently from the specific classifiers used. Compared to
other successful methods, RQA-based features have the potential to provide insights into the nature of the
physiological dynamics and the patterns that differentiate levels of proficiency in cognitive tasks.
1 INTRODUCTION
Numerical skills have shown to be strong predictors
of attention, literacy, and decision-making (Merkley
& Ansari, 2016), as well as of socioeconomic status
and planning skills (Fernandez & Liu, 2019).
Therefore, for being able to identify an individual’s
performance on numerical skills – and consequently
other cognitive skills and abilities – it is important to
reliably track processes connected to the development
of numerical skills and their related performance.
Tracking such processes might allow us to detect
when an intervention is needed, helping individuals
who have difficulties in tackling numerical problems,
as well as improving socio-economic status,
unemployment, and other skills connected to
numeracy (Fernandez & Liu, 2019).
Past research has shown that performance in
several skill domains can be effectively tracked using
physiological signals such as electrocardiograms,
a
https://orcid.org/0000-0002-3581-1319
b
https://orcid.org/0000-0001-7630-2695
c
https://orcid.org/0000-0003-0328-7070
galvanic skin response, and electroencephalograms
(Sharma et al., 2020). Processes involved in
mathematical tasks can be effectively monitored
using electroencephalograms (EEG; Río et al., 2019).
EEG tracks the electrical activity of specific
electrodes placed on the subject's scalp, the signal is
used to extract features using linear methods such as
the time-frequency distribution, the fast Fourier
transform, and the autoregressive method (Al-
Fahoum & Al-Fraihat, 2014). Furthermore, EEG
signals have been used for classification tasks using
deep learning models such as long short-term
memory neural networks (Ganguly et al., 2020). Deep
learning models overall yield high accuracy but tend
to not provide insights into the nature of the signal
and the patterns differentiating groups.
In the current study recurrence quantification
analysis (RQA) was used to extract features from the
EEG signal of participants who either performed well
or poorly on a mental arithmetic task. RQA is robust
428
Guglielmo, G., Wiltshire, T. and Louwerse, M.
Training Machine Learning Models to Detect Group Differences in Neurophysiological Data using Recurrence Quantification Analysis based Features.
DOI: 10.5220/0010832200003116
In Proceedings of the 14th International Conference on Agents and Artificial Intelligence (ICAART 2022) - Volume 3, pages 428-435
ISBN: 978-989-758-547-0; ISSN: 2184-433X
Copyright
c
2022 by SCITEPRESS – Science and Technology Publications, Lda. All rights reserved

to noise and has the added advantage that it is based
on recurrences and self-similarity. Consequently, it
does not require data transformations or mathematical
assumptions (Zbilut, Thomasson, & Webber 2002).
Using RQA, instead of the time-frequency
distribution, fast Fourier transform, autoregressive
method, or long short-term memory neural networks,
might not only result in extracting effective features
for machine learning purposes but also in obtaining
insights about the nature of the signal itself and the
patterns it contains.
RQA-based features have shown to be effective
for hypothesis testing purposes and for training
machine learning models (Hou et al., 2019; Lyby et
al., 2019). For example, RQA-based features,
combined with machine learning models, have been
used successfully to detect drowsiness and epileptic
seizures (Gruszczyńska et al., 2019; Shabani, Mikaili,
& Noori, 2016). Taken together, the evidence
supports the idea that RQA might effectively capture
the complexity of biological processes, which are
often not linear (Zbilut & Weber 2008). Nevertheless,
RQA-based features, combined with machine
learning, have so far not been used yet to detect
differences in performance on a cognitive task.
The current work aims to explore the possibility
of using RQA-based features to track performance in
cognitive skills within the domain of numeracy. The
hypothesis is that the recurrent structures in the EEG
signals, reflected by the RQA-based features, will
differ between participants performing proficiently
and participants performing poorly in the task. We
will make use of the RQA-based features extracted to
perform a binary classification task to discriminate
proficient and non-proficient participants.
2 BACKGROUND AND THEORY
2.1 Neurophysiology and Numeracy
Mathematical skills are rooted in human capabilities
to deal with space, numbers, and time. These skills
are argued to stem from a non-linguistic ability that
appeared during the late Palaeolithic and underwent
development throughout human history (Amalric, &
Dehaene, 2016; Wildgen, 2020).
Evidence from cognitive neuroscience shows that
brain regions involved in mathematical problems
such as the bilateral intraparietal and prefrontal areas
are present not only in humans but also in non-human
animals, such as monkeys (Cantlon & Brannon,
2007). Similar brain areas seem to be activated by
mathematical tasks belonging to different domains
such as topology, analysis, algebra, and geometry.
These brain areas include the bilateral inferior
temporal regions, bilateral intraparietal sulci,
cerebellum, and several regions of the prefrontal
cortex (dorsolateral, bilateral, superior, and mesial)
(Amalric, & Dehaene, 2016). Different mathematical
tasks involve high activity in the prefrontal and
parietal areas during their execution. Therefore, EEG
signals obtained from these areas are likely to be of
interest when investigating the levels of mathematical
abilities.
2.2 Recurrence Quantification Analysis
2.2.1 RQA and Its Specifications
Performing RQA requires a phase space
reconstruction (PSR) that is used to unfold the
dynamics of the signal. PSR is based on the setting of
a few parameters, such as the delay and the number
of embedding dimensions.
2.2.2 Phase Space Reconstruction
Phase space reconstruction is needed to define the
temporal evolution and behavior of the signals before
one can proceed with the use of RQA on continuous
data. One method to reconstruct the time-series
behavior in a multidimensional phase-space form is
to use the time-delay embedding (Takens, 1981) that
is based on four main parameters: the delay (τ), the
number of embedding dimensions (D), the radius (r),
and the rescaling norm (Wallot & Leonardi, 2018).
The delay specifies the number of time lags to
shift the copies of the signal, while the number of
embedding dimensions refers to the number of
dimensions (i.e., time-delayed copies) needed to
unfold the higher-dimensional dynamics that
characterize the time-series (Wallot, 2017). The
radius and the rescaling norm refer respectively to the
interval that defines two points as recurrent and to the
phase-space rescaling of the distance matrix. The
choice of the aforementioned parameters depends on
the time-series typology, its characteristics, and the
use of specific methods to obtain the optimal values
when considering the embedding dimensions and the
delay parameters.
The optimal delay value is calculated using the
average mutual information function, which provides
the lag representing the first local minima after which
the average mutual information remains generally
quite constant (Wallot, 2019). The number of
embedding dimensions is defined using the false
nearest-neighbor function, which computes the
Training Machine Learning Models to Detect Group Differences in Neurophysiological Data using Recurrence Quantification Analysis
based Features
429

optimal number of dimensions considering the
number of delays selected. Conversely, the radius and
the norm are chosen according to the level of noise in
the data and the magnitude of the values composing
the time series. Generally, the radius is set between
0.01 and 0.05 while the norm has three possible
options: Euclidian, Supremum, and Manhattan
(Marwan et al., 2007). Most important in setting the
norm, however, is keeping the norm constant when
comparing different time-series (Wallot & Leonardi,
2018).
2.2.3 Recurrence Plot and Features
The parameters listed in the previous sections are
used as input to create the Recurrence Plot (RP;
Figure 2 and 3). The RP provides a visual
presentation of the patterns, repetitions, and dynamics
contained in the time-series under analysis.
The RQA-based features are directly extracted
from the patterns present in the RP. For the current
study we extracted those features also used in
previous studies (Gruszczyńska et al., 2019; Shabani,
Mikaili, & Noori, 2016; Turianikova et al., 2015):
Recurrence Rate (RR): The likelihood of
recurrence of a specific state in the signal.
The recurrence rate is obtained by dividing
the number of recurrent elements,
represented by the points in the plot, by the
RP size.
Determinism (%DET): The percentage of
diagonal recurrent points lying adjacently.
Laminarity (%LAM): The percentage of the
number of recurrent elements arranged
vertically on the RP.
Average Diagonal Line (ADL): The mean
length across all the diagonal lines present in
the RP.
Maximum Diagonal Line (MDL): The length
of the longest diagonal line present in the
RP.
Entropy (ENT): A feature based on the
frequency distribution of the diagonal lines.
The value obtained in this feature is directly
proportional to the complexity of the signal
analyzed. For example, uncorrelated noise
has a low value of ENT.
Since RQA considers self-similarity within a
single time-series, these features concern the points
on one side of the line of identity (the diagonal line
dividing the RP in two). The features extractable from
the RP are not limited to the ones listed above. For
example, other features include, but are not limited to,
trapping time and trend. Webber & Marwan (2015)
provide further information about additional features
and detailed explanations of the RQA equations.
3 METHODS
3.1 Dataset
For our study, we used the publicly available dataset
on Physionet, the “Electroencephalograms during
Mental Arithmetic Task” dataset (Zyma et al., 2019).
This dataset contains 36 healthy participants that
performed a mental arithmetic task for 4 minutes.
According to their performance, Zyma et al.
(2019) assigned the participants to two different
groups: participants who performed well were
assigned to group “G” (standing for good) and those
who performed poorly were assigned to group “B”
(standing for bad). According to the dataset on
Physionet, 10 participants were assigned to group “B”
(M
calculations
= 7 per minute, SD = 3.6) while group “G”
had 26 participants (M
calculations
= 22 per minute, SD =
7.3).
The data were recorded using a 23 EEG channel
system where the recording sites were defined
according to the international 10/20 scheme; each
channel had a 500 Hz sample rate. The signal was
filtered with a low pass filter (45 Hz) and a power
notch filter (50 Hz). The data are artifact-free and
ready for analysis purposes. More information about
the sample and the task can be found in the original
work by Zyma et al. (2019).
3.2 Workflow
The workflow followed in this work is comparable to
the one used in other works that extracted RQA-based
features from physiological signals, and specifically
from EEG signals (Shabani, Mikaili, & Noori, 2016).
In order to proceed with the RQA-based features
extraction, we focused on four electrodes for our
analyses purposes: the F7, Pz, P4, and Fp1. These
electrodes were adopted in a previous study using the
same dataset to train a long short-term memory neural
network and provided the highest accuracy on a
classification task to detect the signal specific to the
arithmetic task (Ganguly et al., 2020). Furthermore,
the use of pre-selected electrodes, instead of all the
ones present on the EEG cap, was successfully
adopted in other studies using RQA-based features
combined with machine learning techniques
(Gruszczyńska et al., 2019).
ICAART 2022 - 14th International Conference on Agents and Artificial Intelligence
430
After having selected the electrodes of interest,
the RQA-based features were extracted to train a
Support Vector Machine (SVM), a Random Forest
(RF), and a Gradient Boosting Classifier (GBC).
Before training the classifiers, we selected the five
most relevant features, using the Extra Trees method
(Sharma, Giri, Granmo, & Goodwin, 2019), and
resolved the class imbalance present in the dataset
using the Synthetic Minority Oversampling
Technique (SMOTE) (Chawla et al., 2002). These
processes were implemented to reduce the likelihood
of overfitting (Ying, 2019).
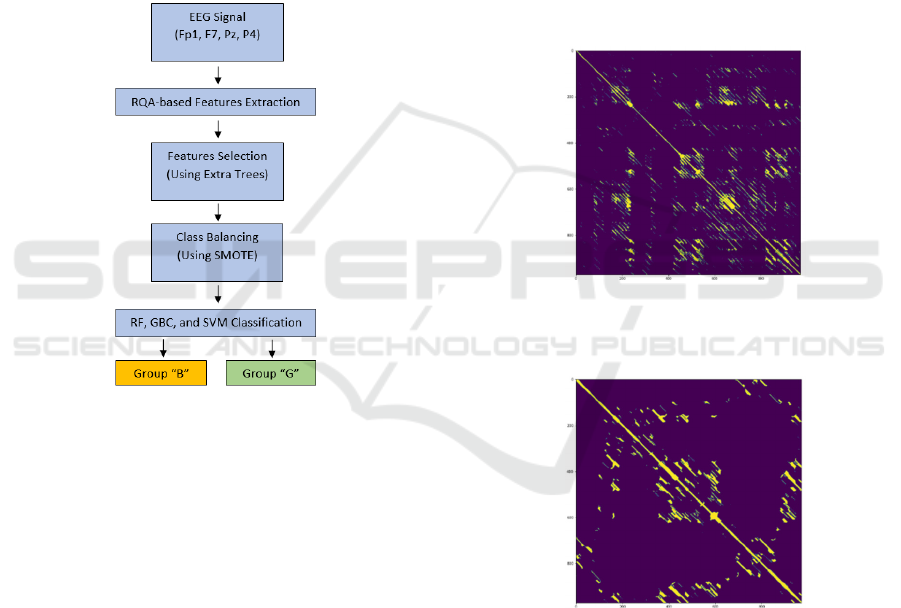
Figure 1 gives the overview of the workflow
followed in this study, which is similar to the one
adopted by Borowska et al. (2018).
Figure 1: An overview of the workflow adopted for this
study.
3.3 RQA-based Features Extraction
Before extracting the RQA-based features, the mutual
average information function and the false nearest-
neighbor function were used to define the optimal
number of dimensional embedding and delays. The
functions were run in R using the Tserieschaos
package (Di Narzo, 2019) and the nonlinearTseries
package (Garcia, 2021). Such functions were applied
to a few subjects across the two groups and to
different electrodes to verify if there was an
approximate constant optimal value across electrodes
and subjects. The signals analyzed had a number of
values for delay generally ranging between 4 and 5,
while the embedding dimensions had a value between
6 and 8. Therefore, the delay value was set to 5 and
the number of embedding dimensions to 7 when
performing RQA on all the data.
These parameters were used to create the RP
together with a radius of 0.05, which is generally used
for physiological data (Wallot, 2017), and Supremum
as norm, which is the default parameter in the
Pyunicorn library (Donges et al., 2015). The
Pyunicorn library, in Python, was used to extract the
RQA-based features and to visualize the RPs. To
slightly reduce the computational power required by
RQA, we used the initial 30,000 data points out of
31,000 composing the original dataset (Zyma et al.,
2019); 30,000 data points correspond approximately
to 3.87 minutes of recording out of a total of 4
minutes.
As conveyed in Figure 2 and Figure 3, the RP
offers preliminary visual information of the
differences between participants belonging to the two
groups.
Figure 2: RP illustrating the F7 electrode signal for a
participant of group “G” (1,000 data points). The x and y
axes represent the data points composing the signal.
Figure 3: RP illustrating the F7 electrode signal for a
participant of group “B” (1,000 data points). The x and y
axes represent the data points composing the signal.
Upon visual inspection, participants who performed
well on the task have an RP characterized by a higher
degree of complexity, compared to those performing
poorly. This visual information might provide early
insights into the differences between groups and how
their physiological signals may affect RP’s outlook.
Training Machine Learning Models to Detect Group Differences in Neurophysiological Data using Recurrence Quantification Analysis
based Features
431
3.4 Features Selection
Each electrode selected for this work (F7, Pz, Fp1,
and Pz) was used to extract the six RQA-based
features (RR, %DET, %LAM, MDL, ADL, ENT).
The final dataset contained 24 features obtained by
multiplying the six RQA-based features times the
four electrodes. To avoid overfitting and to select the
most important features, the Extra Trees method
(Sharma, Giri, Granmo, & Goodwin, 2019) was
implemented for features selection. The Extra Trees
method was also used to obtain more insights into
which electrodes and features are likely to be the most
important to track cognitive performance and
differences between groups. After having performed
the Extra Trees method on the data, we selected the
top 5 features out of the 24 initial ones that were
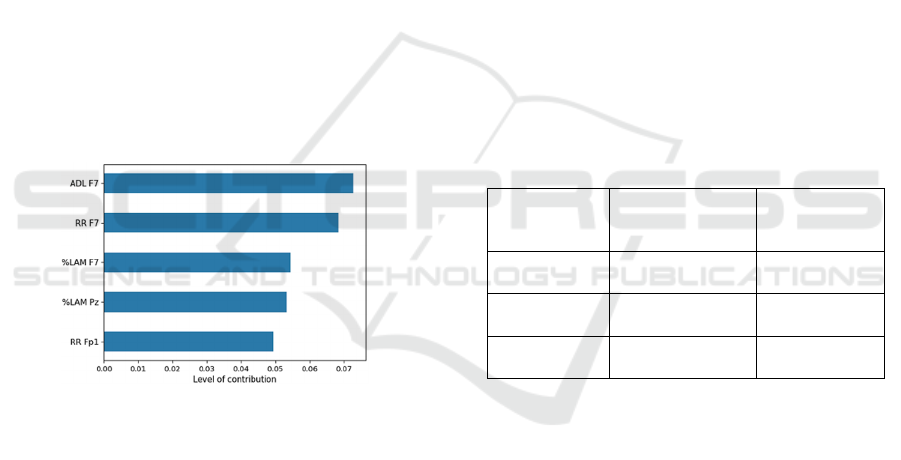
extracted. More specifically, as shown in figure 4, the
features used as input for the classifiers were ADL for
electrode F7, RR for electrode F7, %LAM for
electrode F7, %LAM for electrode Pz, and RR for
electrode Fp1. The features selection process was
performed to reduce potential overfitting especially
considering the limited size of the dataset used for this
work.
Figure 4: The features selected according to their level of
contribution.
After having selected the most relevant features,
the class imbalance present in the dataset (10 subjects
labeled as “B” and 26 labeled as “G”), was solved
using the SMOTE function. Eventually, the final
dataset fed to the classifiers was composed of 5
features and 52 instances of which 36 were original
and 16 synthetically created.
3.5 Classifiers Specifications
Multiple classifiers were used to confirm the
effectiveness of using RQA-based features to detect
cognitive performance. For this reason, an SVM, an
RF and, a GBC were used for classification purposes.
The targets of the classification were group “G” and
group “B”, respectively encoded as 1 and 0.
The hyperparameters selection was performed
using a randomized search on the 3 classifiers. The
hyperparameters adopted after having performed the
randomized search can be found in the following link:
https://osf.io/wtxpv/?view_only=ab98b469151a48a1
a91d221dc6596429.
4 RESULTS
The results obtained using the 3 classifiers show a
performance above 0.85 accuracy using 5-fold-cross
validation. In order to verify that the performance was
not due to the presence of synthetic data, the
classification task was also performed on the
imbalanced dataset containing 36 instances. The
results suggest that, even in the case of an imbalanced
dataset, the classifiers managed to perform
reasonably well on this specific task. A more detailed
overview of the performance obtained by each single
classifier using both the imbalance and balance
datasets can be visualized in Table 1.
Table 1: The accuracy scores obtained using the original
imbalanced dataset and the balanced dataset after resolving
the class imbalance.
Imbalanced
dataset accuracy
Balanced
dataset
accurac
y
RF 0.77
(
SD = 0.07
)
0.89
(
SD = 0.09
)
SVM 0.75
(SD = 0.13)
0.90
(SD = 0.06)
GBC 0.85
(
SD = 0.12
)
0.87
(
SD = 0.04
)
The use of the classifiers on the imbalanced
dataset seemed to confirm that the three classifiers
adopted in this study still performed above chance
given the information provided by the RQA-based
features.
5 DISCUSSION
This work aimed to investigate whether RQA-based
features could be used to successfully detect group
differences in a mental arithmetic task. We
hypothesized that the dynamics of the EEG signals
can differentiate participants with different levels of
numerical proficiency. The obtained results confirm
the hypothesis that the RQA-based features extracted
from the signal could discriminate effectively
between the two groups in a machine learning binary
ICAART 2022 - 14th International Conference on Agents and Artificial Intelligence
432

classification task. These results are in line with other
studies that combined machine learning and RQA-
based features to detect epilepsy, drowsiness, and
preterm birth (Borowska et al., 2018; Gruszczyńska
et al., 2019; Shabani, Mikaili, & Noori, 2016). Given
the results of our study, it is reasonable to think that
RQA has the potential to detect or differentiate
performance in other cognitive domains. For
example, RQA-based features might be adopted in
the context of training and when comparing experts
and novices on a domain-specific task. To this extent,
there may be features showing convergence between
novices and experts after a period of training. Future
studies might investigate if our findings can be
extended to skills belonging to other cognitive
domains.
The main contribution of this study consists in
providing insights into the nature of the signal
characterizing the two groups. Using RQA-based
features, instead of other methods such as neural
networks, provide information about how the signal
differs in the two groups. Tracking changes in the
extracted signal, and being able to quantify them,
might be useful when considering the effect of
training or to evaluate if a needed intervention to
improve proficiency had a beneficial outcome. The
results of our study show that %LAM and RR are
present two times among the features selected. The
difference in RR between the two groups seems to be
intuitively visualized where participants belonging to
group “B” seem to have a much more deterministic
structure in the RP compared to participants in group
“G” (see Figure 2 and Figure 3). Interestingly,
according to Zbilut and Webber (2008), %LAM
seems a crucial feature of biological signals, and more
specifically physiological signals given that it
represents transitions such as those occurring
between chaotic and periodic phases. High values of
%LAM, in the context of a physiological signal, were
associated with low flexibility, high stability, and
more time needed for state transitions (Curtin et al.
2017). For example, experts showed lower %LAM
than novices in an experiment involving eye-tracking
when inspecting dermatological images
(Vaidyanathan et al., 2014). ADL, the most important
feature in our selection, might follow a similar pattern
to %LAM where higher values might represent a
more deterministic system. In the context of cognitive
skills, a higher %LAM and a longer ADL might
represent a more deterministic and less complex
signal, which might affect the time needed to switch
from a task to another resulting in poor performance.
The current study also offers insights relevant for
EEG and electrode selection, as it answers the
question of which electrode signals are most relevant
when extracting features using RQA. This study
indicates that F7 alone might be relevant for
classification purposes in this specific task. In fact,
the three top features out of five were extracted from
this electrode. Similarly, Mikaili and Noori (2016)
found that F8 alone was effective in detecting
subjects suffering from drowsiness.
The RQA-based features extracted to detect
cognitive performance related to numeracy seem to
provide high performance, especially once the class
imbalance is resolved, independently of the classifier
used. Ghosh and Saha (2021) employed a recurrent
neural network and features extracted using power
spectral density and correntropy spectral density,
obtaining an accuracy of 0.89 in detecting proficiency
in the same task used for this study. These results,
comparable to the ones obtained in the current study,
seem to provide further evidence about the
effectiveness of using RQA-based features to detect
performance in this domain. Future work might
implement models combining RQA-based features
with features extracted with other methods (e.g.,
spectral content) to verify if this approach might lead
to higher accuracy in classifying tasks in the
numerical domain.
More generally, RQA-based features have
previously been shown to be effective in several
domains to analyze numerous physiological signals
ranging from the electrocardiogram (Zbilut &
Webber, 2008) to the electrohysterogram (Borowska
et al., 2018). RQA is generally noise-resistant and it
does not require any linear transformation before
performing the analysis (Zbilut, Thomasson, &
Webber 2002). Furthermore, the extracted features
offer interpretability giving insights into the nature of
the signal. Such characteristics might encourage
researchers to use this method in other contexts and
domains exploring its potentiality combined with
machine learning and deep learning models.
However, despite the advantages offered by this
method, it is important to put our findings in context.
The dataset used had a relatively small sample, which
may have affected the results. This issue characterizes
most of the recent studies involving physiological
measurements, machine learning, and RQA-based
features where the number of participants often tends
to be small. Consequently, this issue posits limitations
when applying machine learning models.
Another limitation affecting this study is the
limited number of RQA-based features selected.
RQA can be computationally expensive and it might
require a lot of time, or computational power, to
extract its features in case of long time-series and
Training Machine Learning Models to Detect Group Differences in Neurophysiological Data using Recurrence Quantification Analysis
based Features
433

phase space reconstructions with several dimensions
and high delay values. Therefore, the current study
was limited to the extraction of 6 RQA-based features
from just 4 electrodes. As a consequence, this work
was not able to provide a wider overview of the
relevance of other features and electrodes, and their
effect on the machine learning models’ performance.
Furthermore, the results obtained in our work do
not provide a thorough comparison between the
features extracted using linear methods on EEG data
and those obtained using RQA. Future studies should
apply RQA to larger datasets and accurately compare
RQA-based features with features extracted using
linear methods. Such efforts might provide more
information about the effectiveness of using this non-
linear method to extract features for machine learning
purposes.
6 CONCLUSIONS
The RQA-based features extracted from EEG signals
seem to provide adequate information to track
cognitive performance. Such an approach might be
implemented as an alternative to the classic linear
methods used to analyze EEG data. Future research
might provide insights into the effect of each single
RQA-based feature on performance and compare the
effectiveness of such features with the ones extracted
using different methods.
ACKNOWLEDGMENTS
The research reported in this study is funded by the
MasterMinds project, part of the RegionDeal Mid-
and West-Brabant, and is co-funded by the Ministry
of Economic Affairs, Region Hart van Brabant,
REWIN, Region West-Brabant, Midpoint Brabant,
Municipality of Breda, and Municipality of Tilburg
awarded to MML.
REFERENCES
Al-Fahoum, A. S., & Al-Fraihat, A. A. (2014). Methods of
EEG signal features extraction using linear analysis in
frequency and time-frequency domains. International
Scholarly Research Notices, 2014.
Amalric, M., & Dehaene, S. (2016). Origins of the brain
networks for advanced mathematics in expert
mathematicians. Proceedings of the National Academy
of Sciences, 113(18), 4909-4917.
Anderson, J. R., Betts, S., Ferris, J. L., & Fincham, J. M.
(2011). Cognitive and metacognitive activity in
mathematical problem solving: prefrontal and parietal
patterns. Cognitive, Affective, & Behavioral
Neuroscience, 11(1), 52-67.
Borowska, M., Brzozowska, E., Kuć, P., Oczeretko, E.,
Mosdorf, R., & Laudański, P. (2018). Identification of
preterm birth based on RQA analysis of
electrohysterograms. Computer Methods and
Programs in Biomedicine, 153, 227-236.
Cantlon, J. F., & Brannon, E. M. (2007). Basic math in
monkeys and college students. PLoS Biology, 5(12),
e328.
Chawla, N. V., Bowyer, K. W., Hall, L. O., & Kegelmeyer,
W. P. (2002). SMOTE: synthetic minority over-
sampling technique. Journal of Artificial Intelligence
Research, 16, 321-357.
Curtin, P., Curtin, A., Austin, C., Gennings, C.,
Tammimies, K., Bölte, S., & Arora, M. (2017).
Recurrence quantification analysis to characterize
cyclical components of environmental elemental
exposures during fetal and postnatal development.
PLoS One, 12(11), e0187049.
Del Río, J. M., Guevara, M. A., González, M. H., Aguirre,
R. M. H., & Aguilar, M. A. C. (2019). EEG correlation
during the solving of simple and complex logical–
mathematical problems. Cognitive, Affective, &
Behavioral Neuroscience, 19(4), 1036-1046.
Di Narzo, F. A. (2019). TseriesChaos: Analysis of
Nonlinear Time Series. R package version 0.1-
13.1.https://cran.rproject.org/web/packages/tseriesCha
os/index.html
Donges, J. F., Heitzig, J., Beronov, B., Wiedermann, M.,
Runge, J., Feng, Q. Y., Tupikina, L., Stolbova, V.,
Donner, R. V., Marwan, R., Dijstra, H. A., & Kurths, J.
(2015). Unified functional network and nonlinear time
series analysis for complex systems science: The
pyunicorn package. Chaos: An Interdisciplinary
Journal of Nonlinear Science, 25(11), 113101.
Fernandez, F., & Liu, H. (2019). Examining relationships
between soft skills and occupational outcomes among
US adults with—and without—university degrees.
Journal of Education and Work, 32(8), 650-664.
Ganguly, B., Chatterjee, A., Mehdi, W., Sharma, S., &
Garai, S. (2020, July). EEG based mental arithmetic
task classification using a stacked long short term
memory network for brain-computer interfacing. In
2020 IEEE VLSI Device Circuit and System (VLSI
DCS) (pp. 89-94). IEEE.
Garcia, C. A (2021). nonlinearTseries: Nonlinear Time
Series Analysis. R package version
0.2.11.https://CRAN.Rproject.org/package=nonlinear
Tseries
Ghosh, A., & Saha, S. (2021). Recurrent neural network
based cognitive ability analysis in mental arithmetic
task using electroencephalogram. In 2021 8th
International Conference on Signal Processing and
Integrated Networks (SPIN) (pp. 1165-1170). IEEE.
Gruszczyńska, I., Mosdorf, R., Sobaniec, P., Żochowska-
Sobaniec, M., & Borowska, M. (2019). Epilepsy
ICAART 2022 - 14th International Conference on Agents and Artificial Intelligence
434

identification based on EEG signal using RQA method.
Advances in Medical Sciences, 64(1), 58-64.
Hou, Y., Aldrich, C., Lepkova, K., Machuca, L. L., &
Kinsella, B. (2017). Analysis of electrochemical noise
data by use of recurrence quantification analysis and
Lyby, M. S., Mehlsen, M., Jensen, A. B., Bovbjerg, D. H.,
Philipsen, J. S., & Wallot, S. (2019). Use of recurrence
quantification analysis to examine associations between
changes in text structure across an expressive writing
intervention and reductions in distress symptoms in
women with breast cancer. Frontiers in Applied
Mathematics and Statistics, 5, 37. machine learning
methods. Electrochimica Acta, 256, 337-347.
Marwan, N., Romano, M. C., Thiel, M., & Kurths, J.
(2007). Recurrence plots for the analysis of complex
systems. Physics Reports, 438(5-6), 237-329.
Mengarelli, A., Tigrini, A., Fioretti, S., & Verdini, F. (2021,
July). Recurrence quantification analysis of gait rhythm
in patients affected by Parkinson’s Disease. In 2021
IEEE EMBS International Conference on Biomedical
and Health Informatics (BHI) (pp. 1-4). IEEE.
Merkley, R., & Ansari, D. (2016). Why numerical symbols
count in the development of mathematical skills:
Evidence from brain and behavior. Current Opinion in
Behavioral Sciences, 10, 14-20.
Núñez, P., Poza, J., Gómez, C., Barroso-García, V.,
Maturana-Candelas, A., Tola-Arribas, M. A., Cano, M.,
& Hornero, R. (2020). Characterization of the dynamic
behavior of neural activity in Alzheimer’s disease:
Exploring the non-stationarity and recurrence structure
of EEG resting-state activity. Journal of Neural
Engineering, 17(1), 016071.
Shabani, H., Mikaili, M., & Noori, S. M. R. (2016).
Assessment of recurrence quantification analysis
(RQA) of EEG for development of a novel drowsiness
detection system. Biomedical Engineering Letters,
6(3), 196-204.
Sharma, J., Giri, C., Granmo, O. C., & Goodwin, M. (2019).
Multi-layer intrusion detection system with ExtraTrees
feature selection, extreme learning machine ensemble,
and softmax aggregation. EURASIP Journal on
Information Security, 2019(1), 1-16.
Sharma, K., Niforatos, E., Giannakos, M., & Kostakos, V.
(2020). Assessing cognitive performance using
physiological and facial features: Generalizing across
contexts. Proceedings of the ACM on Interactive,
Mobile, Wearable and Ubiquitous Technologies, 4(3),
1-41.
Takens, F. (1981). Detecting strange attractors in
turbulence. In Dynamical systems and turbulence,
Warwick 1980 (pp. 366-381). Springer, Berlin,
Heidelberg.
Timothy, L. T., Krishna, B. M., & Nair, U. (2015,
December). Combined recurrence and cross recurrence
quantification of MCI EEG. In 2015 International
Conference on Power, Instrumentation, Control and
Computing (PICC) (pp. 1-5). IEEE.
Turianikova, Z., Tonhajzerova, I., Czippelova, B., Javorka,
K., Lazarova, Z., & Javorka, M. (2014, September).
Recurrence Quantification Analysis of heart rate and
blood pressure variability in obese children and
adolescents. In Computing in Cardiology 2014 (pp.
445-448). IEEE.
Vaidyanathan, P., Pelz, J., Alm, C., Shi, P., & Haake, A.
(2014). Recurrence quantification analysis reveals eye-
movement behavior differences between experts and
novices. In Proceedings of the symposium on eye
tracking research and applications (pp. 303-306).
Wallot, S. (2017). Recurrence quantification analysis of
processes and products of discourse: A tutorial in R.
Discourse Processes, 54(5-6), 382-405.
Wallot, S., & Leonardi, G. (2018). Analyzing multivariate
dynamics using cross-recurrence quantification
analysis (crqa), diagonal-cross-recurrence profiles
(dcrp), and multidimensional recurrence quantification
analysis (mdrqa) a tutorial in R. Frontiers in
Psychology, 9, 2232.
Wallot, S. (2019). Multidimensional Cross-Recurrence
Quantification Analysis (MdCRQA) a method for
quantifying correlation between multivariate time-
series. Multivariate Behavioural Research, 54(2), 173-
191.
Webber, C. L., & Marwan, N. (2015). Recurrence
quantification analysis. Theory and Best Practices.
Wildgen, W. (2020). Structures, Archetypes, and Symbolic
Forms. Applied Mathematics in Linguistics and
Semiotics. In Structures Mères: Semantics,
Mathematics, and Cognitive Science (pp. 165-185).
Springer, Cham.
Ying, X. (2019, February). An overview of overfitting and
its solutions. In Journal of Physics: Conference Series
(Vol. 1168, No. 2, p. 022022). IOP Publishing.
Zbilut, J. P., Thomasson, N., & Webber, C. L. (2002).
Recurrence quantification analysis as a tool for
nonlinear exploration of nonstationary cardiac signals.
Medical Engineering & Physics, 24(1), 53-60.
Zbilut, J. P., & Webber, C. L. (2008). Laminar recurrences,
maxline, unstable singularities and biological
dynamics. The European Physical Journal Special
Topics, 164(1), 55-65.
Zyma, I., Tukaev, S., Seleznov, I., Kiyono, K., Popov, A.,
Chernykh, M., & Shpenkov, O. (2019).
Electroencephalograms during mental arithmetic task
performance. Data, 4(1), 14.
Training Machine Learning Models to Detect Group Differences in Neurophysiological Data using Recurrence Quantification Analysis
based Features
435
