
Improved Method for Measuring the Pulse Wave Propagation
Velocity for Palpable Arteries
V. E. Antsiperov
a
, M. V. Danilychev, G. K. Mansurov and E. R. Pavlyukova
Kotelnikov Institute of Radioengineering and Electronics Russian Academy of Sciences, Moscow, Russian Federation
Keywords: Arterial Blood Pressure Sensor, Arterial Walls Stiffness, Pulse Wave Propagation Velocity.
Abstract: The results, regarding the development and testing of a quantitative method for diagnosing the condition of
the arterial walls, based on the application of a three-channel pneumatic sensor of an original design, are
presented. The possibility of using the data obtained by this device in combination with synchronous ECG
measurement to determine the velocity of pulse wave propagation between two cross sections of the selected
artery has been demonstrated. One of the key points of this technology is the selection of a specific pulse
wave element as a reference mark for tracking the signal transit time relative to the R-peak of the synchronous
ECG. After collecting measurement statistics, the average values of the wave propagation time between the
selected points of the artery, considering the variability of the front delay values, are used to directly calculate
the propagation velocity of the pulse wave in the investigated area of the artery. The value of the pulse wave
propagation velocity in return is an objective parameter that characterizes the degree of elasticity (or stiffness)
of the artery walls and their behaviour in different physiological situations.
1 INTRODUCTION
In previous articles (
Mansurov, 2019)
(
Antsiperov,
2020)
, the authors have developed and experimentally
investigated a line of unique sensors for recording the
blood pressure continuous dynamics.
Good results concerning the recording data
quality have been achieved with the development of
a three-channel pneumatic sensor for continuous non-
invasive blood pressure monitoring (
Mansurov, 2019)
.
Thanks to the addition to the sensor of a parallel
channel for synchronous recording of the ECG signal,
it became possible to for the combined device to
measure the absolute timing characteristics of the
pressure pulse waves, the main of which is the pulse
wave velocity (PWV). On the basis of the latter, it is
possible to assess the stiffness of the arterial walls,
which is directly related to the early manifestations of
symptoms of atherosclerosis.
Undoubtedly, the most important directions in the
fight against atherosclerosis are its prevention and
early diagnosis. In the early stages, even before the
appearance of obvious clinical signs, atherosclerosis
is characterized by an outwardly weak loss of the
main functions of the blood vessels. First, this is
a
https://orcid.org/0000-0002-6770-1317
manifested in the loss of elasticity by the vascular
walls. The process of increasing the stiffness of the
arterial walls leads to an increase in blood pressure
(BP), narrowing of the lumen of the arteries and a
deterioration in blood circulation in general. It has
long been established that one of the most adequate
methods for assessing arterial wall stiffness (gold
standard) is the measurement of pulse wave velocity
(PWV) value. Physically, PWV is the group velocity
of a pressure wave propagating along the elastic walls
of an artery because of the ejection of a mass of blood
from the left ventricle of the heart during systole.
Within the framework of the first order, linear
approximation, the theory of hydroelasticity gives the
following value for the velocity 𝑉 of an elastic wave
(Korteweg, 1878):
𝑉=
,
(1)
where E denotes the effective (tangential) Young's
modulus, parameters ℎ and 𝐷 are the wall thickness
and vessel diameter in rest, respectively, and 𝜌 is the
blood density in the vessel. It follows from (1), which
is known as Moens-Korteweg equation, that a growth
Antsiperov, V., Danilychev, M., Mansurov, G. and Pavlyukova, E.
Improved Method for Measuring the Pulse Wave Propagation Velocity for Palpable Arteries.
DOI: 10.5220/0010832100003123
In Proceedings of the 15th International Joint Conference on Biomedical Engineering Systems and Technologies (BIOSTEC 2022) - Volume 1: BIODEVICES, pages 149-154
ISBN: 978-989-758-552-4; ISSN: 2184-4305
Copyright
c
2022 by SCITEPRESS – Science and Technology Publications, Lda. All rights reserved
149
of the elasticity E of the vessel wall and a decrease in
its diameter 𝐷 lead to a increase in the value 𝑉 of
PWV.
The natural method of measuring the pulse wave
travel time (PWTT) between a pair of given points
located proximally on the arterial wall is a direct
method of measuring PWV. Direct measurement of
PWV requires a pair of sphygmometric sensors
located proximally above the superficial vessels
(arteries) and distal to the heart. Any of the pairs of
points located above the carotid, femoral, radial, and
other palpable arteries are suitable for this role. If the
distance 𝑑 between such pair of points is known and
the delay ∆𝑡 of pulse wave transition time between
these points is measured, then the PWV value is
obviously the ratio of the first of them to the second:
𝑉=
∆
=
,
(2)
where 𝑡
and 𝑡
are the time moments when the pulse
wave passes through the locations of the selected
points. How these moments are measured is not an
easy question. They can be measured by the event of
passing of a specific waveform-related label, which
can be the foot of the waveform, its maximum, the
maximum slope of the wavefront, etc. (Katsuura
, T. et
al, 2017
).
2 PWV ESTIMATION BASED ON
CONTINUOUS BLOOD
PRESSURE REGISTRATION
Earlier, we developed and tested a new three-channel
pneumatic sensor for continuous non-invasive blood
pressure monitoring (
Antsiperov, 2020). An obvious
advantage of the developed device is the possibility
of a continuous measurement of the dynamics of
blood pressure, which allows not only to determine
the current systolic / diastolic pressure, but also to
track the dynamics of blood pressure, both within the
cycle and at significant time intervals. At the same
time, it is not always possible to correctly calibrate
the measured value in pressure units. For correct
measurement of blood pressure in absolute units, a
certain position of the sensor above the artery is
required, as well as a rigid base below it, such as the
radial bone for the artery of the same name
(
Antsiperov, 2020). Only under the properly positioned
sensor the pressure in the working chamber of the
sensor could be considered equal to the blood
pressure in the artery (Figure. 1)
It was found experimentally that for arteries
whose location does not satisfy the above conditions,
it is possible to observe a pressure pulse wave signal,
the level and amplitude of which is noticeably
distorted by viscoelastic tissues lying both between
the sensor and the artery and beneath artery.
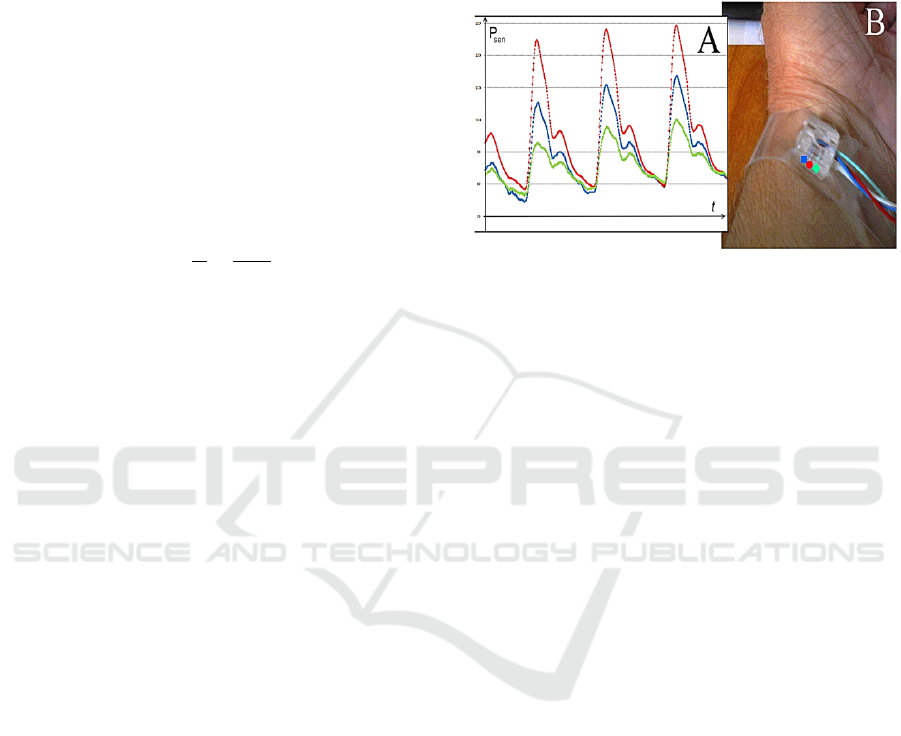
Figure 1: Three-channel pneumatic sensor for continuous
non-invasive arterial blood pressure monitoring (B). The
difference is the shape of the pulse wave signal from the
sensor (A), depending on the position of the sensor pads: ●
– pad is directly over the artery, ■. ♦ – pad is shifted to the
left and to the right respectively from the central projection
of the radial artery.
However, the general structure and corresponding
temporal characteristics of the signal are retained in
this case as well. This effect can be used to measure
the delay of signal front relative to the ECG reference
element. To solve the problem of the assessment of
pulse wave propagation velocity a unique way to use
pneumatic sensors was developed. The idea was the
following: if it is possible to take measurements for a
pair of points on the artery for a finite time with the
patient's condition unchanged, then you can try to do
it with the only one sensor. Evidently, the position of
the R-wave on the ECG can be used as a periodically
repeating reference "zero". For this purpose, an
additional channel for synchronous measurement of
the electrocardiographic (ECG) signal was integrated
into the pressure sensor configuration. In this case,
speaking in the language of radio engineering, this
channel acts as a kind of reference signal. The ECG
amplifier circuit was developed with the expectation
of using dry electrodes without a conductive gel and
without a neutral electrode, that required the
application of both analogue circuitry and digital
filters. The simplified scheme was selected to
minimize the inconvenience when applying and
removing the electrodes and is used so far at the
development stage only.
BIODEVICES 2022 - 15th International Conference on Biomedical Electronics and Devices
150
3 PWV BASED ON ABP/ECG
JOINT REGISTRATION
To solve this problem, we, together with
NEUROCOM LLC, have developed a new design
configuration of a portable sensor, which does not
require rigid attachment to the patient's body and
allows, with a certain skill, to take measurements in
many important positions (Figure 2). The three-
channel pneumatic sensor of a new configuration
(type) allows continuous measurements for several
minutes, even in some hard-to-reach places.
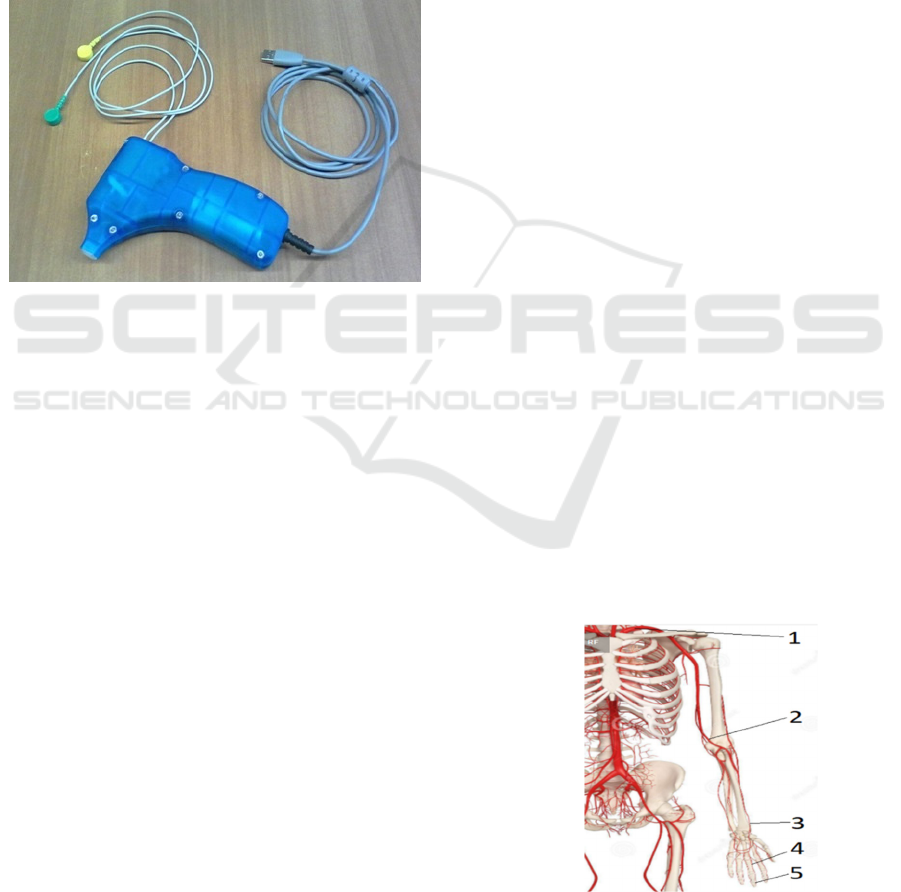
Figure 2: The version of the pressure sensor for measuring
short patterns of blood pressure with a built-in ECG channel
(two coloured button connectors).
Existing methods for assessing the stiffness of the
arterial walls by the pulse wave propagation velocity
are based, as a rule, on measuring the time of
propagation of the pulse wave along the radial artery
by the delay in the appearance of the wave on the
wrist relatively to the preceding R-peak of the
electrocardiogram. It was demonstrated (Kortekaas
,
2018
)
that the moment when the pulse wave appears
in the aorta does not coincide with the R-peak of the
ECG but has a certain time lag. The magnitude of this
lag differs for certain age groups and diseases, and it
varies relatively weakly within these categories. Even
this small variability has a significant impact on the
accuracy of pulse wave velocity (PWV)
measurements. The error in measuring the PWV
value mainly depends on the accuracy of measuring
the signal delay time, since the length of the section
of the artery under study can be measured quite
precisely. The distance from the aorta to the radial
artery in the area of the wrist joint in an adult man is
about 0.8 m, and the pulse wave propagation velocity
is about 7-14 m/s. Therefore, the signal delay can be
estimated to be on the order of 100 milliseconds. For
example, for a given measurement accuracy of 5%,
the error in measuring the delay should not be greater
than 5 ms.
It is not difficult to determine the moment of
"dynamic zero" from the "rather narrow" R-peak of
the ECG with such accuracy, but it is not so for a
pulse wave impulse. Quite often, many researchers,
being biologists or physicians by education and
scientific background, tend to use the position of the
minimum or, conversely, the maximum of the pulse
wave impulse as the required timestamps (
Kortekaas,
2018)
. However, it is well known from radiophysics
that various transient processes in the region of the
establishment of the pulse top or in the region of the
minimum significantly distort the main process and
interfere with fixing timestamps with the required
accuracy. As a solution, pulse technology uses
tracking of timestamps on the leading edge of the
pulse at the level of 0.1 and 0.9 of its amplitude
defining start and rise time. Taking into account these
considerations and having a portable pulse wave
sensor, a PWV measurement method was developed
based on determining the average difference in the
delay values from the R-peak on the ECG to the
sequential arrival of the pressure pulse front at
selected points on the artery under study.
4 EXPERIMENTAL RESULTS OF
PWV MEASURMENTS
In our experiments, the results of which are presented
in this section, a pulse wave was recorded at five
different points along the artery (Figure.3): on the
subclavian artery (1), on the brachial artery (2) by
0.35 m lower (just above the ulnar bend), on the radial
artery (3) by another 0.27 m lower, at the artery at the
base of the middle finger (4) lower by another 0.17 m
and at the artery in the pad of the same finger (5)
lower by another 0.06 m.
Figure 3: Locations of the points to measure PWV.
Improved Method for Measuring the Pulse Wave Propagation Velocity for Palpable Arteries
151
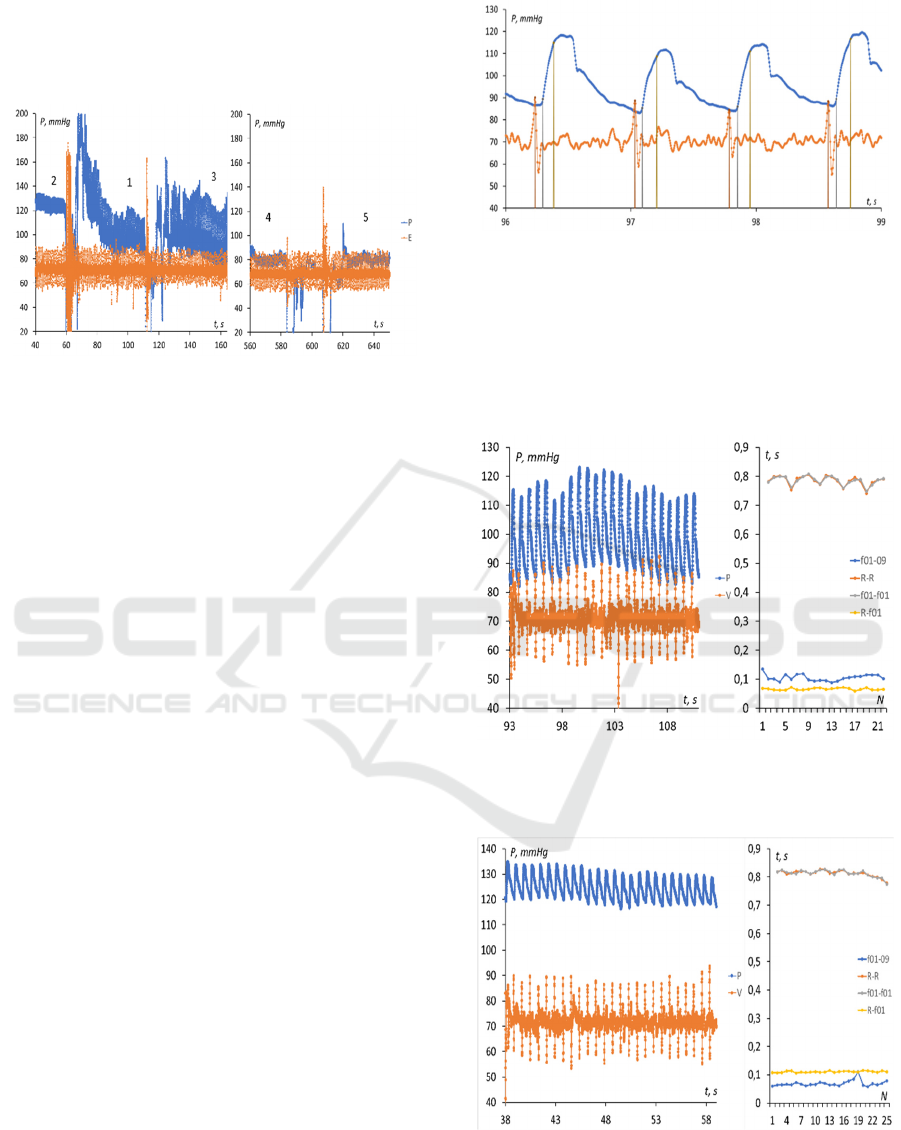
Figure 4 demonstrates the joint recording of the
pulse wave signal and the ECG, the numbers on the
graph correspond to the measurement points on the
patient's body (see Figure 3).
Figure 4: Five-point record of pulse wave and ECG signals.
When deciphering the readings, it should be
remembered that only for the radial artery, the pulse
wave parameters correspond to the actual blood
pressure. In other cases, there are various distortions
caused, for example, by the damping properties of the
surrounding soft tissues. Therefore, the amplitude and
constant component of the pulse wave in these areas
may differ rather significantly from the actual
pressure in the artery.
Since we are free of the tabular reference values
for the “pre-ejection period” (
Kortekaas, 2018)
, we
develop a criterion for the stabilization of the wave
propagation time, which is more reliable for pressure
wave signals. We will consider the beginning and end
of the leading edge of the signal, which we determine,
as it is customary in pulse technology, at levels 0.1
and 0.9 of the signal amplitudes (timestamps f01 and
f09, respectively). In our case, the levels of the
thresholds of the pulse wave fronts for each cycle are
updated, as demonstrated in Figure 5. Each positive
edge of the signal has "personal" marks of the
beginning and end of the edge. Of course, the
beginning of the front should be taken as the marks of
the passage of the wave, since the shape of the pulse
wave noticeably changes during the motion, as does
the duration of the front.
This algorithm was used first to indicate digital
value of R-f01 online. Value of R-f01 turned out to
be slightly varying from pulse to pulse and should be
averaged to use practically. Below, Figures 6-10
demonstrate the graphs of record fragments of pulse
wave and ECG signals at each of the five
measurement points and graphs of time parameters
for each successive pulse wave front.
Figure 5: Timestamps at the level of 0.1 and 0.9 of the
signal amplitudes for each wave front.
Legend: f01-09 – pulse wave rise time, R-R - time
intervals between successive R-peaks, f01-f01 -
intervals between successive edges of pulse waves,
R-f01 - delay time of pulse wave front relative to R-
peak.
Figure 6: Pulse wave and ECG recording and their temporal
characteristics for the subclavian artery (point 1 in Figure
3).
Figure 7: Pulse wave and ECG recording and their temporal
characteristics for the brachial artery (point 2).
BIODEVICES 2022 - 15th International Conference on Biomedical Electronics and Devices
152
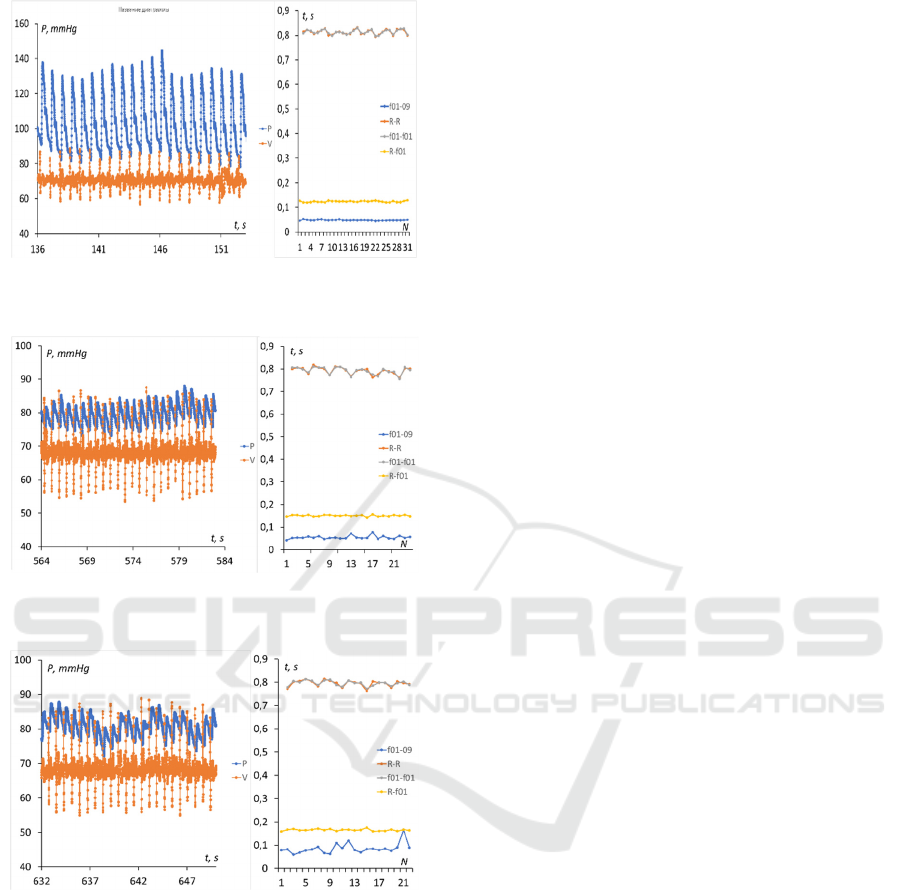
Figure 8: Pulse wave and ECG recording and their temporal
characteristics for the radial artery (point 3).
Figure 9: Pulse wave and ECG recording and their temporal
characteristics for the digital artery (point 4).
Figure 10: Pulse wave and ECG recording and their
temporal characteristics for the digital artery (point 5 in
Figure 3).
It should be noted that these data were obtained
when measuring the indicators of cardiovascular
activity in a specific measuring environment and for
certain physiological conditions of the patient. But,
even under controlled experimental conditions, the
data may change due to the dependence of the
patient's reactions in a particular measurement
session on many uncontrolled factors. It is obvious
that even with a given physiological condition, all
time intervals are variable, and averaging is required
to correctly estimate the signal delay time. In this
case, the standard deviation did not exceed 1 ms.
The average delay time of the wave front relative
to the R-peak of the ECG was 60.5 milliseconds (ms)
for the subclavian artery, 109.5 ms for the brachial
artery, 130 ms for the radial artery, 140 ms at the base
of the finger and 177 ms at the fingertip for the digital
artery. Accordingly, the assessment of the
propagation velocity of the pulse wave in the section
1-2 from the subclavian to the brachial artery was
about 7.4 m/s, in the section 2-3 - 13.5 m/s, in the
section 3-4 - 17 m/s and in the section 4-5 about 2 m/s.
The increase in velocity in sites 1 - 4 can be explained
by a decrease in the diameter of the branching arteries
according Moens-Korteweg equation (1). The
decrease in speed in the last section, apparently, is due
to more complex reasons. Note that the duration of
the pulse wave front is not the same in different points
of the measurement sites: 94 ms on the subclavian, 65
ms on the brachial, 58 ms on the radial, 70 and 78 ms
on the digital arteries, respectively.
5 CONCLUSIONS
Thus, the variant of a three-channel pneumatic sensor
described in the paper, designed for measuring and
recording short-term blood pressure files, can be used
as a pulse wave sensor on all palpable arteries.
Experiments on measuring pressure in various
superficial arteries show that in the case of arteries
located above hard tissues (bones), both the shape of
the pulse wave and the actual value of blood pressure
can be recorded. This is true, for example, in the case
of the radial and femoral arteries. The presence in our
device of an additional ECG channel makes it
possible to uniformly measure the delay time of the
pulse wave at spaced points of the artery, that makes
it very easy to calculate the pulse wave propagation
velocity along the walls of the artery.
Obtaining and subsequent interpretation of data
on the dependence of the distribution of the pulse
wave velocity in the arterial system on various
internal and external factors is extremely interesting,
both for a general understanding of the processes
taking place in the human body and for the practical
diagnosis of the different diseases. It is important to
note that the claimed technology can significantly
improve the accuracy of measurements of the pulse
wave propagation velocity due to small size of
sensing pad.
Improved Method for Measuring the Pulse Wave Propagation Velocity for Palpable Arteries
153

REFERENCES
Antsiperov, V.; Mansurov, G.; Danilychev, M. and Bugaev
(2020) A. Non-Invasive Blood Pressure Monitoring
Based on Pulse Wave Recording with a New Three-
channel Pneumatic Sensor. Proc. of the 13th
International Joint Conference on Biomedical
Engineering Systems and Technologies (BIOSTEC
2020) – V. 1: BIODEVICES, P. 268-273. DOI:
10.5220/0009169902680273.
Katsuura, T. et al. (2017) Wearable pulse wave velocity
sensor using flexible piezoelectric film array. IEEE
Biomedical Circuits and Systems Conference
(BioCAS), P. 1-4.
Kortekaas, M.C., et. al. (2018) Small intra-individual
variability of the pre-ejection period. PLoS ONE, V.
13(10). DOI: 10.1371/journal.pone.0204105.
Korteweg D.J. (1878) Über die Fortpflanzungs-
geschwindigkeit des Schalles. In Elastischen Röhren
[About the speed of wave propagation in elastic tubes].
Ann Phys. V. 214, P.525-542.
Mansurov, G., Antsiperov, V., Danilychev, M. and
Churikov, D. (2019) Non-Invasive Blood Pressure
Monitoring with Positionable Three-chamber
Pneumatic Sensor. Proc. of the 12th International Joint
Conference on Biomedical Engineering Systems and
Technologies (BIOSTEC 2019) – V. 5: HEALTHINF,
P. 462-465. DOI: 10.5220/0007574904620465.
BIODEVICES 2022 - 15th International Conference on Biomedical Electronics and Devices
154
