
Estimating Perceived Comfort in Virtual Humans based on Spatial and
Spectral Entropy
Greice Pinho Dal Molin, Victor Fl
´
avio de Andrade Araujo and Soraia Raupp Musse
a
School of Technology, Graduate Program in Computer Science,
Pontifical Catholic University of Rio Grande do Sul, Porto Alegre, Brazil
Keywords:
Visual Perception, Virtual Humans, Comfort, Uncanny Valley.
Abstract:
Nowadays, we are increasingly exposed to applications with conversational agents or virtual humans. In the
psychology literature, the perception of human faces is a research area well studied. In past years, many works
have investigated human perception concerning virtual humans. The sense of discomfort perceived in certain
virtual characters, discussed in Uncanny Valley (UV) theory, can be a key factor in our perceptual and cognitive
discrimination. Understanding how this process happens is essential to avoid it in the process of modeling
virtual humans. This paper investigates the relationship between images features and the comfort that human
beings can feel about the animated characters created using Computer Graphics (CG). We introduce the CCS
(Computed Comfort Score) metric to estimate the probable comfort/discomfort value that a particular virtual
human face can generate in the subjects. We used local spatial and spectral entropy to extract features and
show their relevance to the subjects’ evaluation. A model using Support Vector Regression (SVR) is proposed
to compute the CCS. The results indicated approximately an accuracy of 80% for the tested images when
compared with the perceptual data.
1 INTRODUCTION
The area of Computer Graphics has stood out in the
sophisticated creation of environments and charac-
ters. The similarity to the real world surprises both
researchers and users. Assessing the perceived quality
of the content of images and videos is essential in pro-
cessing this data in various applications, such as films,
games, but also platforms that use images to com-
municate relevant information (Shahid et al., 2014).
The area of visual perception is highly complex, in-
fluenced by many factors, not fully understood, and
difficult to model and measure. The perceptual prob-
lem we are interested on investigating in this pa-
per is known as the Uncanny Valley theory (Mori,
1970). In the 1970s, Professor Masahiro Mori real-
ized that when human replicas behave very similarly,
but not identical to real human beings, they provoke
disgust among human observers because subtle devi-
ations from human norms make them appear fright-
ening. He referred to this revulsion as a drop in famil-
iarity and the corresponding increase in strangeness
as Uncanny Valley (Mori, 1970). In this study, we
work with CG images that, according to subjective
a
https://orcid.org/0000-0002-3278-217X
evaluation, can generate the sensation of strangeness
studied in the effects known as Uncanny Valley. The
main goal of this work is to investigate whether image
features captured from the face of CG characters can
be used to specify whether the images can indicate a
level of comfort in human perception. We introduce
a new metric named CCS (Computed Comfort Score)
that aims to evaluate CG faces to provide a value of
comfort correlated with human perception. We com-
pute the CCS for whole faces and their parts, like nose
and eyes. We propose using entropy techniques and
SVR (Support Vector Regression) to calculate CCS
i
,
i.e., a value that estimates the comfort of a particu-
lar CG face i. we generate comfort values and tested
it with parts of the face of Virtual Humans, to fig-
ure out which part generates more strangeness, and
also with same characters but transformed to cartoons,
to investigate the hypothesis that cartoon characters
are more comfortable than realistic or not realistic
ones according to Katsyri (K
¨
atsyri et al., 2017) and
MacDorman (MacDorman and Chattopadhyay, 2016)
similar studies. This work is expected to contribute to
the entertainment industry through recommendations
and studies that can enhance the experience and im-
prove the perception of CG characters.
436
Molin, G., Araujo, V. and Musse, S.
Estimating Perceived Comfort in Virtual Humans based on Spatial and Spectral Entropy.
DOI: 10.5220/0010831300003124
In Proceedings of the 17th International Joint Conference on Computer Vision, Imaging and Computer Graphics Theory and Applications (VISIGRAPP 2022) - Volume 4: VISAPP, pages
436-443
ISBN: 978-989-758-555-5; ISSN: 2184-4321
Copyright
c
2022 by SCITEPRESS – Science and Technology Publications, Lda. All rights reserved
2 RELATED WORK
This section discusses the research conducted in vi-
sual perception and Uncanny Valley concerning ani-
mated characters. The concept proposed by Tumblin
and Ferwerda (Tumblin and Ferwerda, 2001) is well
suited for this research. The authors understand that
perception is a process that actively builds mental rep-
resentations of the world, even from raw, loud, and
incomplete sensory signals. Zell et al. (Zell et al.,
2019) describe that perceptual data assessments are
essential to understand the human perception of CG
characters to contextualize conversations, human and
environmental perceptions, and having control over
motives or decisions. These needs are associated with
today’s increasingly improved graphical realism, as
explained by Prakash (Prakash and Rogers, 2015),
that it makes humans expect more realistic virtual hu-
mans, as well. A typical example of using this new
modeling is presented in immersive 3D environments.
They can even be used for psychological assessments
through simulations, as well as for entertainment pur-
poses, as MacDorman et al. explicitly states (Mac-
Dorman et al., 2010). Therefore, the concern with
evaluating the appearance and behavior of CG char-
acters through the Uncanny Valley theory seems to
be relevant, being associated with a human similarity
that can be used for a wide range of applications, as
indicated by Tinwell et al. (Tinwell et al., 2011). Von
Bergen et al. (Von Bergen, 2010) also supports this
idea that computer animations are increasingly being
used to address ethical and moral issues in both the le-
gal and medical professions and even for recruitment.
Some studies in this area of animation show char-
acteristics in CG characters that are already consid-
ered more strange to humans, when evaluated, such as
actions perceived as unnatural, rigid or abrupt move-
ments, shown in the study by Bailenson et al. (Bailen-
son et al., 2005); lack of human similarity in the
speech and facial expression of a character, in the
studies by Tinwell et al. (Tinwell et al., 2011); lip
synchronization error that can be expressed before lip
movement or vice versa, according to the studies by
Gouskos et al. (Gouskos, 2006).
For these reasons, we believe that using statistical
characteristics of the images, treated in Liu et al. (Liu
et al., 2014), could prove promising in the assessment
of comfort of the animated characters’ faces. Support
vector regression (SVR) is used to predict the average
human opinion score on comfort with these various
NSS (natural statistic scene) features as input.
3 THE PROPOSED MODEL
This section presents our proposed methodology
named CCS (Computed Comfort Score). First, we
present the dataset used in our research, then the pro-
posed pre-processing phase, and finally the informa-
tion about the proposed training, testing, and valida-
tion process.
3.1 Dataset of Images/Videos
First, our selection of characters is based on a previ-
ous work (Dal Molin et al., 2021; Araujo et al., 2021),
which proposes a methodology to estimate a binary
comfort classification using image features. The com-
plete data set contains 22 characters (photos and short
films) and the subjects’ responses
1
. To guarantee the
variation of human similarity present in the Uncanny
Valley, some of the chosen characters represent a hu-
man being in a cartoon way (s), and others are more
realistic, as (v), (r), (k) in Figure 1. Not all 22 charac-
ters were used because three failed in the face detector
and its parts, which is the basis of the present work.
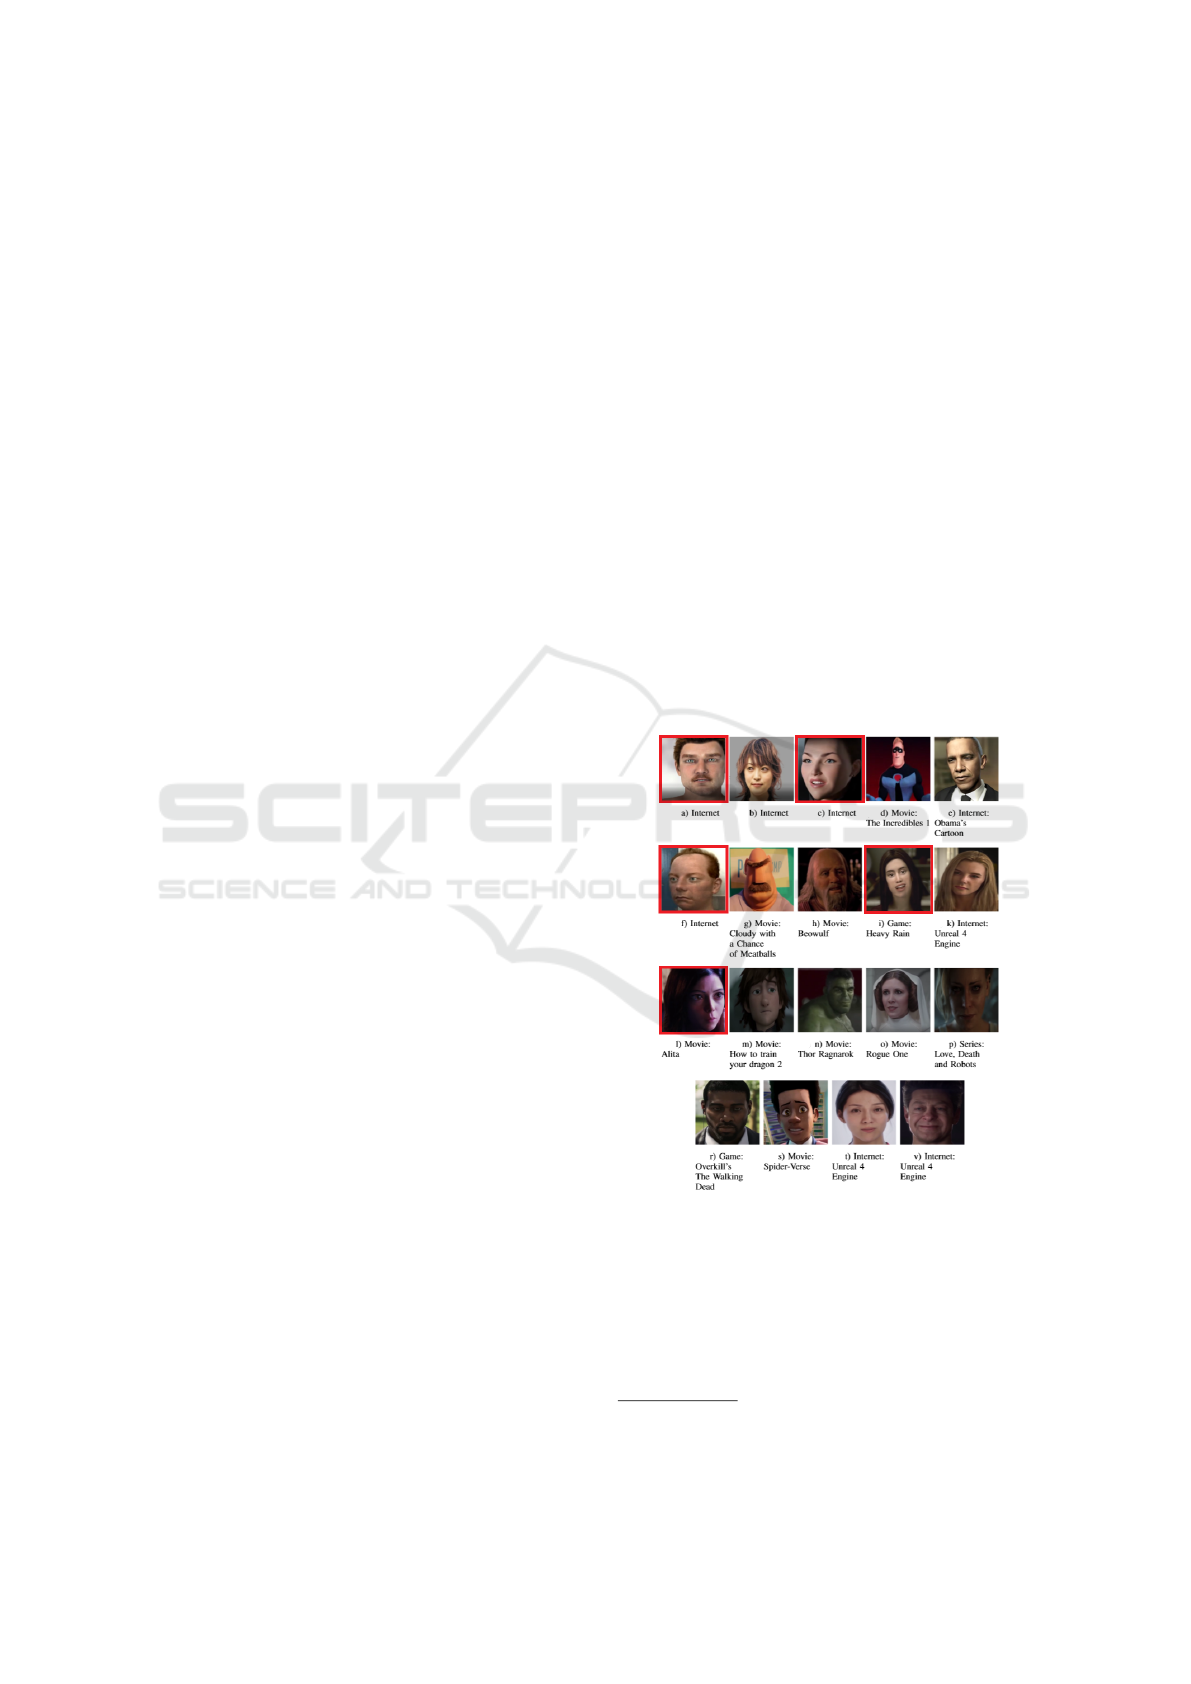
Figure 1: Nineteen characters used in this work (Dal Molin
et al., 2021; Araujo et al., 2021).The characters with a rect-
angular frame in red caused discomfort in human percep-
tion. Letters missing represent characters that face detector
did not detect the face or the face parts.
To obtain human perceptions of realism and com-
fort (variables necessary to build the X and Y axes
of the Uncanny Valley graph (Mori, 1970)), we used
1
Copyrighted images reproduced under ”fair use pol-
icy.”
Estimating Perceived Comfort in Virtual Humans based on Spatial and Spectral Entropy
437

the survey from previous work (Araujo et al., 2021;
Dal Molin et al., 2021): i) Q1 - ”How realistic is
this character?”, having three scales Likert’s answers
(”Unrealistic”, ”Moderately realistic” and ”Very re-
alistic”) to perceived realism; ii) Q2 - ”Do you feel
some discomfort (strangeness) looking to this char-
acter?”, with answers ”YES” and ”NO” to perceived
comfort; and iii) Q3 - ”In which parts of the face do
you feel more strangeness?”, having multiple choice
(”eyes”, ”mouth”, ”nose”, ”hair”, ”others” and ”I
do not feel discomfort”). The authors used Google
Forms and recruited participants in social networks.
Characters were randomly presented to the partici-
pants through images and short videos. Then, sub-
jects answer the questions. A total of 119 participants
answered the survey, 42% of which were women and
58% of men, and 77.3% being less than 31 years old
and 33.7% being 31 or more years old. In addition,
we also used the 19 videos (one short movie for each
character illustrated in Figure 1) and removed those
frames which do not contain the face of the charac-
ter to be analyzed. This process resulted in 5730 im-
ages. In our ground truth processing, we consider the
answer of Q1 to determine the perceived level of re-
alism, Q2 is used to determine the percentage of per-
ceived comfort, and Q3 answers are used to evaluate
the parts of the face which generate more strangeness.
To categorize the characters in different levels of real-
ism, we used the averages of scores of Q1 answers, so
each character has an average value of realism. We di-
vided characters into the three levels of realism based
on the three following groups: i) unrealistic charac-
ters, having average realism values ≤ 1.5; ii) mod-
erately realistic characters, having average values of
realism ≤ 2.5; and iii) very realistic characters, real-
ism values > 2.5. The value of comfort for each char-
acter was computed through the percentage of ”NO”
(discomfort) answers to question Q2.
3.2 Pre-processing Data
The overview of our method, illustrated in Figure 2,
is inspired on proposed by Liu et al. in (Liu et al.,
2014) for natural photographic images. In order to
verify whether CG images contain pixels that exhibit
strong dependencies in space and frequency, which
carry relevant information about an image, we im-
plemented a model that could extract characteristics
from spatial and spectral entropy. We performed three
main processes in order to prepare data to be used
in our method: A) the face detection, B) the extrac-
tion of image Entropy features, and C) the features
pooling. After the pre-processing phase, we perform
the Computed Comfort Score (CCS) to estimate the
face comfort. We implemented our method using
OpenCV (Howse, 2013), scikit-learn (Van der Walt
et al., 2014) and dlib (Rosebrock, 2017).
The method used for face detection is the one pro-
posed by Paul Viola and Michael Jones (Viola and
Jones, 2001). This method detects a face and also
parts of the face. In the latter case, there are eight
parts: mouth, middle of the mouth, right and left eyes,
right and left eyebrows, nose, and jaw. For our model,
we consider that if no face is detected, or if the face
is detected and the eight parts are not, the image is
discarded. The middle mouth region is not used for
our model because it is already inside the mouth, and
the jaw is not used because the entire face is already
evaluated. After the discarded images, we have a total
of 5730 images.
In this step, we proceed with the features extrac-
tion. Firstly, each image is resized to be a multiple of
2 and partitioned into 8x8 blocks. This block size is
based on the work proposed by Liu et al. (Liu et al.,
2014), who performed several experiments until set-
ting M = 8 as a good block size value. We compute the
spatial and spectral entropy characteristics locally for
each block of pixels and each region of interest, i.e.,
the whole face and its parts. According to the defi-
nition of entropy of the image (Sponring, 1996), its
main function is to describe the amount of informa-
tion contained in an image. In the image quality as-
sessment area (Liu et al., 2014), one of the motivating
aspects is to identify the types and degrees of image
distortions that generally affect their local entropy.
Spatial entropy calculates the probability distribution
of the mean pixel values, while spectral entropy cal-
culates the probability distribution of the global DCT
(Domain Cosine Transform) coefficient values. We
hypothesize that the local Spatial and Spectral entropy
applied in Computer Graphics (CG) images may indi-
cate statistical characteristics that correlate with per-
ceptual data about CG faces. Indeed, this is the central
hypothesis of the proposed CCS (Computed Comfort
Score). To calculate the spatial entropy
2
, we used
the skimage.filters.rank library through function en-
tropy(). To calculate the spectral entropy using FFT
(Fast Fourier Transform) we use the scipy fftpack
3
library. To calculate the frequency map, the fft() func-
tion and then the dct() function were used to calculate
the (DCT) domain cosine transform, both with default
parameters.
At this stage, the entropy computation described
in the previous step is used to calculate other charac-
teristics for all pixel blocks of the face and its parts.
2
https://scikit-image.org/docs/0.8.0/api/skimage.filter.
rank.html
3
https://docs.scipy.org/doc/scipy/reference/fftpack.html
VISAPP 2022 - 17th International Conference on Computer Vision Theory and Applications
438

Figure 2: The overview of our model described in Section 3.2.
The characteristics proposed in this work are mean,
standard deviation, distortion, kurtosis, variance, Hu
Moments (
ˇ
Zuni
´
c et al., 2010) and Histogram of Ori-
ented Gradients (HOG) (Dalal and Triggs, 2005). Hu
Moments was used with its default parameters (
ˇ
Zuni
´
c
et al., 2010), implemented using OpenCV
4
(Howse,
2013), generating a vector of 7 positions. For HOG,
the detection window with gradient voting into five
orientation bins and 3x3 pixels blocks of 4x4 pixel
cells was used in the spectral entropy features and
16x16 pixel cells in the spatial entropy features, gen-
erating a vector with 11 positions. HOG was imple-
mented using scikit-learn (Van der Walt et al., 2014).
So, we have 23 features for spectral entropy and 23
for spatial entropy, proposing a total of 46 features.
The next section presents how the prediction of the
face, and parts of the face, comfort score are com-
puted. This step generates CCS for each CG face in
the data set (5730 images) plus six parts of each 5730
faces.
3.3 Computing CCS using Support
Vector Regression
First, all 5730 images of 19 characters are used
to train, test, and validation, varying in these three
groups until all characters participate in all groups. In
order to run the SVR (Support Vector Regression), we
proposed nine models to test the impact of each group
of Entropy features: i) Hu (7 features) and HOG (11
features), and ii) mean, standard deviation, distortion,
kurtosis, and variance. In addition, we want to eval-
uate the impact of spatial and spectral entropy, sepa-
rated and together, and the face and its parts (7 tested
ROIs, the whole face, and six parts). So, we proposed
nine combinations of the extracted data to use in the
SVR model according to Table 1, in order to find the
best precision of perceptual score, as follows:
The nine models are computed to evaluate which
features better correlate with the perceived comfort
4
https://opencv.org/
regarding CG characters, i.e., the ground truth with
perceptual data (GT). The models generate individ-
ual values of comfort for each image from the short
movie of each character, i.e., our proposed metric
CCS
i
for each character i in each frame f . Thus,
to compute the CCS for each i character, in each
video, we simply calculate the average CCS obtained
at each f frame, from the movie that i participates
in: CCS
i
= Avg(
∑
N
i
i=0
CCS
i, f
), where i is the index of
character, N
i
is the number of frames of short movie
and f is the frame index.
4 EXPERIMENTAL RESULTS
Firstly, we want to investigate the accuracy obtained
with the nine implemented models to calculate CCS
and compare with the previous work (Dal Molin
et al., 2021), where the binary classification (Com-
fort/Discomfort) is generated for each character. In
addition, we evaluated the error obtained when we
confronted the CCS
i
obtained value and the perceived
comfort for each character i. Then, we provide an
analysis to find out the part of the faces that generate
more discomfort with our method. Moreover, we in-
vestigate a hypothesis, transforming all CG characters
in cartoons and calculating the CCS again.
4.1 Evaluating CCS Values Used in the
Binary Classification of Comfort
Firstly, we present the binary classification result re-
garding the CG characters, using the nine models and
the whole face. We consider that characters in which
perceptual comfort < 60%, in the ground truth, can
generate discomfort in the human perception. While
remaining characters generate comfort, i.e., percep-
tual comfort >= 60%. Table 2 shows the five char-
acters that generate discomfort in human perception
and the result of binary classification using CCS val-
ues with the same threshold as in the ground truth,
Estimating Perceived Comfort in Virtual Humans based on Spatial and Spectral Entropy
439

Table 1: Combination of nine models proposed to test the impact of each group of Entropy features. The column Statistics
features correspond to mean, standard deviation, distortion, kurtosis, variance. The column Total characteristics (T.C.) refers
to the number of characteristics evaluating the entire face and the six face parts according to the features selected in the
previous columns.
Model # Spatial Entropy Spectral Entropy Statistics Features HOG Hu Moments T. C.
1 x x x x x 322
2 x x x x 224
3 x x x x 168
4 x x x x 161
5 x x x 112
6 x x x 84
7 x x x x 161
8 x x x 112
9 x x x 84
i.e., discomfort if CCS < 60% and comfort if CCS >=
60%. A similar analysis is presented in Table 2 with
characters that generate comfort in human perception.
In Table 2, ”*” indicates that classification was cor-
rect, while ”-” was not correct.
As can be seen in Table 2, Models 1 and 6 seem
to be more adequate than others to provide a correct
classification of the last five characters that generate
strangeness or discomfort in the individuals. Models
7 and 8, in Table 2, present 100% of correct classi-
fication with characters that are comfortable, accord-
ing to the human perception. When evaluating all the
characters together that present discomfort and com-
fort in people’s perception on the Table 2, we no-
ticed that the best model, in this case, is Model 1 with
approximately 80% of average accuracy, considering
both groups of characters. One can say that Models
7 and 8 also seem accurate, but in fact, such mod-
els classified incorrectly more than half of characters
that generate strangeness/discomfort, maybe indicat-
ing a tendency in generating high values of computed
comfort (CCS). In addition, the Mean Absolute Error
(MAE) between CCS obtained values and the comfort
value in the ground truth, for the 19 evaluated charac-
ters, is 23.59. Table 3 presents results of perceived
and estimated comfort (CCS) in the second and third
columns, for all 19 characters. Figure 3 show the
CCS and perceived comfort values in the UV graph
(Comfort X Human likeness). The yellow line refers
to cartoons analyzed, and it is going to be discussed in
Section 4.3. It is important to notice that Model 1 ac-
curacy (80%) is very similar to results obtained in the
previous work (also 80%) (Dal Molin et al., 2021).
4.2 Perception of Comfort through
Entropy Analysis in CG Face Parts
Considering that a specific part of the face can cause
discomfort, we investigated the parts of the face that
cause more discomfort/strangeness. Analyzing the
perceptual data, subjects comment that firstly part of
the face that causes strangeness is the eyes followed
by the mouth and nose. Taking the five characters
that generate discomfort in the perceptual study, we
observed that the nose and eyes are the parts of the
face with smaller values of CCS. On the other hand,
in the perceptual study, 11 from 14 characters that do
not generate strangeness present the mouth as the re-
gion less comfortable, being eyes and nose the less
comfortable for the three remaining characters. It is
interesting to remark that there are not many varia-
tions concerning the CCS computed for face parts and
compared with perceived comfort. Values of MAE
for each face part, comparing with perceived com-
fort are (ordered from the lowest error to the higher)
following presented: 21.15 for the nose, 22.40 for
left eyebrow, 22.52 for right eyebrow, 22.93 for the
left eye, 23.89 for right eye, and 24.63 for the mouth.
Although the average error of the parts of the face
(22.92) is slightly less than CCS for the full face
(23.59), these values are not obtained with the same
model. For example, Model 6 is used to get the best
CCS for the left eye, left eyebrow, and right eyebrow;
and Model 4 is the most suitable for the right eye. In
fact, when analyzing model by model, none achieved
better accuracy than Model 1 for the entire face.
4.3 The More Like a Cartoon, the More
Comfortable the Character Is?
According to the Uncanny Valley theory (Mori, 1970)
and other work presented in literature (K
¨
atsyri et al.,
2015), (K
¨
atsyri et al., 2017), (MacDorman and Chat-
topadhyay, 2016), (Flach et al., 2012), (Hyde et al.,
2016), (Chaminade et al., 2007), unrealistic charac-
ters (mostly cartoons) tend to be more comfortable to
the human perception. Thus, to assess whether the
comfort value could be if the character were cartoon-
like, we decided to transform them into cartoons. We
used Toonify
5
to cartoonize the characters, even the
characters that are already be classified as cartoons.
Only 13 characters had faces detected by Toonify.
5
https://github.com/justinpinkney/toonify
VISAPP 2022 - 17th International Conference on Computer Vision Theory and Applications
440
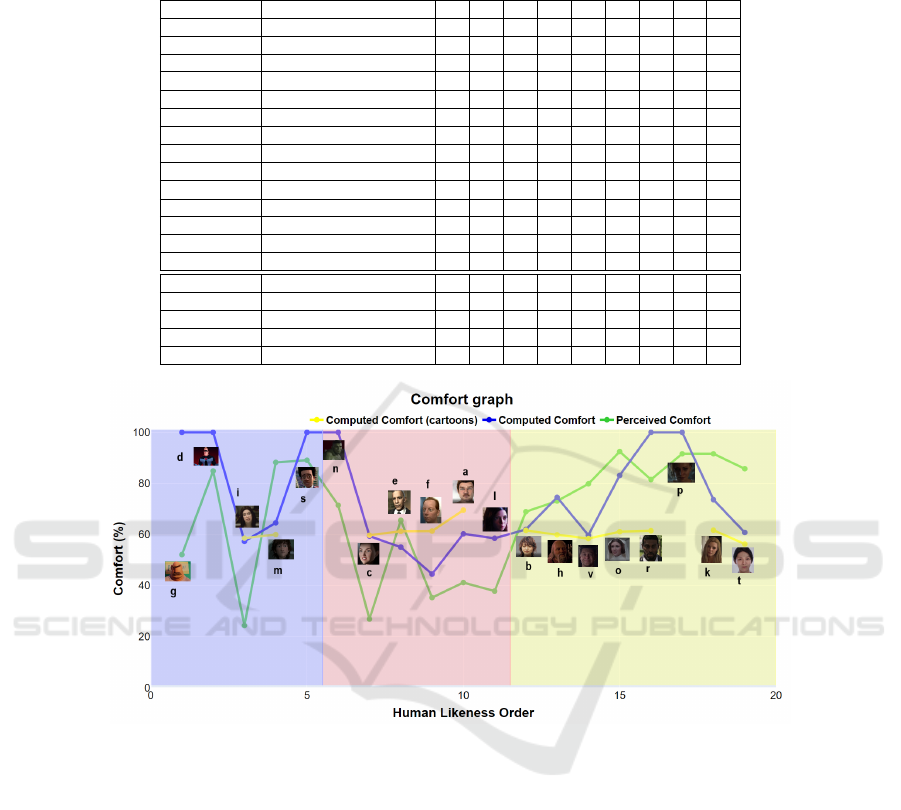
Table 2: Number of frames extracted from the videos of the 19 characters and result of binary classification with computed
comfort using the 9 studied models. The symbol ”-” indicates the incorrect classification while ”*” indicates the opposite.
The last 5 characters (a, c, f, i, l) correspond to the highlighted characters in Figure 1.
Character Number of Frames 1 2 3 4 5 6 7 8 9
(b) 553 * * * * - - * * *
(d) 17 * * - * * * * * *
(e) 610 - - * - - - * * *
(g) 2 * * * * * * * * *
(h) 164 * * * * * * * * *
(k) 72 * * - - * - * * *
(m) 209 * * * * * - * * *
(n) 74 * * * * * * * * *
(o) 145 * * * * * - * * -
(p) 60 * * * * * * * * -
(r) 18 * * * * * * * * *
(s) 21 * * - * * * * * *
(t) 403 - - * * * * * * *
(v) 428 - - * * - * * * *
(a) 1786 - - * * * * - - -
(c) 745 * * - * - * * * -
(f) 148 * * - * - * * * -
(i) 250 * * - - - * - - -
(l) 33 * - - - - - - - -
Figure 3: Comfort graph with perceived comfort values shown on the green line (our ground truth, that is, people assessment
of the characters), CCS for each character shown on the blue line, and comfort values computed for each cartoon character
presented on the yellow line. The X-axis represents the ordering of the characters according to the values of realism obtained
by question Q1 (referring to realism) in the perceptual experiment. In addition, the colored backgrounds represent the groups
of realism of each character, with the blue representing the Unrealistic characters, red representing Moderately Realistic, and
yellow representing Very Realistic.
Figure 4 shows the 13 characters that have been trans-
formed. We use Toonify because it is a free program
developed in python language.
After transforming the characters into cartoons,
the face detection was applied again, as well as the en-
tire rest of the proposed method, as described in Sec-
tion 3.2, thus generating CCS for each character. Ta-
ble 3 presents some information regarding the trans-
formed and original characters. Firstly, for each char-
acter, we present (in the second column) the ground
truth value of perceived comfort regarding the origi-
nal character. Then, in the third column, we present
the result of our method CCS calculated for the orig-
inal character, and in the fourth column, the CCS for
transformed characters. The fifth and sixth columns
present data regarding the level of realism of the char-
acters, as perceived by the subjects (explained in Sec-
tion 3.1). It is interesting to notice that only char-
acters classified as moderately realistic, according to
human perception, show an increase in the computed
comfort score when transformed into a cartoon. The
exception is the character (i), which is considered un-
realistic, and the comfort score lightly increases. Very
realistic characters have a reduced computed comfort
score because there is a reduction in realism. This
fact is in line with the literature (MacDorman and
Estimating Perceived Comfort in Virtual Humans based on Spatial and Spectral Entropy
441
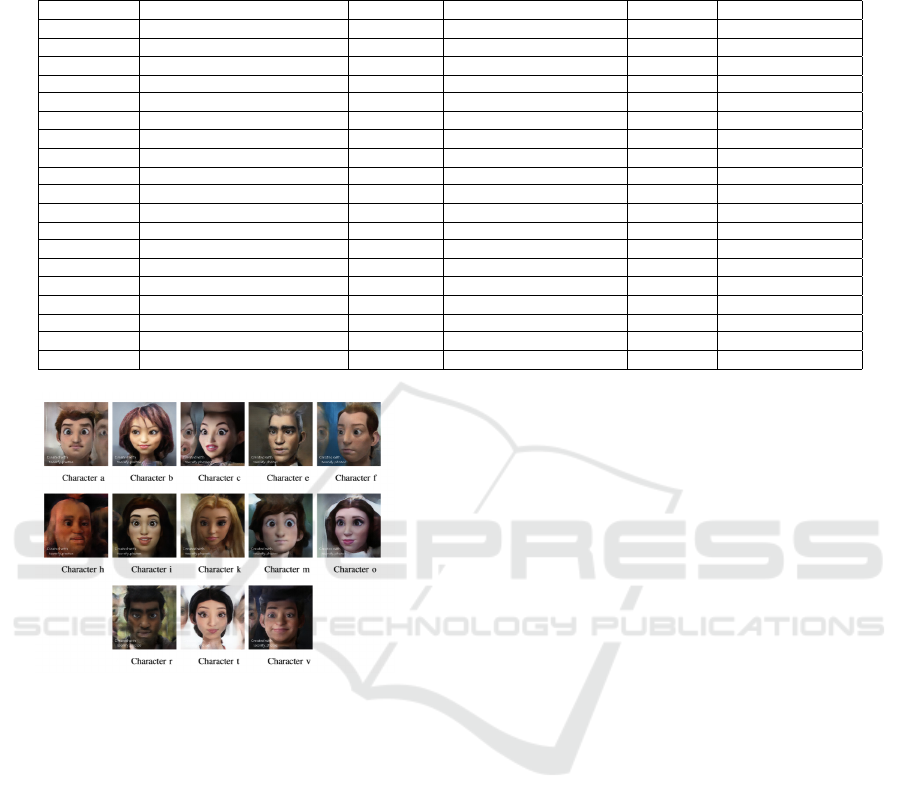
Table 3: Evaluation of 19 Characters from Figure 1, according to following attributes: the subject evaluation, calculated CCS,
transformed in cartoons and having CCS again, and finally the level of realism. Characters in bold represent the ones that
cause strangeness in the human perception.
Character Perceived Comfort (%) CCS (%) CCS (Cartoons) (%) Realism Group Realism
a 41.176 60.25 69.53 2.084 Moderately
b 68.908 61.97 61.61 2.504 Very
c 26.891 59.34 59.70 1.655 Moderately
d 84,87 86.91 - 1.235 Unrealistic
e 65.546 55.04 61.26 1.756 Moderately
f 35.294 44.52 61.35 1.915 Moderately
g 52.1 100 - 1.109 Unrealistic
h 73.109 74.56 59.88 2.546 Very
i 24.37 57.3 58.56 1.386 Unrealistic
k 91.597 73.62 61.68 2.781 Very
l 37.81 61.38 - 2.100 Moderately
m 88.235 64.53 59.98 1.436 Unrealistic
n 71.43 100 - 1.563 Moderately
o 92.437 83.13 61.09 2.672 Very
p 92.437 73.98 - 2.731 Very
r 81.513 100 61.47 2.722 Very
s 89.08 93.51 - 1.436 Unrealistic
t 85.714 60.77 56.28 2.798 Very
v 79.832 59.71 58.40 2.605 Very
Figure 4: The 13 characters shown in Figure 1 that have
been turned into cartoons.
Chattopadhyay, 2016) which indicates a reduction in
the comfort of cartoon characters compared to realis-
tic characters. Characters a, c, e, and f are classified
as moderately realistic. When transformed into car-
toons, the comfort scores of characters a, c and f had
comfort scores increased and above our threshold of
60%, which means that they became more comfort-
able in human perception. Characters b, h, k, o, r,
t, and v, considered very realistic, had a reduction in
CCS when transformed in cartoons. Indeed, it agrees
with MacDorman (MacDorman and Chattopadhyay,
2016) studies. Figure 3 shows the perceived comfort
and calculated CCS for original and transformed char-
acters. It is interesting to note that when our method
is applied to cartoon characters, the values obtained
of computed comfort are more similar to each other
than the original characters, which makes sense since
they now have the same realism level. If we look at
comfort averages, the group of moderately realistic
characters was the only one that increased average
comfort (42.226% before and 62.96% after), while
the unrealistic (60.91% before and 59,27% after) and
very realistic (with 81.872% before and 60.058% af-
ter) groups decreased their comfort scores.
5 FINAL CONSIDERATIONS
We proposed a model for estimating the comfort a
specific CG face should cause in humans’ percep-
tion. We were inspired by known methods in the lit-
erature that uses spatial and spectral entropy to esti-
mate image quality (Liu, 2010). We introduced CCS
as the computed comfort score and tested the same
models to check for evidence of accuracy, constantly
confronting results with subjects’ opinions. We ob-
tained an accuracy of 80% when using CCS to clas-
sify the characters in a binary classification (com-
fort/discomfort) and a MAE of 23.59% when com-
paring the percent values. In addition, we answer both
questions posed in this work regarding the realism of
characters. Firstly: ”Turning realistic characters into
cartoons decreases comfort?” The answer is yes, real-
istic cartoons have CCS decreased when transformed
into cartoons. This result is in line with Mac-Dorman
and Chattopadhyay (MacDorman and Chattopadhyay,
2016). The second question was ”Could the trans-
formation of characters, considered strange, into car-
toons increase comfort?” Again, the answer is yes.
Characters that cause more strangeness in human per-
ception (in our case, moderately realistic characters)
had their CCS increased when transformed into car-
toons. The possibility of using our computed comfort
VISAPP 2022 - 17th International Conference on Computer Vision Theory and Applications
442

scoring model (CCS) to assist in creating characters
that cause comfortable perception seems valid. How-
ever, more tests are needed since we only tested on 19
characters and 5730 images. However, it is essential
to note that the ground truth is formed by the subjects’
opinions, making this a real challenge in our work.
REFERENCES
Araujo, V., Dalmoro, B., and Musse, S. R. (2021). Anal-
ysis of charisma, comfort and realism in cg charac-
ters from a gender perspective. The Visual Computer,
37(9):2685–2698.
Bailenson, J. N., Swinth, K., Hoyt, C., Persky, S., Di-
mov, A., and Blascovich, J. (2005). The independent
and interactive effects of embodied-agent appearance
and behavior on self-report, cognitive, and behavioral
markers of copresence in immersive virtual environ-
ments. Presence: Teleoperators & Virtual Environ-
ments, 14(4):379–393.
Chaminade, T., Hodgins, J., and Kawato, M. (2007). An-
thropomorphism influences perception of computer-
animated characters’ actions. Social cognitive and af-
fective neuroscience, 2(3):206–216.
Dal Molin, G. P., Nomura, F. M., Dalmoro, B. M.,
de A. Ara
´
ujo, V. F., and Musse, S. R. (2021). Can
we estimate the perceived comfort of virtual human
faces using visual cues? In 2021 IEEE 15th Inter-
national Conference on Semantic Computing (ICSC),
pages 366–369.
Dalal, N. and Triggs, B. (2005). Histograms of oriented
gradients for human detection. In 2005 IEEE com-
puter society conference on computer vision and pat-
tern recognition (CVPR’05), volume 1, pages 886–
893. IEEE.
Flach, L. M., de Moura, R. H., Musse, S. R., Dill, V., Pinho,
M. S., and Lykawka, C. (2012). Evaluation of the un-
canny valley in cg characters. In Proceedings of the
Brazilian Symposium on Computer Games and Dig-
ital Entertainmen (SBGames)(Brasi
`
ılia), pages 108–
116.
Gouskos, C. (2006). The depths of the un-
canny valley. DOI= http://uk. gamespot.
com/features/6153667/index. html.
Howse, J. (2013). OpenCV computer vision with python.
Packt Publishing Ltd.
Hyde, J., Carter, E. J., Kiesler, S., and Hodgins, J. K. (2016).
Evaluating animated characters: Facial motion magni-
tude influences personality perceptions. ACM Trans-
actions on Applied Perception (TAP), 13(2):8.
K
¨
atsyri, J., F
¨
orger, K., M
¨
ak
¨
ar
¨
ainen, M., and Takala, T.
(2015). A review of empirical evidence on differ-
ent uncanny valley hypotheses: support for perceptual
mismatch as one road to the valley of eeriness. Fron-
tiers in psychology, 6:390.
K
¨
atsyri, J., M
¨
ak
¨
ar
¨
ainen, M., and Takala, T. (2017). Test-
ing the ’uncanny valley’ hypothesis in semirealis-
tic computer-animated film characters: An empirical
evaluation of natural film stimuli. International Jour-
nal of Human-Computer Studies, 97:149–161.
Liu, J. (2010). Fuzzy modularity and fuzzy community
structure in networks. Eur. Phys. J. B., 77:547–557.
Liu, L., Liu, B., Huang, H., and Bovik, A. C. (2014).
No-reference image quality assessment based on spa-
tial and spectral entropies. Signal Processing: Image
Communication, 29(8):856–863.
MacDorman, K. F. and Chattopadhyay, D. (2016). Reduc-
ing consistency in human realism increases the un-
canny valley effect; increasing category uncertainty
does not. Cognition, 146:190–205.
MacDorman, K. F., Coram, J. A., Ho, C.-C., and Patel, H.
(2010). Gender differences in the impact of presen-
tational factors in human character animation on de-
cisions in ethical dilemmas. Presence: Teleoperators
and Virtual Environments, 19(3):213–229.
Mori, M. (1970). Bukimi no tani [the uncanny valley]. En-
ergy, 7:33–35.
Prakash, A. and Rogers, W. A. (2015). Why some hu-
manoid faces are perceived more positively than oth-
ers: effects of human-likeness and task. International
journal of social robotics, 7(2):309–331.
Rosebrock, A. (2017). Facial landmarks with dlib opencv
and python-pyimagesearch. PyImageSearch.
Shahid, M., Rossholm, A., L
¨
ovstr
¨
om, B., and Zepernick,
H.-J. (2014). No-reference image and video quality
assessment: a classification and review of recent ap-
proaches. EURASIP Journal on image and Video Pro-
cessing, 2014(1):40.
Sponring, J. (1996). The entropy of scale-space. In Pro-
ceedings of 13th International Conference on Pattern
Recognition, volume 1, pages 900–904. IEEE.
Tinwell, A., Grimshaw, M., Nabi, D. A., and Williams, A.
(2011). Facial expression of emotion and perception
of the uncanny valley in virtual characters. Computers
in Human Behavior, 27(2):741–749.
Tumblin, J. and Ferwerda, J. A. (2001). Applied percep-
tion. IEEE Computer Graphics and Applications,
21(5):20–21.
Van der Walt, S., Sch
¨
onberger, J. L., Nunez-Iglesias, J.,
Boulogne, F., Warner, J. D., Yager, N., Gouillart, E.,
and Yu, T. (2014). scikit-image: image processing in
python. PeerJ, 2:e453.
Viola, P. and Jones, M. (2001). Rapid object detection us-
ing a boosted cascade of simple features. In Proceed-
ings of the 2001 IEEE computer society conference on
computer vision and pattern recognition. CVPR 2001,
volume 1, pages I–I. IEEE.
Von Bergen, J. (2010). Queasy about avatars and hiring
employees.
Zell, E., Zibrek, K., and McDonnell, R. (2019). Percep-
tion of virtual characters. In ACM SIGGRAPH 2019
Courses, pages 1–17.
ˇ
Zuni
´
c, J., Hirota, K., and Rosin, P. L. (2010). A hu mo-
ment invariant as a shape circularity measure. Pattern
Recognition, 43(1):47–57.
Estimating Perceived Comfort in Virtual Humans based on Spatial and Spectral Entropy
443
