
Rethinking Traffic Management with Congestion Pricing and
Vehicular Routing for Sustainable and Clean Transport
Meghana Kshirsagar
1a
, Tanishq More
2
, Rutuja Lahoti
2
, Shreya Adgaonkar
3
, Shruti Jain
3
and Conor Ryan
1
1
Biocomputing and Developmental Systems Research Group, University of Limerick, Ireland
2
Department of Information Technology, Government College of Engineering, Aurangabad, India
3
Department of Computer Science, Government College of Engineering, Aurangabad, India
Keywords: Deep Learning, Ensemble Learning, Object Detection, Routing Algorithm, Xai, Explainable Ai, Transfer
Learning, Energy Efficiency.
Abstract: Rapid growth in vehicular congestion increases the challenges of traffic management concerning pollution
and infrastructure. Efficient traffic governance can have a significant impact on a country’s economy. To
alleviate these challenges, we propose an intelligent integrated traffic management system that manages
congestion through cost pricing models to achieve smooth traffic flow. We propose a novel rerouting
algorithm and ensemble architecture for vehicle detection and classification, tested on live traffic captured in
several Indian cities. The ensemble architectures are designed on a combination of existing pre-trained
models. Choice of the ensembles is based on accuracy, model interpretability, and energy efficiency. We
show that the second-best ensemble produced operates with significantly less energy and better explainability
than our best performer and is still within 3% accuracy of the best performer. Based on predefined road
priorities, these ensemble models provide traffic and individual vehicle counts, further fed to our proposed
rerouting algorithm as input. The rerouting algorithm then recommends alternative routes and estimated
journey time to the user. The paper also presents the results obtained by testing the models on real-time traffic
videos from Aurangabad (India) on a GPU/CPU cluster consisting of machines incorporating different GPU
hardware.
1 INTRODUCTION
Vehicle rerouting is emerging to be a very effective
solution for managing congestion resulting from
vehicular traffic movements on roads. Our previous
work, GREE-COCO (Kshirsagar et al., 2021)
provides solutions to congestion control through the
design of cost pricing models. This paper presents an
ensemble architecture that divides traffic into five
classes (car, truck, motorcycle, bicycle, bus).
Classifying Motorcycle and bicycle are prominent in
this situation because the dataset is of an Asian
country, where the majority of vehicles includes
motorcycles. Thus, making this first to give a major
focus on classification of motorcycles. Based on the
traffic counts obtained from the ensembles, the
rerouting algorithm displays optimal routes based on
the user selection from a choice of options that
a
https://orcid.org/0000-0002-8182-2465
includes minimal cost, distance, or time. Our dataset,
named as GREECOCO, consists of around 1,101
videos of real-time traffic data of Aurangabad city,
generated specifically for this work. Building high-
quality ensembles requires significant expertise, such
as choosing the suitable base models (Casado-García
a n d H e r a s , 2 0 2 0 ) , a n d k n o w i n g h o w t o t r a i n t h e m
and combine their outputs, because ensembles may
result in lower accuracy than individual models. The
contributions for the paper are:
1.
Ensemble architectures based on a combination of
pre-trained models for object detection.
2.
The GREECOCO dataset having more live traffic
instances for the motorbike class. This is the first
time, a dataset is trained on a large number of
instances for the vehicle motorbike class.
3.
The Vehicle Assistance Rerouting System (VARS)
algorithm to recommend alternative routes to
users at the start of a journey.
420
Kshirsagar, M., More, T., Lahoti, R., Adgaonkar, S., Jain, S. and Ryan, C.
Rethinking Traffic Management with Congestion Pricing and Vehicular Routing for Sustainable and Clean Transport.
DOI: 10.5220/0010830300003116
In Proceedings of the 14th International Conference on Agents and Artificial Intelligence (ICAART 2022) - Volume 3, pages 420-427
ISBN: 978-989-758-547-0; ISSN: 2184-433X
Copyright
c
2022 by SCITEPRESS – Science and Technology Publications, Lda. All rights reserved

2 RELATED WORKS
Vehicular route guidance is responsible for assigning
an optimal route to every vehicle from source to
destination. Various criteria like shortest path,
minimal travel time, and most minor usage of local
paths are considered for finding the optimal route.
The traditional routing algorithms focused only on
road network features rather than real-time data or
predictive analysis. The literature experiments to
create route guidance strategies that effectively find
shortest paths for given source-destination pairs with
consideration of maintaining stability even when road
networks are extensive and dynamic.
The authors proposed an ensemble model with
transfer learning and training using the YOLOv3
algorithm and transfer model on a pre-trained COCO
dataset. The ensemble bagging technique is used as
the final classifier to choose the best model, which
results in the reduction of the training dataset and
training time(Liu et al., 2017). (Lee et al., 2018)
studied different CNN models for object detection,
and, have proposed model selection and box voting
methods in an ensemble approach of two-stage
detectors for enhancing the accuracy in the object
detection.(Pan et al., 2013) presents five traffic
rerouting strategies. The proposed strategies
dynamically compute customized routes based on the
traffic congestion present on the road.
3 ARCHITECTURE OF
INTELLIGENT
TRANSPORTATION SYSTEM
This research work is an extension to previous work
for improving the deployability of the GREE-COCO
system (Kshirsagar et al., 2021) through the design of
a Vehicle Assistance Rerouting System (VARS). The
VARS will allow a user to get a route from point A to
point B, considering the three factors: distance,
congestion charge and traffic count. The GREE-
COCO system outputs the two deciding factors, i.e.,
Congestion charge and traffic count, which act as
inputs to the VARS. The vehicle count for each
vehicle type is stored in a database. Based on this
vehicle count, congestion charge is calculated, which
the user has to pay to use the particular road. The
authors have revised the vehicle classification model
with ensemble models to support the VARS for
receiving accurate vehicle count. The VARS will
display two optimal routes to the user. These routes
can be fetched using a web or a mobile application.
The entire system can be observed in Figure 1.
3.1 Ensemble Model Building
This section will illustrate the process of building and
selecting the ensembles used in our experiments.
3.1.1 Transfer Learning
Transfer learning uses features learned by a model
that is trained on a massive dataset. In this work, we
have used pre-trained models with ImageNet weights.
By incorporating transfer learning, we save training
time and eliminate the need for a massive dataset
required for training a neural network.
3.1.2 Model Selection for Ensemble
An ensemble is made up of discretely trained
classifiers (such as neural networks or random forest)
whose predictions are merged when classifying
unique instances. In our proposed work, the
ensembles consist of pre-trained models for learning
features of the input data. Here, 8 pre-trained models,
namely, VGG16 (Simonyan and Zisserman, 2014),
VGG19 (Simonyan and Zisserman, 2014),
MobileNetV2 (Mohapatra et al., 2021), ResNet152
(Mohapatra et al., 2021), InceptionResNetV2
(Szegedy et al., 2017), DenseNet121 (Huang et al.,
2017), Inception V3 (Szegedy et al., 2016) and
Xception (Chollet, 2017), with imageNet pre-trained
weights are used as learners in different
combinations. We tested three Ensembles, namely, A,
B, and C, where Ensemble A was the combination of
VGG16, VGG19, and MobileNetV2; Ensemble B
consisted of ResNet152, InceptionResNetV2, and
DenseNet121, and Ensemble C consisted of VGG16,
Inception V3, and Xception. The Ensemble A model
consists of relatively fewer layers than those in
Ensembles B and C. This was considered to compare
the results and the effect due to the increased number
of layers. The ensemble model’s selection depends on
the accuracy and efficiency of the model in terms of
energy. To preserve the initially learned features,
70% of the layers were frozen in each model and
merged. This, in turn, reduces the computational time
and energy required while training the model. The
second last layer of the model’s output was integrated
into one layer and then fed to an output layer with the
Softmax activation function (Goodfellow et al., 2016)
with the five output neurons as described in Figure 2.
Softmax is a mathematical function that converts a
Rethinking Traffic Management with Congestion Pricing and Vehicular Routing for Sustainable and Clean Transport
421
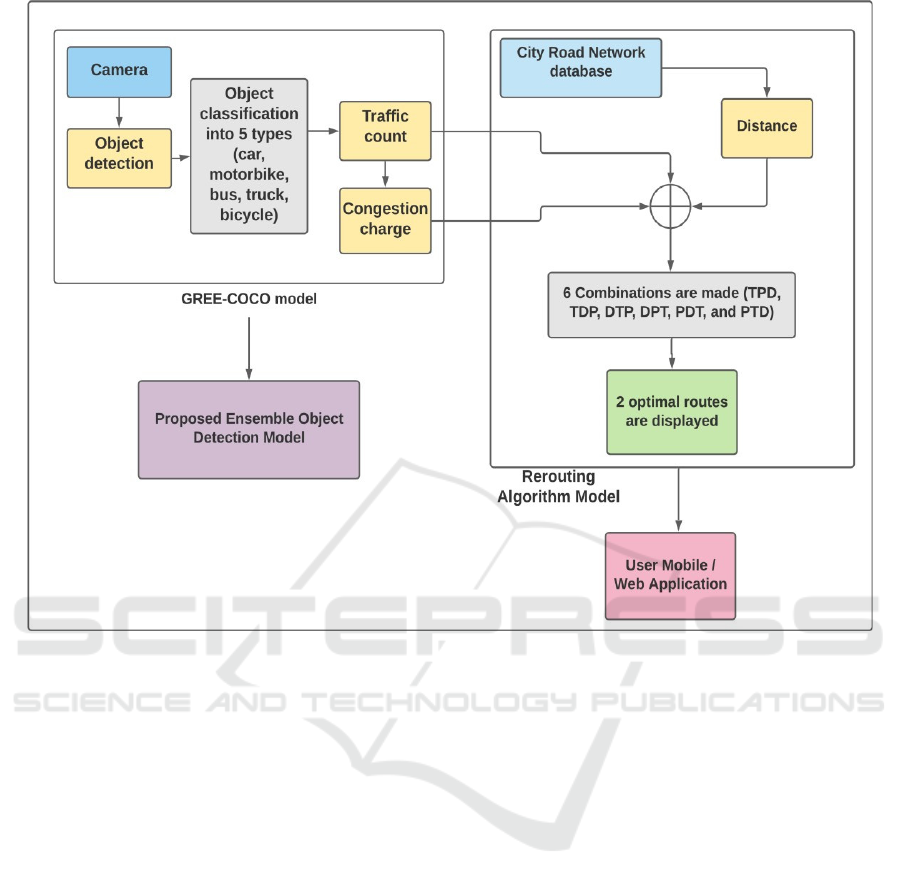
Figure 1: Architecture of the Smart Transportation System.
numeric vector into a probability vector. Adam
(Kingma and Ba, 2014) is a stochastic gradient
descent replacement optimization algorithm for
training deep learning models. The Adam optimizer
was initiated with a learning rate of 0.0001 to compile
the model.
3.2 Dataset Details
To produce a model that can successfully classify the
vehicles in different seasons and at different time
periods, it is necessary to train a model with a large
number of images, as well as with images that signify
the various traffic volumes. Moreover, sufficient
validation images are essential to test the model and
adjust its weights. To train the ensemble model, we
primarily used two significant datasets; firstly, the
MIO- TCD dataset: Vehicle classification dataset
available at kaggle.com and secondly, the Car dataset
provided by the University of Stanford. Altogether,
the total number of images for the vehicle’s classes
were Bus: 10,316, Car: 10518, Motorbike: 8082,
Bicycle: 7995 and Truck: 8500. In this paper, we
introduce a real-time video dataset, GREECOCO
(https://github.com/tanishq-1011/Rethinking-
Traffic-Management-with-Congestion-Pricing-and-
Vehicular-Routing) that includes 1011 videos of
varying time duration such as 350 videos of 5
seconds, 268 videos of 10 seconds, 184 videos of 15
seconds, 149 videos of 30 seconds, 49 videos of 1
minute, five videos of 5 minutes, five videos of 10
minutes and two videos of 20 minutes. In each sample
of 20 minutes, approximately 1385 cars, six buses, 58
trucks, 1212 motorcycles and 32 bicycles were
detected. Similarly, in a video sample of 10 minutes,
on average, 374 cars, 31 buses, 76 trucks, 272
motorbikes, and six bicycles were detected. The
videos from the dataset are shot on different priority
roads from Aurangabad city, such as Jalna road (A
Priority - heavy traffic), Kalda corner road (B priority
- moderate traffic), and Shreya Nagar road (C priority
- low traffic). The videos are shot at various times
during the afternoon and evening to ensure fair
learning in periodic intervals of the day. These
samples had 300 raw night time videos and 40 natural
daytime videos, further augmented to get our dataset
of 1011 videos.
ICAART 2022 - 14th International Conference on Agents and Artificial Intelligence
422
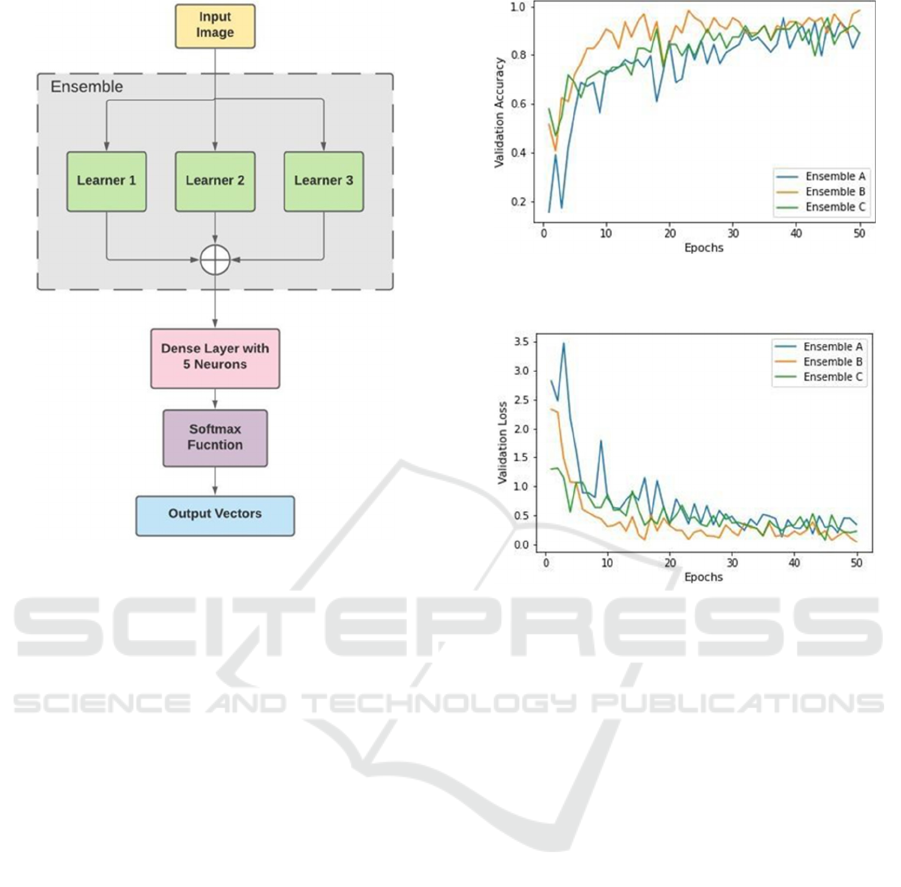
Figure 2: Architecture of Ensemble models.
3.3 Hyperparameter Tuning for the
Ensembles
The hyperparameter which initially needs to be tuned
is the neuron count, which was experimented in the
range [32,1024]. The activation function for the final
output layer was Softmax consisting of the five
neurons depicting each vehicle class. Whereas,
between the layers, the Relu activation function was
used. In the proposed system, we make use of the
Adam optimizer. The learning rate was initially set to
0.001 and eventually decayed by a value of 0.5 after
every ten epochs. The models were trained for 50
epochs each. The layer count varied as per the pre-
trained models from 4 to 600. Two levels of
regularization were used to avoid overfitting; one at
the batch normalization layer to normalize the value
for each batch. The second regularization was at the
dropout level. Depending upon the number of
neurons, the value of the dropout rate was varied
from [0.2, 0.5]
3.4 Ensemble Results
In this section, we will discuss the performance of
our ensembles.
Figure 3: Validation accuracy of the ensembles on the
GREECOCO dataset.
Figure 4: Validation loss of the ensembles on the
GREECOCO dataset.
3.4.1 Model Validation on GREECOCO
Dataset
First, the dataset was split into three ratios, which are
70:30, 80:20, and 90:10 for training and testing the
individual learners and the ensemble models. This
strategy was essential to determine the effect of the
dataset’s split on the model’s accuracy and loss. It is
crucial to provide a model with sufficient testing
images to test its performance on unseen data
adequately. This plays a critical role when models are
to be deployed in real-world scenarios. The
validation accuracy and loss results of the ensembles
are shown in Table 1. Here, we can infer that, overall,
Ensemble B performed better than other ensembles
when the data split ratio was 80:20. Also, it can be
determined that all ensemble models performed
better when the dataset was divided in the proportion
80:20. Therefore, ensemble models trained on this
splitting strategy are considered for the further
testing purposes. Table 2 compares the individual
model of Ensembles A, B, and C, along with their
individual learners in terms of validation accuracy. It
is noticeable that all three ensembles performed
Rethinking Traffic Management with Congestion Pricing and Vehicular Routing for Sustainable and Clean Transport
423
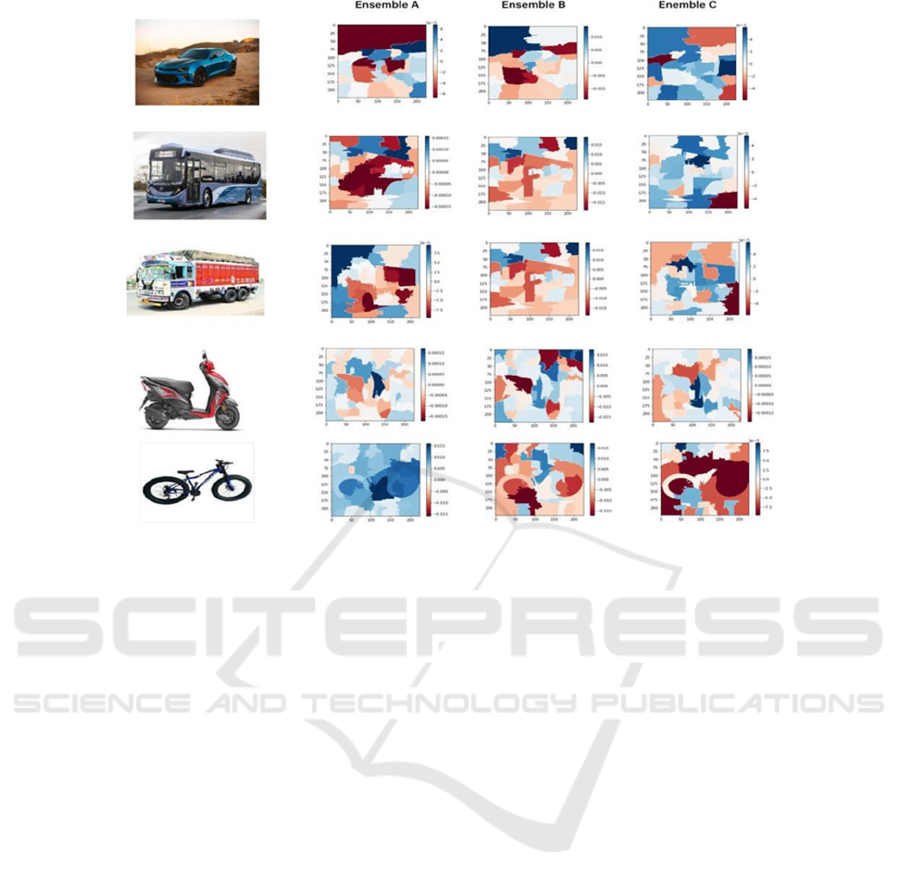
Figure 5: LIME results on the predictions of Ensembles A, B and C on the classes (a): Car, (b): Truck, (c): Bus, (d): Motorbike,
(e): Bicycle.
better than the individual learners. This validates
using an ensemble model over a single model. Figure
3 shows all the three ensembles’ training and
validation accuracy, while Figure 4 gives the training
and validation loss for all.
3.4.2 Model Validation on Benchmark
Dataset
The ensemble models were tested on two real-world
benchmark dataset: CIFAR10 and CIFAR100
(Krizhevsky et al., 2009) in addition to the
GREECOCO dataset. The CIFAR-10 dataset
comprises 60,000 colour images spread across ten
classes with 6000 images per class. The photos are of
the size 32x32. This dataset contains 50,000 training
images and 10,000 test images. The test batch
contains exactly 1000 randomly selected images from
each class. In this dataset, only two classes overlap
with the current work, i.e., car and truck. For testing
the ensembles, images from these two classes were
used.
The CIFAR-100 dataset has similar structure to
that of the CIFAR-10 dataset in that it has 100 classes
with 600 images each. Each class has 500 training
images and 100 testing images. The CIFAR-100’s
100 classes are divided into 20 super-classes. Each
image is labelled “fine” (the class to which it belongs)
and “coarse” (the super-class to which it belongs). We
have used four classes from the CIFAR-100 dataset
for testing purposes, as shown in Table 3 with the
respective class’s accuracy. Table 3 shows the
ensemble models’ accuracy results tested on
GREECOCO dataset, CIFAR10 and CIFAR100. The
values in the Table represent the percentage accuracy.
It can be inferred that, overall, Ensemble B performs
the best when compared to other models.
3.4.3 Model Interpretability with LIME
In many cases, a model may have good accuracy, may
have learned irrelevant features. In this work, we
make use of a framework called LIME (Locally
Interpretable Model-Agnostic Explanations) (Ribeiro
et al., 2016) which attempts to understand the model
by perturbing the input of data samples and
understanding how the predictions change. LIME
provides local data model interpretability. This
technique approximates any black box machine
learning model with a local, interpretable model to
explain each individual prediction. Predictions of
thirty instances of each class given by each of
Ensemble A, B, and C were tested using the LIME
framework as seen in Figure5. Figure 5 shows the
heat maps generated by the LIME framework.
ICAART 2022 - 14th International Conference on Agents and Artificial Intelligence
424
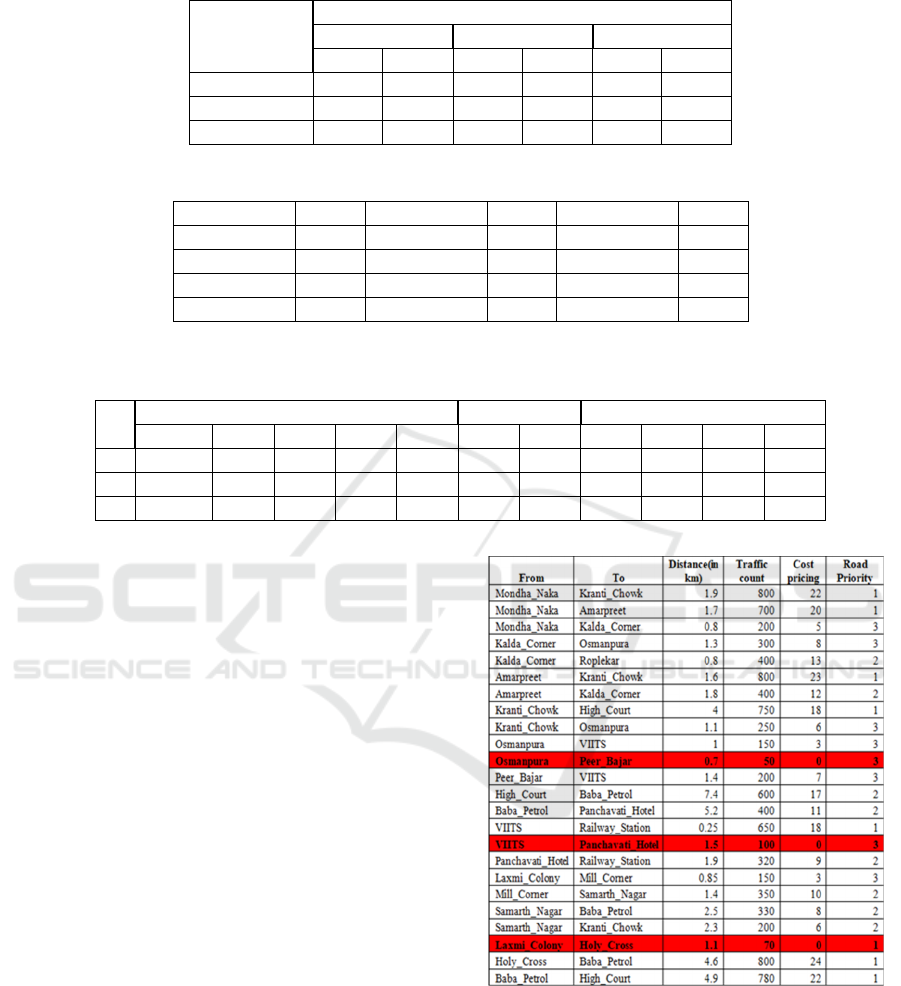
Table 1: Ensemble results on training data with different data split ratio.
Ensemble
Model
Dataset split ratio
90:10 80:20 70:30
Acc Loss Acc Loss Acc Loss
Ensemble A 0.968 0.116 0.953 0.141 0.968 0.163
Ensemble B 1.0 0.021 0.984 0.056 0.968 0.094
Ensemble C 1.0 0.08 0.953 0.087 0.96 0.15
Table 2: The performance of Ensemble A, B and C with its individual learners.
Model Acc Model Acc Model Acc
Ensemble A 0.953 Ensemble B 0.984 Ensemble C 0.953
VGG16 0.953 Densene
t
0.906 Xception 0.687
VGG19 0.945 Resne
t
0.93 Inceptionv3 0.952
MobileNe
t
0.875 I-Resnetv2 0.35 VGG16 0.943
Table 3: Comparative analysis of proposed dataset and Cifar 10 & Cifar 100 datasets. C: Car, T: Truck, B: Bus, BI: Bicycle
and, M: Motorbike.
GREECOCO dataset CIFAR 10
CIFAR 100
C
T
B
BI
M
C
T
T
B
BI
M
A
82%% 78% 75% 84% 65% 75% 71% 70% 65% 75% 84%
B
70% 89% 75% 84% 65% 54% 75% 76% 81% 62% 69%
C
70% 65% 75% 84% 65% 74% 70% 71% 72% 74% 77%
The heat maps demonstrate the regions which help
the models to predict a particular class. Here, the blue
areas positively contribute towards making
predictions while the red areas contribute negatively.
Thus, after analyzing the heat maps, we conclude that
Ensemble C outperformed Ensembles B and A on
classes Car, Bus and Truck, while Ensemble A
performed better for Motorbike and Bicycle class.
4 VEHICLE ASSISTANCE
REROUTING SYSTEM
The Vehicle Assistance Rerouting System Algorithm
1 considers three aspects while finding the optimal
routes, i.e., traffic count, congestion charge &
distance. These aspects also work as filters. The
rerouting algorithm outputs two optimal ways for the
user. The user can then choose any one of the routes
to travel. The rerouting algorithm was tested on a
database (shown in Figure 6), which consists of a
portion of Aurangabad city’s road network. The
rerouting algorithm satisfies the following
constraints: 1) If traffic count for a particular edge
exceeds 1500, that edge will not be considered. 2) The
traffic of high-priority roads must not be directed
towards low-priority roads. Out of the three filters
(traffic count, price & distance), six combinations are
Figure 6: Rerouting dataset.
made: TPD, TDP, DTP, DPT, PDT, and PTD,
where T, P, and D stand for traffic count, congestion
charge and distance, respectively. Out of these six
combinations, the user can select the most
appropriate combination for their requirements.
Rethinking Traffic Management with Congestion Pricing and Vehicular Routing for Sustainable and Clean Transport
425
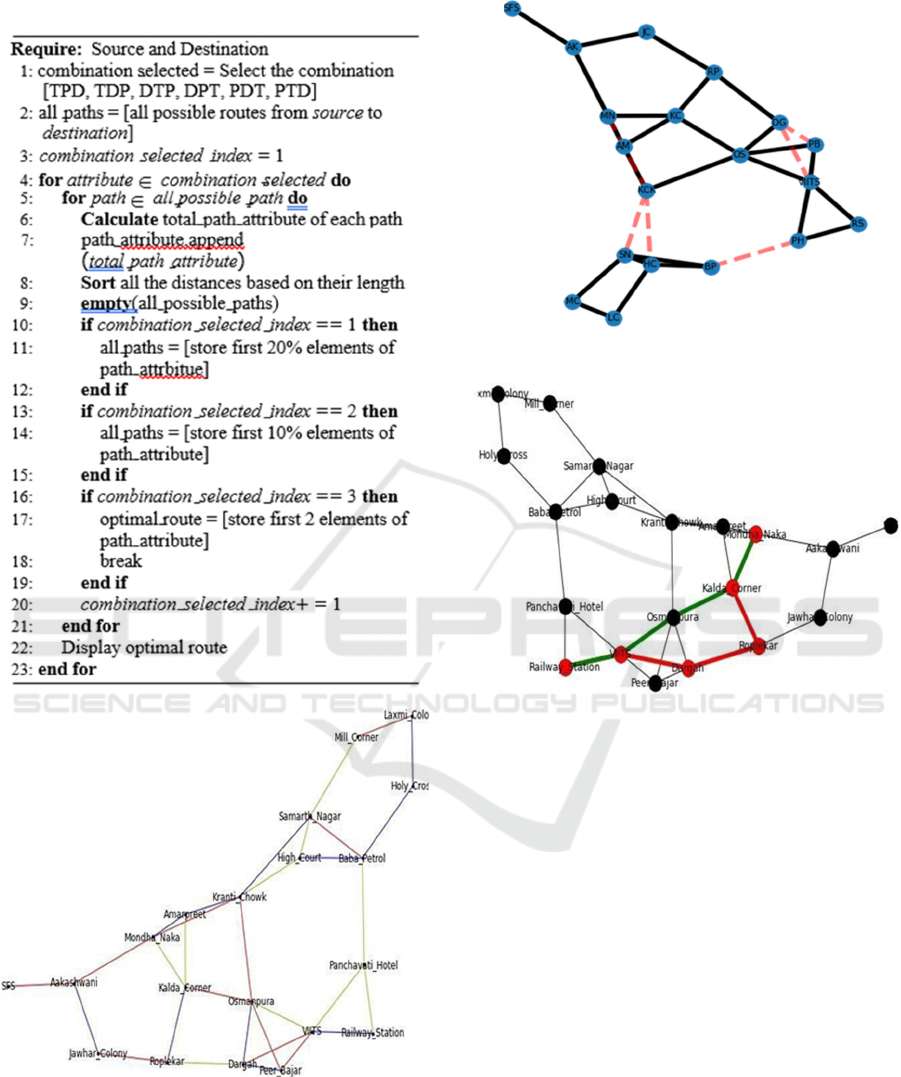
Algorithm 1: Priority based optimal path finder.
Figure 7: Connected Road Network Based on Road Priority
Edges (red): A Priority, (blue): B Priority, (green): C
Priority.
Figure 8: Road Network Showing inactive edges.
Figure 9: Adaptive routes based on traffic count.
4.1 Rerouting Model Dataset
In Figure 7, 8 and 9, the nodes signify the locations,
and the edges indicate the path between the two
locations. Each edge has four attributes: road
priority, distance, congestion charge, and traffic
count. Our system dynamically updates the traffic
count and congestion price attributes every thirty
minutes.
4.2 Rerouting Model Results
We tested our model on 45 road instances of
Aurangabad city. Figure 7 depicts the connected
road network of the central Aurangabad region,
where the red edge represents A (high) priority
roads, a blue edge represents B (medium) priority
roads, and the green edge represents C (low) priority
roads. In Figure 8 the road network is transformed
into a graph. Where the dashed line indicates static
road routes. If the traffic count for a particular edge
ICAART 2022 - 14th International Conference on Agents and Artificial Intelligence
426

exceeds 1500, that edge will not be considered for
rerouting. The graph in Figure 9 displays the two
optimal routes shown in the colour red and green for
Railway Station to Mondha Naka, which can
adaptively be changed to different routes based on
the traffic count.
5 CONCLUSION
The research work proposes an integrated intelligent
traffic management system for traffic congestion
management through the design of ensemble
architectures. Three different ensemble
architectures incorporating a combination of pre-
trained models are designed for vehicle detection
and classification. The ensembles are made up of
three pre-trained learners selected to differ in the
number of layers significantly. For diverse hardware
platforms, the pre-trained models of varying sizes
can be altered. This drastically narrows the energy
needed to train each specialized neural network for
novel platforms.
The layer count difference provides valuable
insights for comparing the ensembles concerning the
accuracy and the computational energy required to
train them. Furthermore, the ensembles are judged on
three criteria: accuracy, interpretability, and energy
efficiency. Although Ensemble B has greater
accuracy than the others, the results depict it fails to
learn relevant features, and it incurs much
computational overhead during training. On the other
hand, the accuracy of Ensemble C is only 2.9% less
than that of Ensemble B. However, the explainability
results prove that Ensemble C has learned the
essential features needed to classify the objects
correctly. Moreover, Ensemble C consumed the least
computational power during training. Therefore, we
conclude that Ensemble C is the best model among
the three ensembles. The traffic count from the
ensemble models facilitates the VARS system to
make recommendations of alternative routes to the
user before starting a journey. The route’s choice is
based on the user’s priorities from a set of parameters
comprising distance, time, and trip cost.
Implementing such an intelligent traffic management
system can lead to improved mobility, safety, air
quality, productivity, and information in the future
resulting from large-scale analysis of real- time traffic
data. Moreover, we reduce the carbon footprint of the
neural network through our ensemble architecture,
thus aiming for greener neural networks.
REFERENCES
Casado-García, Á. and Heras, J. (2020). Ensemble methods
for object detection. pages 2688–2695.
Chollet, F. (2017). Xception: Deep learning with depthwise
separable convolutions. In Proceedings of the IEEE
conference on computer vision and pattern recognition,
pages 1251–1258.
Goodfellow, I., Bengio, Y., Courville, A., and Bengio, Y.
(2016). Deep learning, volume 1. MIT press
Cambridge.
Huang, G., Liu, Z., Van Der Maaten, L., and Weinberger,
K. Q. (2017). Densely connected convolutional
networks. In Proceedings of the IEEE conference on
computer vision and pattern recognition, pages 4700–
4708.
Kingma, D. P. and Ba, J. (2014). Adam: A method for
stochastic optimization. arXiv preprint
arXiv:1412.6980.
Krizhevsky, A., Hinton, G., et al. (2009). Learning multiple
layers of features from tiny images.
Kshirsagar, M., More, T., Lahoti, R., Adgaonkar, S., Jain,
S., Ryan, C., and Kshirsagar, V. (2021). Gree-coco:
Green artificial intelligence powered cost pricing
models for congestion control.
Lee, J., Lee, S.-K., and Yang, S.-I. (2018). An ensemble
method of cnn models for object detection. In 2018
International Conference on Information and
Communication Technology Convergence (ICTC),
pages 898–901. IEEE.
Liu, X., Liu, Z., Wang, G., Cai, Z., and Zhang, H. (2017).
Ensemble transfer learning algorithm. IEEE Access,
6:2389–2396.
Mohapatra, S., Abhishek, N., Bardhan, D., Ghosh, A. A.,
and Mohanty, S. (2021). Comparison of mobilenet and
resnet cnn architectures in the cnn-based skin cancer
classifier model. Machine Learning for Healthcare
Applications, pages 169–186.
Pan, J., Popa, I. S., Zeitouni, K., and Borcea, C. (2013).
Proactive vehicular traffic rerouting for lower travel
time. IEEE Transactions on vehicular technology,
62(8):3551–3568.
Ribeiro, M. T., Singh, S., and Guestrin, C. (2016). “why
should I trust you? explaining the predictions of any
classifier”. In Proceedings of the 22nd ACM SIGKDD
international conference on knowledge discovery
anddata mining, pages 1135–1144.
Simonyan, K. and Zisserman, A. (2014). Very deep
convolutional networks for large-scale image
recognition. arXiv preprint arXiv:1409.1556.
Szegedy, C., Ioffe, S., Vanhoucke, V., and Alemi, A.
(2017). Inception-v4, inception-resnet and the impact
of residual connections on learning. In Proceedings of
the AAAI Conference on Artificial Intelligence, volume
31.
Szegedy, C., Vanhoucke, V., Ioffe, S., Shlens, J., and
Wojna, Z. (2016). Rethinking the inception architecture
for computer vision.In In Proceedings of the IEEE
conference on computer vision and pattern recognition,
pages 2818–2826.
Rethinking Traffic Management with Congestion Pricing and Vehicular Routing for Sustainable and Clean Transport
427
