
Detecting Patches on Road Pavement Images Acquired with 3D Laser
Sensors using Object Detection and Deep Learning
Syed Ibrahim Hassan
1 a
, Dympna O’sullivan
1 b
, Susan Mckeever
1 c
, David Power
2
,
Ray Mcgowan
2
and Kieran Feighan
2
1
Department of Computer Science, Technological University, Dublin, Ireland
2
Pavement Management Services Ltd., Ireland
Keywords:
Road Pavement Inspection, Object Detection, Patch Detection, 3D Laser Profile Images, Deep Learning.
Abstract:
Regular pavement inspections are key to good road maintenance and detecting road defects. Advanced pave-
ment inspection systems such as LCMS (Laser Crack Measurement System) can automatically detect the
presence of simple defects (e.g. ruts) using 3D lasers. However, such systems still require manual involve-
ment to complete the detection of more complex pavement defects (e.g. patches). This paper proposes an
automatic patch detection system using object detection techniques. To our knowledge, this is the first time
state-of-the-art object detection models (Faster RCNN, and SSD MobileNet-V2) have been used to detect
patches inside images acquired by 3D profiling sensors. Results show that the object detection model can
successfully detect patches inside such images and suggest that our proposed approach could be integrated
into the existing pavement inspection systems. The contribution of this paper are (1) an automatic pavement
patch detection model for images acquired by 3D profiling sensors and (2) comparative analysis of RCNN,
and SSD MobileNet-V2 models for automatic patch detection.
1 INTRODUCTION
Transport and road infrastructure departments per-
form regular inspections on pavements to assess the
surface condition. This surface condition can be
degraded by the presence of defects such as pot-
holes, cracking and rutting. These inspections are
used to make decisions about pavement maintenance
planning, including cost considerations (Koch and
Brilakis, 2011). Pavement inspection can be achieved
in two ways, either manually or automatically. Cur-
rent pavement inspection techniques typically con-
sist of three main steps: 1) data collection, 2) de-
fect identification, and 3) defect assessment. The first
step is largely automatic using specially adapted ve-
hicles; however, the other two steps are usually man-
ual. Manual pavement inspection relies on pavement
engineers or certified inspectors who assess pave-
ment surface conditions either through on-site sur-
veys or through images and data acquired through
pavement assessment vehicles. Based on engineers’
a
https://orcid.org/0000-0002-0480-989X
b
https://orcid.org/0000-0003-2841-9738
c
https://orcid.org/0000-0003-1766-2441
recommendations, government authorities can decide
which roads need maintenance, what maintenance
treatments to apply, and when to apply them. Manual
inspection is time-consuming and incurs high labour
costs, putting pressure on limited resources for pave-
ment inspection.
One way of capturing pavement condition data is
through the use of advanced pavement inspection sys-
tems such as the LCMS (Laser Crack Measurement
System) developed by Pavemetrics (Laurent et al.,
2012). Pavemetrics is a leading company that de-
velop sensors and software for pavement data collec-
tion vehicles. The LCMS system is composed of cus-
tom optics, and laser line projectors on the back of a
vehicle as seen in Figure 1. Each sensor takes 2080
transverse laser readings at a 1mm interval across the
width of a pavement. These readings are combined
to give a full transverse profile of a pavement sur-
face (up to 4.16 meters). These transverse profiles
can be collecting at varying intervals depending on
the speed of the survey vehicle. The data used in this
research has a transverse profile collected every 5mm.
A Range (the distance to pavement surface) and In-
tensity (the intensity of the returned laser) reading is
recorded for each laser reading which are then con-
Hassan, S., O’sullivan, D., Mckeever, S., Power, D., Mcgowan, R. and Feighan, K.
Detecting Patches on Road Pavement Images Acquired with 3D Laser Sensors using Object Detection and Deep Learning.
DOI: 10.5220/0010830000003124
In Proceedings of the 17th International Joint Conference on Computer Vision, Imaging and Computer Graphics Theory and Applications (VISIGRAPP 2022) - Volume 5: VISAPP, pages
413-420
ISBN: 978-989-758-555-5; ISSN: 2184-4321
Copyright
c
2022 by SCITEPRESS – Science and Technology Publications, Lda. All rights reserved
413

verted to images of the scanned surface. These are
called the Range Image and the Intensity Image (Fig-
ure 2). The Range data is good for detecting distresses
that are evident by a change in height, such as rut
depths, potholes, texture values and cracking. The in-
tensity data highlights different materials and picks up
objects like road markings and sealed cracking. Pave-
metrics has its own processing algorithms that use this
data to automatically detect distresses such as crack-
ing, potholes and patching. Patches are a common
pavement defect. Patches are used to provide a per-
manent restoration of the stability and quality of the
pavement, for example after installing, replacing, or
repairing underground utilities. Improperly installed
patches and deterioration of the surrounding pave-
ment, combined with challenging weather, can reduce
the life of a patch and turn patches into defects and
decrease the quality of a pavement.
The shape and quality of a patch can vary signifi-
cantly depending on the type of repair that is required.
Patches can be a temporary or a long term solution,
can use similar or different material to the existing
pavement, can cover a large area such as utility patch-
ing or cover a single pothole distress. The variety of
patching that is encountered is a huge challenge in de-
tecting pavement patches and often requires manual
involvement whereby engineers manually label/draw
bounding boxes around each patch.
In this study, we aim to address the patch detection
problem by answering the following research ques-
tion. “To what extent can object detection methods
accurately detect patches on images acquired using
3D laser profiling systems?” The dataset used in this
study was acquired from Pavement Management Sys-
tem (PMS) Ltd. PMS is a civil engineering consul-
tancy firm in Ireland, specializing in testing, evalua-
tion, and management of roads, airports, and ports.
2 RELATED WORK
Automatic pavement defect detection has attracted the
interest of many researchers and several studies pro-
pose various approaches to improve the current man-
ual visual inspection of pavements. 3D laser profiling
technology (Zhang et al., 2018) (Tsai and Chatterjee,
2018) is widely used in the assessment of pavement
surfaces which includes highways and airport run-
ways (Laurent et al., 2012) (Mulry et al., 2015). 3D
laser profiling technology such as LCMS provides de-
tailed information about pavement defects and auto-
matically detects pavement defects, including cracks,
raveling, rutting, roughness, etc. The detection of
pavement patches using LCMS requires manual in-
volvement and has not been significantly addressed.
The LCMS detects patching by finding areas of the
pavement that have similar smoothness (small vari-
ations in range data) and intensity that are different
to the surrounding pavement. This method of detec-
tion can have problems when it encounters bleeding
in the pavement surface, ravelling, areas of polished
aggregate, well installed patches using similar ma-
terial to the original pavement, brand new surfaces
and patches with sealed edges. Some researchers
propose different approaches to automatically detect
and localize pavement patches, but they use images
or videos acquired through conventional imaging de-
vices such as digital or smartphone cameras. How-
ever these common imaging devices are not com-
monly used in the professional pavement inspection
process. Therefore, it is necessary to build an auto-
matic patch detection system that can integrate into
the existing professional visual inspection systems.
For example, (Ajeesha and Kumar, 2016) propose an
automatic patch detection using an active contour seg-
mentation technique. The proposed method consists
of three main steps; 1) image pre-processing, 2) de-
tection of patches using active contour segmentation,
and 3) video tracking. In the first step, the image
is passed through multiple filters for image enhance-
ment and to remove unnecessary objects; in the sec-
ond step, patches from the intact pavement are seg-
mented using active contouring. Moreover, to trace
the patch in subsequent video frames, the detected
patches are passed to the kernel tracker to avoid de-
tection and report the patch only once. The pro-
posed method achieved an overall 82.75% precision
and 92.31% recall. Using traditional machine learn-
ing approach (Hadjidemetriou et al., 2018) propose a
method for the classification of patch and non-patch
images using Support Vector Machines (SVM). The
authors recorded road surface video frames using a
smartphone camera mounted inside and outside on
a vehicle. The method trains the SVM classifier to
distinguish patch and non-patch areas inside images.
The proposed classification system was evaluated on
video frames and achieved a detection accuracy of
87.3% and 82.5%, respectively.
Other techniques used in the automatic pavement
inspection process are based on the object detection
approach (Hassan et al., 2021). The goal of object
detection is to detect and localize pavement defects,
such as potholes, patches and cracks by drawing a
bounding box around the above defects. For exam-
ple, (Maeda et al., 2018) propose a multiple pavement
defect detection and localization system. The author
collected 9053 images using a smartphone camera
mounted on a vehicle windscreen. The proposed de-
VISAPP 2022 - 17th International Conference on Computer Vision Theory and Applications
414

fect detection system was trained with a state-of-the-
art object localization model with eight pavement de-
fects and achieves overall precision and recall 75%
using SSD MobileNet (Liu et al., 2016) and Inception
V2 (Szegedy et al., 2016).
The above research work utilizes images/videos
acquired through common imaging devices such as
smartphone cameras or digital cameras that are typ-
ically mounted on passenger vehicle. However, the
problem with conventional imaging devices is that
the images acquired through these devices are often
affected by weather conditions, lighting effects, and
shot angle. However, advanced pavement inspection
systems such as LCMS have the capability to acquire
images with consistent lighting and shot angles and
can operate effectively both in daylight and night.
Using 3D laser profiling data, different methods
have been proposed for automatic pavement defect
detection. For example, (Zhang et al., 2018) pro-
pose an automatic pavement defect detection method
by utilizing 3D laser scanned pavement data. The
proposed approach was developed to detect pavement
cracks and pavement deformation defects. Their re-
sults show that using 3D laser scanning data, pave-
ment defects can be effectively detected with an over-
all detection accuracy of 98%. (Mathavan et al., 2014)
proposed a method for automatic detection and quan-
tification of pavement raveling using synchronized in-
tensity and range images. The author adopted im-
age processing techniques to segment the pavement
surface from painted areas like road markings. The
overall results show that the proposed method can dif-
ferentiate and quantify pavement areas that may con-
sist of raveling. In attempt to detect potholes using
3D pavement data, (Tsai and Chatterjee, 2018) pro-
posed an automatic pothole detection using 3D range
data by applying a watershed segmentation method
(Roerdink and Meijster, 2000), the proposed method
achieved 94.79% detection accuracy, 90.80% preci-
sion and 98.75% recall.
The cited research on pavement defect detection
utilizes object localizing and image processing tech-
niques to detect different types of pavement defects.
However, the detection of pavement patches has not
been significantly addressed especially on images that
acquired using LCMS technology. The current LCMS
system can automatically detect patches but still face
challenges where it cannot draw a bounding box
around the detected patch. Inspired by the object lo-
calization technique, we propose an object detection
approach in the pavement patch detection domain that
can further automate patch detection process using
LCMS.
The following sections discusses the proposed ap-
proach, experimental implementation, results, discus-
sion, and conclusion
3 METHODOLOGY
This paper proposes a method for automatically de-
tecting the presence and location of pavement patches
in images acquired using 3D laser profiling systems.
We consider this problem as an object detection task
because we aim to detect and localize each patch by
drawing a bounding box around the patch. In addi-
tion to identifying individual patches, road mainte-
nance requires an estimate of the size and proportion
of patched surface on a length of pavement. By us-
ing object detection with bounding boxes, we can de-
tect box coordinates to determine scaled area of an
individual patch. We can then determine the total
patches area for input images covering the pavement
section. Using a supervised machine learning tech-
nique, we have trained two state-of-the-art object de-
tection models - Faster RCNN (Ren et al., 2016) and
SSD MobileNet V2 (Sandler et al., 2018), using two
image types and compare the detection results of both
models across range and intensity images. This sec-
tion will describe the complete process of the auto-
matic pavement patch detection approach including a
description of the dataset and implementation details
of the object detection models.
3.1 Dataset
This research utilizes asphalt pavement images ac-
quired using the LCMS (Laser Crack Measurement)
system. LCMS takes images of pavements with high-
speed, high-resolution transverse profiles. LCMS sur-
veys at speeds around 80 km/h, allowing a transverse
profile to be captured every 5 mm. LCMS provide
two image outputs; a sample of both images is shown
in figure 2. The right image is a range image - a vi-
sual representation of the height data collected from
the lasers. The left image is an intensity image - a
visual representation of the intensity data collected
from the lasers. Intensity data detects lane markings
and sealed cracks, whereas range data detects other
features such as cracks. The two images are grey-
scaled, and the size of each image is 1040x1250. The
dataset contains 2,242 positive samples of each image
type, i.e. range and intensity images. Each image was
labelled by a certified engineer at PMS by drawing
bounding box around patches in each image. In this
paper, 70% of the data was used to train the model,
and the remaining 30% was used to evaluate model
Detecting Patches on Road Pavement Images Acquired with 3D Laser Sensors using Object Detection and Deep Learning
415
performance. Since the group of images are identical,
stratification of the dataset was not required. Table 1
shows the details of the dataset, and Table 2 shows the
breakdown of the testing set. Each image contains one
ore more patch; therefore, the total number of patches
equates to the number of ground truth boxes inside the
entire testing set.
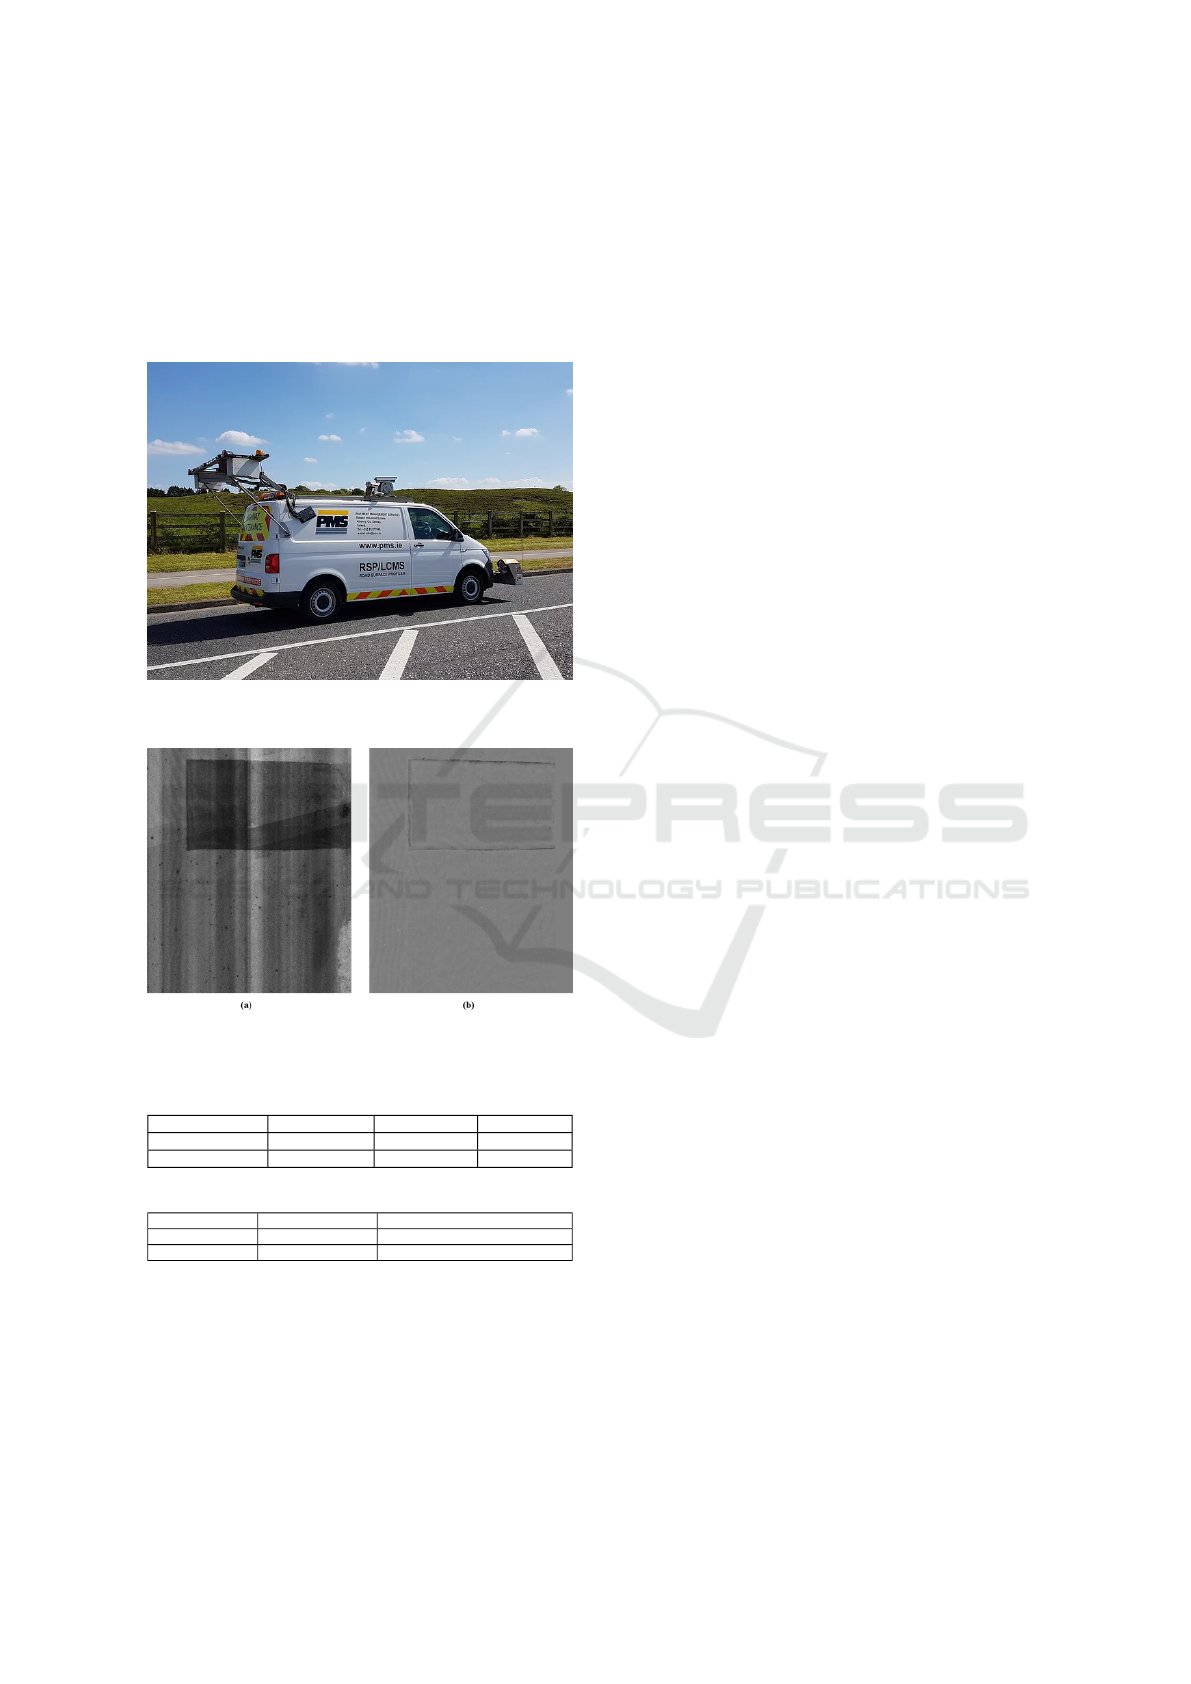
Figure 1: Pavement assessment van with LCMS mounted
on the backside.
Figure 2: (a) Intensity image (b) Corresponding Gray-scale
Range image.
Table 1: Details of the entire training and testing set.
Image Type Total Images Training Set Testing Set
LCMS Range 2,242 1636 603
LCMS Intensity 2,242 1636 601
Table 2: Breakdown of the testing set.
Image Type Total # of images Total # of patches in testing set
LCMS Range 603 856
LCMS Intensity 601 853
3.2 Network Architecture
Two network architecture was utilized in this study to
get comparative result sets with the specified dataset.
The network architectures used were SSD (Single
Shot Detector) with the MobileNet-V2 backbone and
Faster RCNN (Region-based CNN) with Inception-
V2 backbone. The choice of networks was moti-
vated by the fact that these are the state-of-the-art ob-
ject detection architectures for different benchmark
datasets such as Microsoft Common Object Context
(MS COCO) (Lin et al., 2014) and PASCAL VOC
(Everingham et al., 2010). Furthermore, these archi-
tectures offers a structure that can be modified accord-
ing to specific task needs. Additionally, these archi-
tectures have been used in the automatic pavement in-
spection domain such as detection of road markings
(Alzraiee et al., 2021), potholes (Kumar et al., 2020)
and other pavement distress detection (Arman et al.,
2020)
3.2.1 Faster RCNN
Faster R-CNN has two stages for detection. In the
first stage, images are processed using a feature ex-
tractor (e.g., VGG, Inception-V2) called the Region
Proposal Network (RPN), and simultaneously, inter-
mediate level layers (e.g.,” conv5”) are used to predict
class bounding box proposals. In the second stage,
these box proposals are used to crop features from
the same intermediate feature map, which are subse-
quently input to the remainder of the feature extractor
to predict a class label and its bounding box modi-
fication for each proposal. Furthermore, Inception-
V2 architecture is used as a backbone of the Faster
RCNN model. Inception architecture has yielded bet-
ter results than a conventional CNN architecture. Ad-
ditionally, the Faster R-CNN model combined with
Inception CNN architecture shows an improvement in
detection accuracy.
3.2.2 SSD MobileNet-V2
The SSD (Single Shot MultiBox Detector) is a fast
detection model based on a single deep neural net-
work. It was released in 2017 as an efficient CNN ar-
chitecture designed for mobile and embedded vision
applications. This architecture uses proven depth-
wise separable convolutions to build lightweight deep
neural networks that can be used in embedded de-
vices for real-time object detection tasks. However,
SSD network’s drawback is that its performance is
directly proportional to object sizes, meaning that it
does not perform well on object categories with small
sizes compared to other approaches such as the Faster
RCNN.
In our experiments, model training and testing are
done using Python and the Tensorflow object detec-
tion API. For training, an NVIDIA GeForce RTX
2070 GPU was used. All experiments are performed
VISAPP 2022 - 17th International Conference on Computer Vision Theory and Applications
416
under Windows 10 on Intel Core i7-9750 with 16GB
of DDR4 RAM.
4 EXPERIMENTAL RESULTS
In this section, we address the following research
question. How accurately can object detection meth-
ods detect patches on images acquired using LCMS?
The metrics used to answer this question are he Preci-
sion and Recall using IoU (Intersection over Union).
4.1 Evaluation of Designed Solution
Several researchers have proposed different evalua-
tion methods for the object detection task (Padilla
et al., 2020) (Zhao et al., 2019). This paper uses
precision and recall using the Intersection over Union
(IoU), also known as the Jaccard index, to evaluate the
trained models. This evaluation method was preferred
over standard object detection metrics that measure
the performance at a global level, usually based on
Average Precision (AP). However, the standard met-
rics do not provide enough insights regarding how
good the detection was in each image, which is criti-
cal if we deploy a system in the real world. A more
granular evaluation help us answer questions such as
”Does the model perform significantly better on range
and intensity images?”, ”How many patches are au-
tomatically detected versus how many actual patches
have been identified by certified engineers?” To get
these insights, first we need to compute the confusion
matrix using the actual ground truth boxes and pre-
dicted boxes. Confusion matrix can be calculated by
defining the IoU and confidence threshold. IoU will
measures the overlap between the actual ground truth
box and the predicted bounding box, and the confi-
dence score helps to draw the predicted bounding box
according to a pre-defined threshold. For example, if
we define the IoU threshold of 0.5, it means that if
the overlap between an actual and predicted bounding
box is <0.5, the model will consider it as false pos-
itive whereas, if the overlap between actual and pre-
dicted bounding box is >0.5, the model will consider
it as true positive. In this way we can compute the
confusion matrix. Once the confusion matrix is com-
puted, we can use it to calculate precision and recall.
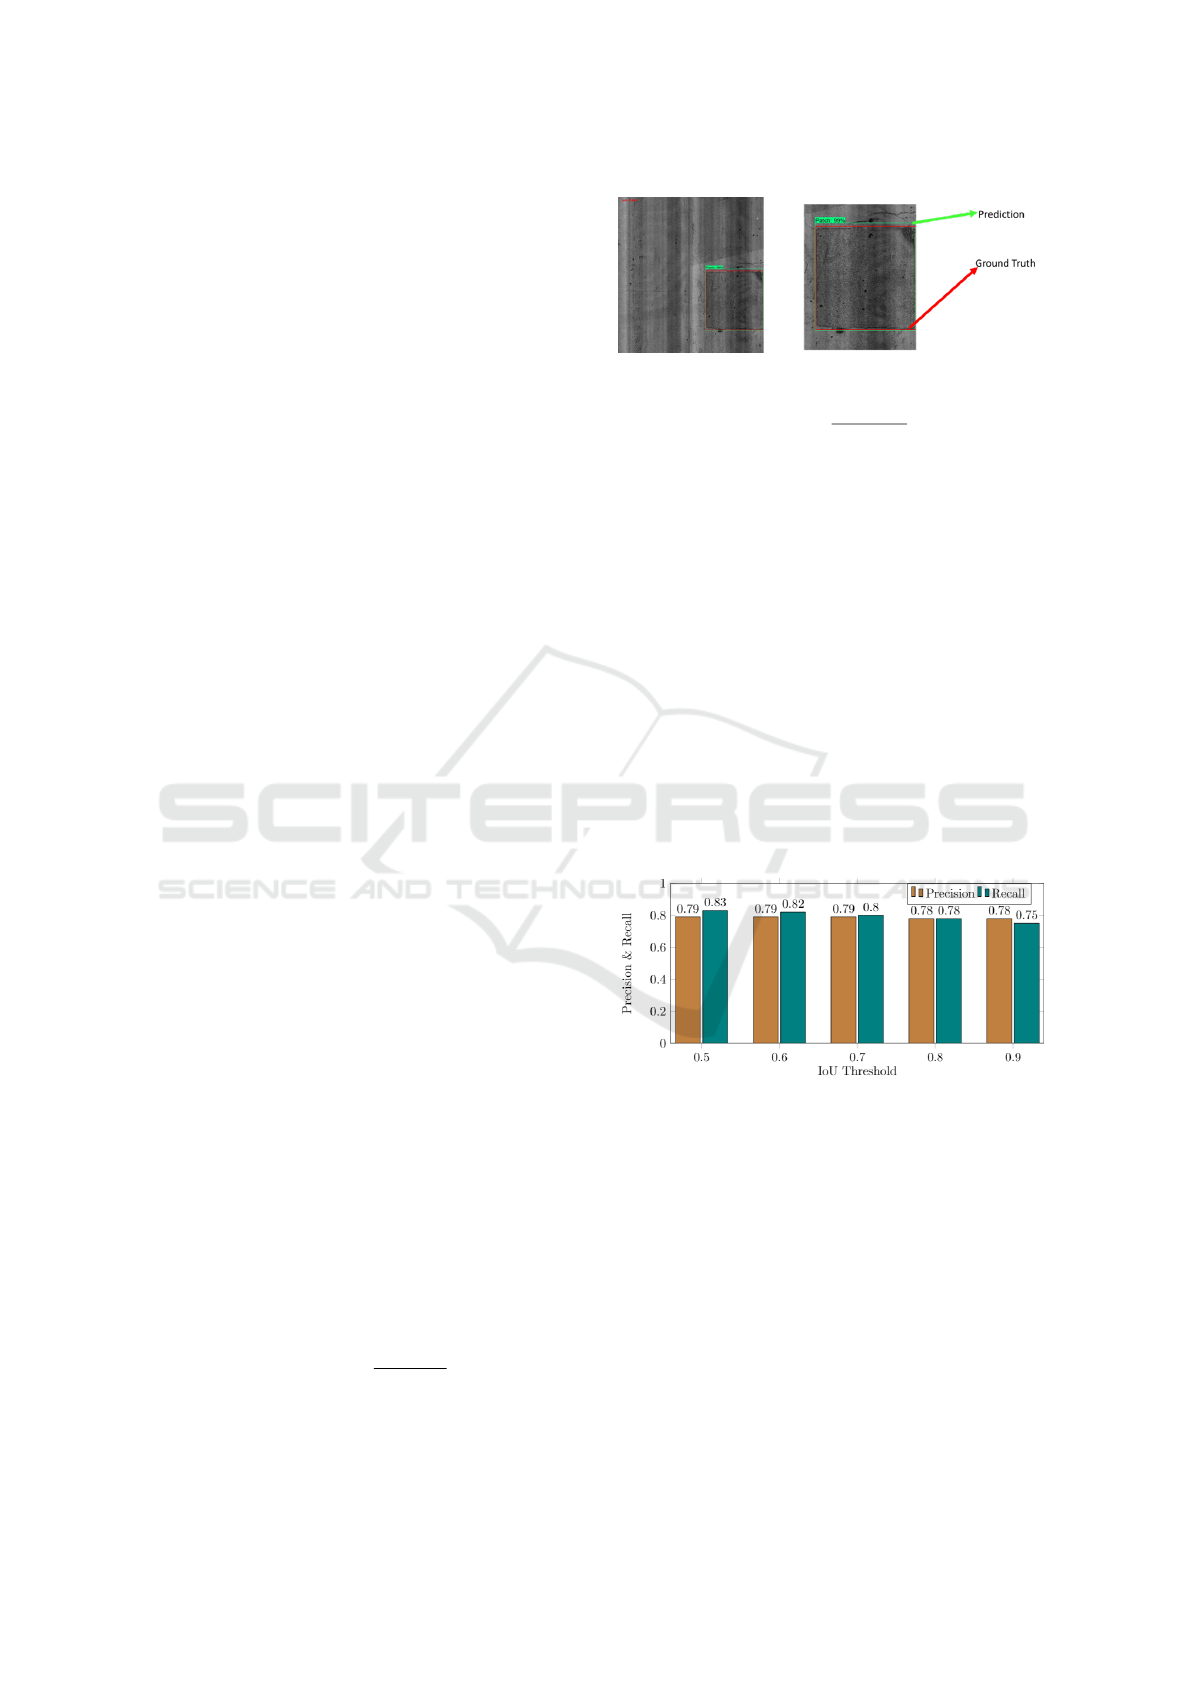
Figure 3 illustrates examples of IoU and confidence
score.
Precision =
T P
T P + FP
(1)
Where TP+FP is the total number of ROI generated
from the model.
Figure 3: Example of Intersection over Union (IoU).
Recall =
T P
T P + FN
(2)
Where FN is the number of ground truth boxes.
As a first step, the optimal value of IoU needs to
be identified. This was done by calculating precision
and recall at different IoU thresholds to check whether
the different IoU threshold impacts the detection per-
formance. Figures 4 illustrate the results achieved by
the Faster RCNN model at different IoU thresholds
using a 0.6 confidence score. At higher confidence
scores, the model only draws boxes with highest prob-
ability, increasing true positive rate, and decreasing
false positive rate. In contrast, if we keep the con-
fidence score low, false positive rate will increase as
the model makes more incorrect predictions. By cal-
culating precision and recall at different IoU threshold
with different confidence score, we found that 0.6 is
the optimal value for confidence threshold that pro-
vide satisfactory results.
Figure 4: Comparison of Precision and Recall at different
IoU threshold values using Range Images.
The analysis found that the detection performance
is considerably better using 0.5 IoU with a 0.6 con-
fidence score. Hence, these values were used across
all subsequent experiments. Also, it is worth noting
that if we keep the IoU threshold high, the model will
consider a patch as a false negative. Furthermore, for
the task of patch detection, a higher IoU threshold is
not required, as the exact placement of the patch rel-
ative to the predicted area only needs to be enough to
say that a patch exists in the area.
Detecting Patches on Road Pavement Images Acquired with 3D Laser Sensors using Object Detection and Deep Learning
417

4.2 Experiment 1 (Patch Detection
using Range Images)
The purpose of this experiment was to analyse the
performance of object detection models on the range
images. Faster RCNN and SSD MobileNet V2 were
trained and tested with range images. Table 3 shows
the detection performance of both models. Compared
to the SSD, Faster RCNN detects more patches, as
shown by the higher recall rate. However, Faster
RCNN generates more false positives. In contrast,
SSD has a lower recall rate and higher precision,
which means SSD detects less patches by drawing
fewer incorrect boxes but missing the actual patches.
Table 3: Detection performance on Range images.
Model Backbone Precision@0.5IoU Recall@0.5IoU
Faster RCNN Incpetion-V2 0.79 0.83
SSD MobileNet-V2 0.87 0.7
4.3 Experiment 2 (Patch Detection
using Intensity Images)
This experiment aims to determine the performance
of the same models on intensity images; the same
models were retrained with intensity images. Table
4 shows the detection performance of two models
across intensity images. Compared to experiment 1,
the results on intensity images are lower because in-
tensity images contain much noise, and patches are
not so visible when compared to range images. Fig-
ure 5 shows the visual results of intensity and range
images. As shown in the figure some patches were de-
tected in range images that not identified in intensity
images and vice versa. In some cases the patch inten-
sity is very similar to rest of the pavement, such that it
is difficult to detect the patch manually from intensity
image. The same patch is clear in the range image
due to changes in depth. Similarly, in some cases the
patch depth change is not visible in the range image,
but the grayscale values for the patch and the rest of
pavement are different and thus visible in the inten-
sity image. These types of occurrences suggest that a
combined decision process, using both range and in-
tensity may get a better result.
Table 4: Detection performance on Intensity images.
Model Backbone Precision@0.5IoU Recall@0.5IoU
Faster RCNN Incpetion-V2 0.67 0.74
SSD MobileNet-V2 0.84 0.39
Figure 5: Visual analysis of Range and Intensity images.
4.4 Combined Model
Having examined the performance of patch detection
using each of the range and intensity images sepa-
rately, we see that range images show better patch
detection performance. However, given that we have
two image types for each area of road, it is worth
investigating whether intensity images can be useful
where the range model fails and vica versa. In other
words, can a combined model approach provide better
patch detection results than each of the two separate
range and intensity models? In order to answer this
question we analysed the underlying image level re-
sults for Tables 3 and 4 to examine the following (1)
the number of patches detected by Faster RCNN and
SSD on range images, that are not detected on inten-
sity images and (2) the number of patches detected by
Faster RCNN and SSD on intensity images, that are
not detected on range images. Table 5 shows the re-
sults of this analysis, indicating the number of patches
detected by one model but not the other: 188 for the
Faster RCNN and 323 for SSD MobileNet. For the
combined model, we take the output patch prediction
per image from each of range and intensity models.
If either or both of the models identify a patch, we
count that patch as a detection. This leads to a higher
true positive rate as more patches are found using re-
sults from both models, as indicated by Table 5. The
counter-side is that we also raise the false positive
rate, as false positives in either model are counted.
We recomputed precision and recall and the predic-
tion accuracy of the combined model is shown in Ta-
ble 6. Using the combined model approach, recall
rate achieved is 0.88 and 0.7 with Faster R-CNN and
SSD respectively. Faster R-CNN achieves a 5% im-
provement using the combined model over the previ-
ous highest Faster R-CNN (using range images). Re-
call for SSD shows no change. The combined model
identifies more patches overall including more false
positives. The choice of optimal model - range or
combined - depends on the priorities of the pavement
assessment task at hand. If the cost of missing a patch
VISAPP 2022 - 17th International Conference on Computer Vision Theory and Applications
418
Table 5: Comparative analysis on Range and Intensity images.
Model
# patches detected in Range
images but not
in equivalent Intensity images
# patches detected in
Intensity images but not
in equivalent Range images
Faster RCNN 142 46
SSD MobileNet-V2 292 31
is significant, more false positives may be tolerated.
This decision of accuracy over precision may be made
by the task owner.
Table 6: Detection performance on Combined Model.
Model Backbone Precision Recall
Faster RCNN Incpetion-V2 0.6 0.88
SSD MobileNet-V2 0.79 0.7
5 CONCLUSION
This paper proposes an automatic patch detection sys-
tem for intensity and range images captured using
LMCS, a 3D laser profiling system. We trained two
object detection models with intensity and range im-
ages. Both Faster RCNN and SSD models provide
better patch detection on range images. While Faster
RCNN can detect more patches when compared to
SSD, it has a higher false-positive rate on both im-
age types. Although false positive cases can be re-
duced with post-processing criteria such as increas-
ing the IoU and confidence threshold, this will lead
to a lower recall rate. A combined model based on
both image types identified the most patches, achiev-
ing 0.88 recall rate using Faster RCNN which is 5%
higher than the best of the range-only and intensity-
only models. However, the combined approach de-
creased precision. According to industry domain ex-
perts at PMS, this trade off needs to be considered in
the context of the requirements of the individual patch
detection work being undertaken. False positives can
be tolerated in exchange for higher recall in challeng-
ing cases as shown in figure 5. In future work, we sug-
gest that these results can be further improved through
the following: data pre-processing techniques such
as identifying uncertain labelled images, further tun-
ing of model hyperparameters, creating a new fea-
ture extraction network for better results and testing
other state of the art object detection networks such
as Yolov5. Further investigation is required to un-
derstand the characteristics of patches with domain
experts. Additionally, the automatic patch detection
system will be compared with manually rated patch
conditions to check the robustness of automatic pave-
ment assessment systems.
ACKNOWLEDGEMENTS
This work was funded by Science Foundation Ireland
through the SFI Centre for Research Training in Ma-
chine Learning (18/CRT/6183).
REFERENCES
Ajeesha and Kumar, A. (2016). Efficient road patch detec-
tion based on active contour segmentation. Interna-
tional Journal for Innovative Research in Science &
Technology, 3(4):166–173.
Alzraiee, H., Leal Ruiz, A., and Sprotte, R. (2021). De-
tecting of pavement marking defects using faster r-
cnn. Journal of Performance of Constructed Facili-
ties, 35(4):04021035.
Arman, M. S., Hasan, M. M., Sadia, F., Shakir, A. K.,
Sarker, K., and Himu, F. A. (2020). Detection and
classification of road damage using r-cnn and faster
r-cnn: a deep learning approach. In International
Conference on Cyber Security and Computer Science,
pages 730–741. Springer.
Everingham, M., Van Gool, L., Williams, C. K., Winn, J.,
and Zisserman, A. (2010). The pascal visual object
classes (voc) challenge. International journal of com-
puter vision, 88(2):303–338.
Hadjidemetriou, G. M., Vela, P. A., and Christodoulou, S. E.
(2018). Automated pavement patch detection and
quantification using support vector machines. Journal
of Computing in Civil Engineering, 32(1):04017073.
Hassan, S. I., O’Sullivan, D., and McKeever, S. (2021). Pot-
hole detection under diverse conditions using object
detection models. In IMPROVE, pages 128–136.
Koch, C. and Brilakis, I. (2011). Pothole detection in as-
phalt pavement images. Advanced Engineering Infor-
matics, 25(3):507–515.
Kumar, A., Kalita, D. J., Singh, V. P., et al. (2020). A mod-
ern pothole detection technique using deep learning.
In 2nd International Conference on Data, Engineer-
ing and Applications (IDEA), pages 1–5. IEEE.
Laurent, J., H
´
ebert, J. F., Lefebvre, D., and Savard, Y.
(2012). Using 3d laser profiling sensors for the auto-
mated measurement of road surface conditions. In 7th
RILEM international conference on cracking in pave-
ments, pages 157–167. Springer.
Lin, T.-Y., Maire, M., Belongie, S., Hays, J., Perona, P.,
Ramanan, D., Doll
´
ar, P., and Zitnick, C. L. (2014).
Detecting Patches on Road Pavement Images Acquired with 3D Laser Sensors using Object Detection and Deep Learning
419

Microsoft coco: Common objects in context. In Euro-
pean conference on computer vision, pages 740–755.
Springer.
Liu, W., Anguelov, D., Erhan, D., Szegedy, C., Reed, S.,
Fu, C.-Y., and Berg, A. C. (2016). Ssd: Single shot
multibox detector. In European conference on com-
puter vision, pages 21–37. Springer.
Maeda, H., Sekimoto, Y., Seto, T., Kashiyama, T., and
Omata, H. (2018). Road damage detection using
deep neural networks with images captured through
a smartphone. arXiv preprint arXiv:1801.09454.
Mathavan, S., Rahman, M., Stonecliffe-Jones, M., and Ka-
mal, K. (2014). Pavement raveling detection and mea-
surement from synchronized intensity and range im-
ages. Transportation Research Record, 2457(1):3–11.
Mulry, B., Jordan, M., O’Brien, D., et al. (2015). Au-
tomated pavement condition assessment using laser
crack measurement system (lcms) on airfield pave-
ments in ireland. In 9th International Conference on
Managing Pavement Assets.
Padilla, R., Netto, S. L., and da Silva, E. A. (2020). A sur-
vey on performance metrics for object-detection algo-
rithms. In 2020 International Conference on Systems,
Signals and Image Processing (IWSSIP), pages 237–
242. IEEE.
Ren, S., He, K., Girshick, R., and Sun, J. (2016). Faster
r-cnn: towards real-time object detection with region
proposal networks. IEEE transactions on pattern
analysis and machine intelligence, 39(6):1137–1149.
Roerdink, J. B. and Meijster, A. (2000). The watershed
transform: Definitions, algorithms and parallelization
strategies. Fundamenta informaticae, 41(1, 2):187–
228.
Sandler, M., Howard, A., Zhu, M., Zhmoginov, A., and
Chen, L.-C. (2018). Mobilenetv2: Inverted residu-
als and linear bottlenecks. In Proceedings of the IEEE
conference on computer vision and pattern recogni-
tion, pages 4510–4520.
Szegedy, C., Vanhoucke, V., Ioffe, S., Shlens, J., and Wo-
jna, Z. (2016). Rethinking the inception architecture
for computer vision. In Proceedings of the IEEE con-
ference on computer vision and pattern recognition,
pages 2818–2826.
Tsai, Y.-C. and Chatterjee, A. (2018). Pothole detection
and classification using 3d technology and watershed
method. Journal of Computing in Civil Engineering,
32(2):04017078.
Zhang, D., Zou, Q., Lin, H., Xu, X., He, L., Gui, R., and Li,
Q. (2018). Automatic pavement defect detection us-
ing 3d laser profiling technology. Automation in Con-
struction, 96:350–365.
Zhao, Z.-Q., Zheng, P., Xu, S.-t., and Wu, X. (2019). Ob-
ject detection with deep learning: A review. IEEE
transactions on neural networks and learning systems,
30(11):3212–3232.
VISAPP 2022 - 17th International Conference on Computer Vision Theory and Applications
420
