
Automatic Transcription System for Nutritional Information Charts
of Spanish Food Products
José Manuel Fuentes
1a
, Roberto Paredes
1b
, Elena Fulladosa
2c
, María del Mar Giró
2
and Anna Claret
2d
1
PRHLT Research Center, Universitat Politècnica de València, Valencia, Spain
2
IRTA, Food Technology, Girona, Spain
Keywords: Text Transcription, Nutrition, Genetic Algorithms, Image Processing, Convolutional Neural Networks.
Abstract: Labeling of food products contains key nutritional information, but it is often inaccessible or unclear to users.
To alleviate this problem, the application of modern automatic transcription techniques to this field is studied
in this paper. This presents a challenge, due to the structural difference of these charts with respect to the
usual type of documents for which OCR systems are developed, and also because of the wide visual variability
present in this type of labels. For these reasons, a series of algorithms and deep learning models have been
developed and applied as pre-processing for the images and post-processing for the transcription obtained, in
order to optimize and complement this automatic transcription. With this whole pipeline, we achieve to extract
the nutritional information from the pictures in an efficient, complete, accurate and structured way.
1 INTRODUCTION
Food labeling is one of the most essential components
of any food-based industry. Beyond transparency, it
allows people to determine, choose, and upkeep their
dietary needs and health plans. Nutritional facts labels
provide information on the food we choose to eat and
feed to others. Their importance stems from everyday
people being able to make educated choices on their
own health and tailor their options to fit their needs
and desires. As the public understanding of health and
food grows, also does the need for labels on what
people eat. Health is a growing concern in this
generation, and control over what is being consumed
is becoming evidently standard.
However, the user has a lack of understanding of
this information. Being able to capture all the values
of these charts is useful to provide a way to analyze
them and give the user more interesting and
comprehensible information. For example, it could be
used to give nutritional recommendations to users
with medical problems. Or to give more general
alerts, for instance by automatically calculating the
a
https://orcid.org/0000-0002-5827-7489
b
https://orcid.org/0000-0002-5192-0021
c
https://orcid.org/0000-0002-4237-4401
d
https://orcid.org/0000-0003-2099-4308
nutriscore (Hercberg, Touvier and Salas-Salvado,
2021) value of the photographed product.
There are already several automatic image
transcription systems, which allows text to be
captured from an image in an accurate way. This kind
of technology has many applications that have been
broadly studied and developed (Dome and Sathe,
2021; Palekar, Parab, Parikh and Kamble, 2017;
Yamakawa and Yoshiura, 2012), but reading these
kinds of labels implies additional challenges.
First of all, OCR systems are typically trained on
usual text, formed by sentences and paragraphs, but
nutritional facts labels are tabular and with a huge
emphasis on numbers. Secondly, these charts are very
variable in colors, brightness, text font and size,
patterns, textures, etc. Which makes quite a challenge
to develop a generic system that is able to generalize
all these conditions. These types of difficulties have
not been broadly studied, and generally in very
limited settings, with little data or in non-automatic
ways (Revathi and Modi, 2021). Finally, the nutrition
charts contain a structure where quantities are related
Fuentes, J., Paredes, R., Fulladosa, E., Giró, M. and Claret, A.
Automatic Transcription System for Nutritional Information Charts of Spanish Food Products.
DOI: 10.5220/0010827600003124
In Proceedings of the 17th International Joint Conference on Computer Vision, Imaging and Computer Graphics Theory and Applications (VISIGRAPP 2022) - Volume 4: VISAPP, pages
411-418
ISBN: 978-989-758-555-5; ISSN: 2184-4321
Copyright
c
2022 by SCITEPRESS – Science and Technology Publications, Lda. All rights reserved
411
to different items and measures that must be
preserved.
Our main goal in this paper is develop an
automatic system that uses modern deep-learning and
OCR techniques in order to transcribe nutritional
information charts and preserve the data structure and
relationships. Examples of this kind of charts are
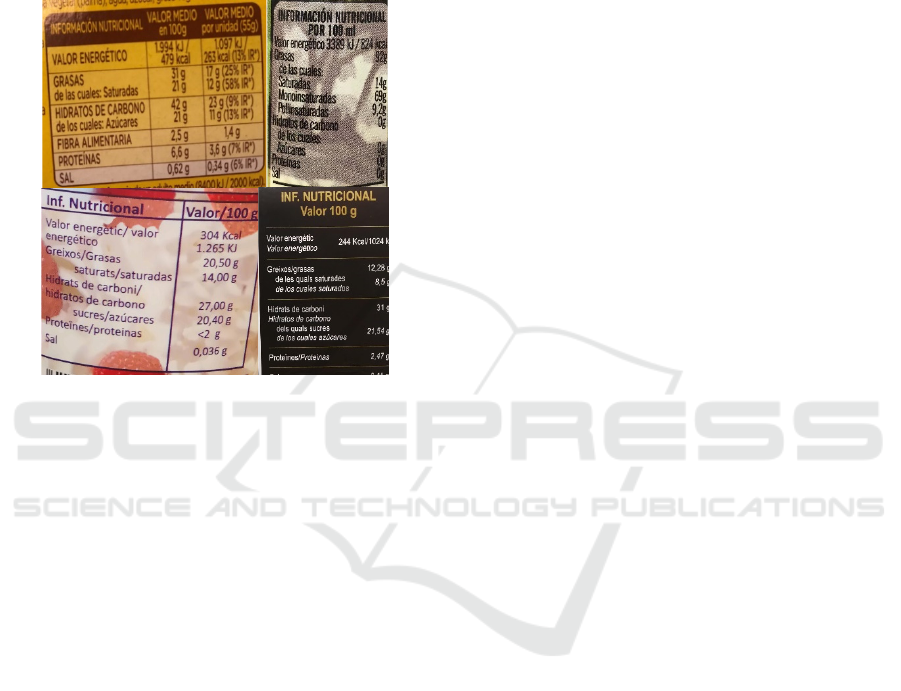
show in Figure 1.
Figure 1: Examples of pictures of nutritional information
charts that belong to the dataset collected for this work.
To that purpose, a pipeline has been developed in
order for an OCR system to transcribe our kind of data
as accurately as possible. This includes, first of all, to
implement several preprocessing algorithms that
standardize and clarify the input images as much as
possible. Secondly, the power of the OCR model was
harnessed by using it in a variety of ways and
exploiting its options. Finally, some postprocessing
algorithms were developed to correct and format the
transcription obtained in order to accurately get the
quantities of interest in a tabular way.
2 METHODOLOGY
To address this transcription problem, Google’s
Tesseract is going to be used. Tesseract is an open-
source system that provides state of the art
transcription in text in 116 languages (Smith, 2007).
However, using Tesseract directly on our images lead
to unacceptable results.
The quality of the images and the different
preprocessing alternatives that can be applied to them
affect the results obtained. This is especially relevant
in our problem, as the packaging of the products may
present a great variability of colors, patterns and
structure, as can be seen in Figure 1. It has been
proved that realistic text pictures, which are usually
shadowed and noisy, are transcribed more
inaccurately by Tesseract (Lu, Guo, Liu and Yan,
2017). For these reasons, some general techniques
were developed and applied to all the pictures in order
to clear and improve them to ease the automatic
transcription.
There are some studies that have tried to address
these kinds of difficulties. However, these studies
often work with very small datasets and propose
semi-automatic solutions (Revathi and Modi, 2021).
Moreover, these works tend to focus on one particular
problem, like shadows (Lu, Guo, Liu and Yan, 2017)
assuming optimal conditions for the rest (white
background, no blur, no rotation, etc.). Our proposal
addresses several realistic conditions that are
problematic for Tesseract in a completely automatic
way, and with a reasonable dataset size. This implies
that our implementation is robust and generalizable
and would be able to work properly in a realistic
environment.
2.1 Preprocessing Pipeline
Different preprocessing techniques are applied over
the original images in order to improve the overall
quality and normalize rotation and the background
foreground color relationship.
2.1.1 Color Standardization
Tesseract usually works much better transcribing
black text over white backgrounds than other formats
(Revathi and Modi, 2021). This is a problem with our
data because it presents a huge variability in colors.
Even if our images are binarized, some of them would
be black text over white backgrounds and others
would be white text over black background.
To overcome this issue, we propose to use a
convolutional neural network (CNN) to detect the
background foreground color relationship. To this
end, the images were made square by adding margins
and resized to a common size of 256x256 px. As for
this subtask color is not important but luminosity, the
images were also turned to grayscale. These images
were labelled in two classes that indicates whether the
background is darker that the text or the background
is lighter that the text. Then, that labelled data was
used to train the CNN.
This convolutional network consists of 7
convolutional layers, all of them followed by batch
normalization, relu activation and 2x2 max pooling.
These convolutional layers have, the first one, 32
VISAPP 2022 - 17th International Conference on Computer Vision Theory and Applications
412
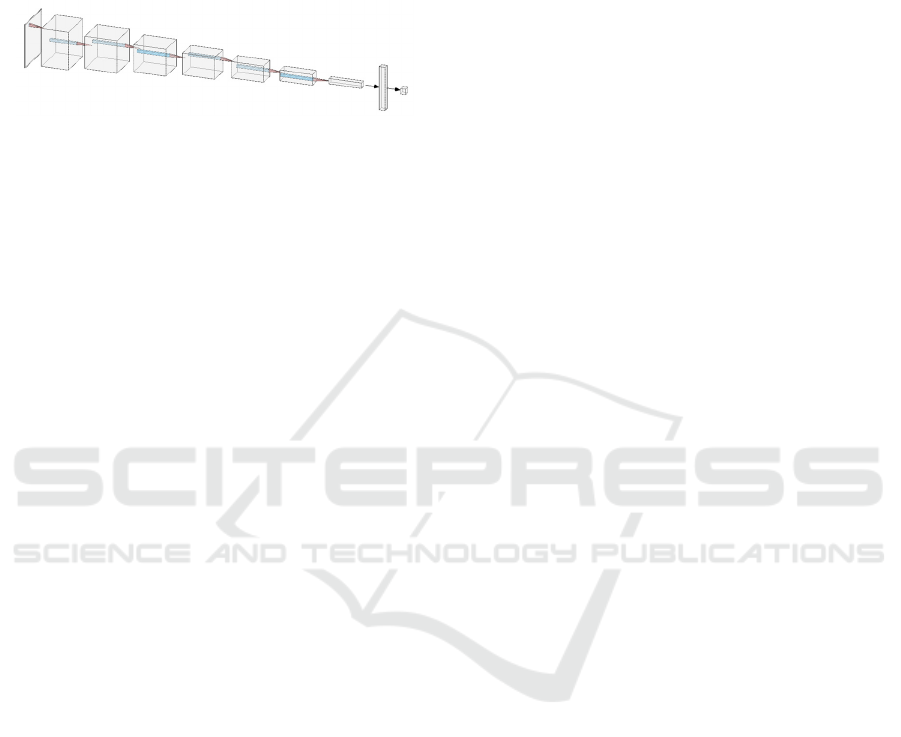
filters of size 5x5 and the others, 64 filters of size 3x3.
After the last of them there is a flatten layer that
connects with a last dense output layer of 2 neurons,
activated by a softmax. After the training of this
model, whose architecture is represented in Figure 2,
it was used to know which images had to be inverted.
Figure 2: Architecture of the CNN used to detect the color
relation between text and background.
2.1.2 Deblur
Due to the acquisition process performed using a
mobile device by hand, some blurring use to appear
in the images. In order to improve the image quality
removing this blurring, a scale-recurrent deep
convolutional network was used. To this end, cropped
images of the nutritional information chart were
turned to greyscale and inverted those ones which had
light text over dark backgrounds. Then, a pre-trained
deblurring model, was chosen and used on all the
pictures (Tao, Gao, Shen, Wang and Jia, 2018).
2.1.3 Quality Improve and Binarization
A pipeline of three different processes was applied.
First, a bilateral filter and a median filter were applied
to reduce the amount of noise that the image may
contain without degrading the edges.
Second, the contrast of the photos was increased
to better define the edges. This is done by means of a
basic algorithm that subtracts the mean grey color of
the image to this picture multiplied by an
amplification factor.
And finally, the images were binarized using an
adaptative algorithm, that computes as local threshold
the mean value of the defined neighborhood area.
This way, the binarization is robust to light changes
within the photo.
2.1.4 Rotation Correction
Finally, the rotation of the images had to be corrected,
as they may not be completely horizontal. This is
crucial, as Tesseract finds it harder in general to
transcribe rotated text (Improving the quality of the
output, 2021).
To fix this, an algorithm based on canny edge
detection (Canny, 1986) and hough transform (Duda
and Hart, 1972) was used to detect the skew of every
image and correct it, as it showed to be a robust and
effective algorithm for our data.
2.2 Parameter Optimization by Genetic
Algorithm
The processes defined in Section 2.1.3 are
parameterizable. The bilateral filter needs a diameter,
a sigma filter in the color space and in the coordinate
space. The contrast adjustment depends on a
magnification factor. The binarization algorithm
needs a neighborhood diameter for the adaptative
process, a magnification constant and an adaptive
method.
These parameters affect the quality of the
resulting images and couldn’t be chosen arbitrarily.
To estimate them, a genetic algorithm was used, as
they are easy to design, computationally affordable
and have already been used for related works of
image filter optimization (Hadar and Ben-Tal, 2001;
Undrill and Delibassis, 1997)
For this genetic algorithm, a population of 30
individuals was chosen. An elitist selection scheme
was used, so that 40% of the best individuals
reproduce in each generation. The cross is made
between two individuals by means of a 2-point
crossover, so that the genotype is divided into 3 parts
of equal size for the crossover. This genotype consists
of a list of 7 values, 6 numerical and one boolean,
corresponding to the 7 parameters to be estimated.
For the replacement, it is chosen to maintain a stable
population, so that 40% of the worst individuals of a
generation are replaced by the new individuals
resulting from the crossing.
The number of generations to be considered is
100. And a final judgment occurs in generations 33
and 66, in which the best individual is kept and the
other 29 are randomly generated to prevent the
population from stagnating. There is also a control in
each generation that avoids having very similar
individuals. It consists of eliminating a child and
replacing it with a new random individual if it is the
same as another one in the population. Finally, after
generating a child, each of its genes has a 5% chance
of mutating randomly.
The fitness of an individual is calculated by using
Tesseract to transcribe the images preprocessed with
the individual’s parameters. Then, the quality of the
transcription is evaluated taking into account 3
metrics that focus on some common and relevant
mistakes that Tesseract was observed to make with
our data.
A common mistake was the omission of decimal
commas. It is very important for our purposes to
Automatic Transcription System for Nutritional Information Charts of Spanish Food Products
413
know whether a product contains 1.0 g or 10 g of salt.
Therefore, the number of numbers with a decimal
point in each of the images was annotated so it can be
checked how many of them are correctly transcribed.
Our domain has a fairly restricted vocabulary, so
a set of all the words that appear in the images was
listed. Then it can be checked how many of the words
that Tesseract transcribes belong to that vocabulary of
around 75 words.
Another common error of Tesseract was to
confuse the abbreviation of grams “g” for the number
9. Therefore, the number of units (kJ, kcal, g, etc.) that
appear in each of the images was counted and how
many of them are in the transcriptions can be verified.
This error is less relevant, so this characteristic is
weighted down by dividing it by 2.
All in all, the fitness of an individual is calculated
by applying the preprocess corresponding to that
individual to all the images. Then, these processed
images are passed to Tesseract and the fitness is
computed as described, following the formula:
f
(
individual
)
=
∑
comma(img)+vocab(img)+
𝑢𝑛𝑖𝑡(𝑖𝑚𝑔)
2
2.5
img
card
(
train
)
(1)
comma
(
img
)
=
card({nϵT: n∈R ∧ n∉N})
c[im
g
]
(2)
vocab
(
img
)
=
card({w∈T: w∈V})
card
(
T
)
(3)
units
(
img
)
=
card({nϵT: n∈R ∧ has_unit(n)})
u[im
g
]
(4)
Where:
• T is the word set in the transcription.
• c[img] is the number of decimal numbers that
appear in the image img
• V is the ground truth vocabulary of the charts.
• has_unit(n) is true if after the number n comes
a unit (kJ, kcal, g, mg, L, mL or %).
• u[img] is the number of units that are in img.
This returns a value between 0 and 1 that denotes
the quality of the preprocess applied to the images.
This algorithm was run to get the filter’s parameters
optimized for our task. The kind of result that is
obtained with this whole preprocessing is shown in
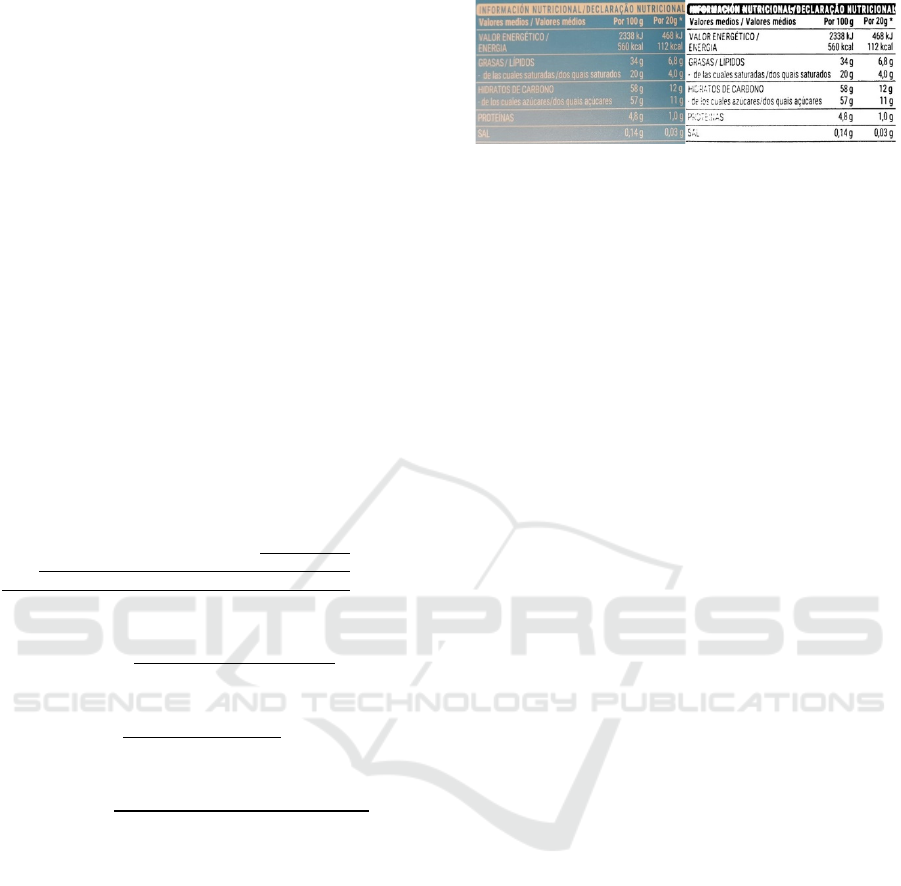
Figure 3.
Figure 3: Left, original nutritional information picture.
Right, preprocessed picture (inverted, deblurred, filtered,
rotated and binarized).
2.3 Contour-based Complementary
Transcription
Even with the preprocess pipeline described in
section 2.2, the automatic transcription obtained from
Tesseract was far from perfect. In order to further
improve the transcription obtained by Tesseract, an
algorithm was designed to work with isolated
characters.
A character detection algorithm based on contour
analysis was used (Suzuki and be, 1985). With it, all
the contours in the preprocessed binarized picture are
obtained. These contours are hierarchically organized
and selected, as the interest ones are those that
correspond to a real character. It is important to note
that organizing elements, such as spreader bars and
also noise have to be discarded. To do so, an average
size of character is established, and those contours
which are too small (noise) or too big (bars, charts,
etc.) are discarded. Once all the contours that
presumably correspond to a character are selected,
each of them is treated as a different image and each
of them is transcribed. To this purpose, Tesseract’s
special option for single character transcription is
used.
Finally, words are reconstructed based on the
position of the contours, joining characters that are
horizontally contiguous. To detect whether two
contours are horizontally contiguous or not, they are
all algorithmically organized in rows. Then, a
clustering algorithm is applied to the number of pixels
that separate each contour to the next one in its row.
With two clusters, this outputs an average intra-word
spacing and an average inter-word spacing. One
drawback of this system is that decimal commas are
usually discarded as they are small and considered
noise. But they can be detected by checking if the
image contains some black pixels between two
contours transcribed as numbers. For clarification, an
example representation of the contour detection and
its alignment by rows is shown in Figure 4.
Tesseract transcribes badly numbers if there are a
lot of words in the image, probably because usual text
VISAPP 2022 - 17th International Conference on Computer Vision Theory and Applications
414
doesn’t contain a lot of numbers. As this contour-
based method transcribes each character without
context, number transcription is in general better.
However, words are worse transcribed with this
method, because context is important to guess real
words. So, our final transcription system is a
combination of these two methods: the whole image
and the individual characters. To combine them, the
transcription of the whole image is taken as the basis,
and the contour-based transcription is added to those
areas of the picture where Tesseract didn’t find text.
Transcriptions for the whole image that are
unusually big for a word are also discarded, and
replaced with the analogous transcription by
contours. Moreover, the quality of the transcription of
quantities can also be improved using the contours.
For example, if Tesseract found a quantity without a
decimal point, the contours can be used to check if
there really is no black cluster of pixels between two
contours. The digit “9” and the unit “g” (for grams)
can also be distinguished this way, by checking if the
corresponding contour is at the same height as other
contiguous digits (“9”) or lower (“g”).
Figure 4: Visualization of the contour detection algorithm
on a preprocessed picture. In green, the significant contours
detected. In blue, their alignment per row.
2.4 Transcription Postprocess
More algorithmic corrections are made taking
advantage of the specific knowledge of the domain in
which we are working. For example, these nutritional
information charts use a very limited vocabulary of
about 75 words. So, Levenshtein distance is used to
correct words which are close to any word of this
vocabulary (Wint, Ducros and Aritsugi, 2017). Other
example would be replacing any “o” by “0” if it is
between digits, because it corresponds to a quantity,
not a word. One last example would be to filter 1-
letter words that are not aligned vertically or
horizontally with any other word, because they are
probably noise. Like these ones, some other tricks
based on usual patterns and knowledge about our
domain were implemented. With all this pipeline, we
obtain accurate corrected transcriptions like the one
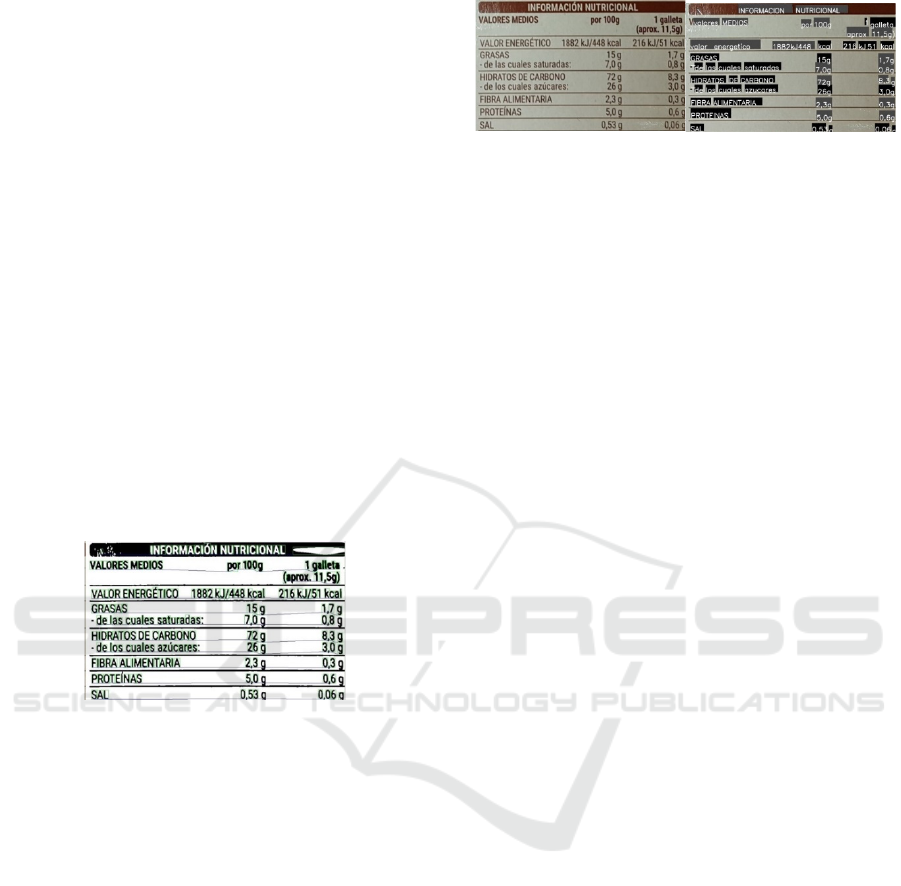
shown in Figure 5.
Figure 5: Left, original nutritional information picture.
Right, transcription placed over the original image. Words
with a black background are untouched from Tesseract’s
transcription of the whole image. Words with a grey
background were somehow corrected with the contours
system and/or the postprocess.
2.5 Layout Analysis
Obtaining a good transcription is not the last step, as
nutritional information is then hidden inside that text.
So, it needs to be extracted from the text to be able to
finally operate with that information in a proper way.
Our target here is to obtain the quantity per 100 g
of a set of nutritional information attributes.
Specifically, the quantities of interest are those that
appear in every nutritional information chart, which
are "energy value", "fats", "saturated fats",
"carbohydrates", "sugar", "proteins" and "salt". It was
also considered obtaining the amount of
"monounsaturated fats", "polyunsaturated fats",
"polyalcohol" and "fiber", since they appear more or
less regularly. But this nutritional information was
discarded, as some products don’t indicate it and they
may not be as relevant as the others to get accurate
nutritional recommendations.
This data extraction is a two-phase process: first
the transcription is organized in a tabular way, by
rows. Then the quantities of each of the desired
attributes are obtained.
First, this tabularization process is similar to the
process applied to the contours when they were
organized in rows. In detail, for a word, it is checked
if its vertical center is between the lower and upper
limits of the last word of some line. So, if it doesn’t
with any, this word is a new line; if it does with only
one of the rows, it is added to that row; and if it does
for multiple rows, it is added to the end of the line
whose vertical center is closest. Moreover, it is rare
that a number begins a line, because the lines begin
with the names of the nutritional properties. For this
reason, if a word has numbers, the upper and lower
limits of each row are extended when checking if it
fits any of them.
Second, when the transcription is organized in
rows, it may seem quite simple to recover each
quantity. You would just have to find any word, like
“sugar” and then take its quantity, which would be the
Automatic Transcription System for Nutritional Information Charts of Spanish Food Products
415

next number in that row. However, there are several
difficulties to consider that had to be overcome. For
example, the words might be incorrectly transcribed
or omitted, the quantities may be incorrectly
transcribed, the alignment process may fail if the
chart is still slightly rotated, etc.
To solve these potential problems, the specific
information of our domain was again taken into
account. To mitigate the omission of words, the
structure of the nutritional information tables was
used, which is always the same. The attributes always
appear in the following order: energy value, fats,
saturated fats, carbohydrates, sugar, proteins and salt.
Therefore, if “fats” is found in a row and its quantity,
and the following row only has a number, it can be
assumed that that number corresponds to the amount
of saturated fats. This improves the accuracy although
it is not always effective, because there are some
charts that show more information. For example, if
“fiber” is present, it is between “proteins” and “salt”,
so the system may confuse “fiber” with “salt”.
The amount of energy is more complicated, as it’s
usually indicated in kilojoules and kilocalories.
Moreover, sometimes both appear in the same row
and sometimes in consecutive rows. But it also helps
us overcome omissions, as the kilojoules of energy
can be calculated from the kilocalories and vice versa.
In addition, these tables sometimes include
another column apart from the one that indicates
amounts per 100 g, which indicates the amount per
serving. This situation is identified by checking that
there are two quantities per row. Then, if it’s the case
the second column can be used to supplement
omissions or inaccuracies in the first row. This is
done by calculating the proportion between the
quantities in the first column and their analogous on
the second one. The correct proportion is assumed to
be the most common one and it is used to correct or
calculate inaccurate or omitted quantities.
With these and other similar algorithms, the data
is corrected, completed and extracted from these
transcriptions. This way, the quantity of each of the 7
considered attributes per 100 g is acquired. As energy
is recovered in kilojoules and kilocalories, 8 values
are finally obtained as the result for each image.
As for the evaluation of this whole transcription
system, a result is considered correct if it deviates
from the ground truth by less than 20%. For example,
if the ground truth were 0.4 g, a value between 0.32 g
and 0.48 g would be accepted. This percentage value
was chosen based on (Guidance document for
competent authorities for the control of compliance
with EU Legislation, 2012), that states in 20% the
maximum acceptable error in the labeling of
nutritional facts. That way, a reasonable accuracy
percentage can be computed for our system.
3 EXPERIMENTS
In our whole system, there were mainly 3 processes
that needed to be trained, optimized and evaluated:
• The convolutional neural network that
classifies the charts in light letters over dark
background or dark letters over light
background.
• The genetic algorithm used to optimize the
parameters of the filters applied to the images
as preprocessing.
• The transcription itself, especially the
effectiveness of the complementary contour-
based transcription and the post-processing
applied to the result had to be tested.
For the first task, a small dataset of 347 pictures
was collected with 3 smartphones in a realistic
environment. The photos were made of various food
products in a supermarket. From these pictures, the
nutritional information chart was cropped, so that
only the necessary information was present. This
dataset was divided into 315 samples as the training
set and 32 for testing. For this task, all these images
were manually labeled with a binary class indicating
whether they were light letters over dark background
or dark letters over light background.
The genetic algorithm is a more time-demanding
process, as it implies preprocessing all the pictures 30
times each generation. That’s why we decided to run
it with a smaller set of 40 images selected from the
dataset described above. These pictures had to be
manually labelled with the key values needed for
computing the fitness function. That is, the number of
decimal numbers in the chart and the amount of
quantities with an explicit unit after it. A vocabulary
set of 76 terms for this domain was also elaborated.
As the transcription is the most important part of
our system and we wanted more accurate and reliable
results, a bigger and more diverse dataset of 633
images was collected. These pictures contain the
nutritional facts from labels in Spanish and
correspond to different food and beverage products
(except alcoholic beverages). The pictures were taken
using 5 different smartphones with conventional
camara. During acquisition, glitters, reflections, blur
and other defects were avoided as most as possible.
This dataset was also manually labeled, extracting
for each image the amount of each of the nutritional
characteristics per 100g and per serving. For the
VISAPP 2022 - 17th International Conference on Computer Vision Theory and Applications
416

evaluation, as some food labels don’t contain the “per
serving” information, only the quantities per 100g
were taken into account.
Some of the images collected for the experiments
are shown in Figure 1, where the variability in colors,
patterns, font or structure can be appreciated.
4 RESULTS
4.1 Color Standardization
The first task is to detect whether the text is black over
white backgrounds or not. To this end a CNN was
trained and evaluated.
Table 1: Precision results of the convolutional neural
network used to detect if a nutritional label has light letters
on a dark background.
Accuracy (%) Categorical cross-entropy
100 0.003
The results shown in Table 1 are unusually high,
which may be due to the low difficulty of the task
and/or because of the small size of our test set.
4.2 Transcription
Next step was to develop algorithms that improve the
transcription performance of Tesseract, which was
quite poor with our original images. To do so, two
main enhancement groups were developed and
applied: preprocessing the images, with all the
mechanisms described above, so that they are as clean
and simple as possible (Sections 2.1 and 2.2); and
combining the direct transcription of the entire picture
with separated individual transcriptions of all the
characters in the image, by detecting contours in it
(Section 2.3). The performance of these two
development blocks was evaluated and the results are
show in Table 2. The postprocessing explained in
Section 2.4 is applied in all cases.
Table 2: Transcription results comparison for different
alternatives of the proposed system: only transcribing the
whole original images; transcribing the entire preprocessed
images; and combining the transcription of the entire
preprocessed images and the contours in it.
One-shot
transcription
with original
images
One-shot
transcription
with pre-
processed
images
Combined
transcription
with pre-
processed
images
Accuracy (%) 41.01 55.85 74.25
Table 2 results show how vital both techniques are
in order to get acceptable results. Next, with our final
system, the number of errors per image was
evaluated. Taking into account that the maximum
number of errors per picture is 8, that is, all the
amounts of interest. The results are shown in Table 3.
Table 3: Number of errors per image of the final
transcription system.
Number of errors
012 3 4
Number
of images
203
(32%)
119
(19%)
109
(17%)
66
(10%)
40
(6%)
Number of errors
567 8
Number
of images
29
(5%)
28
(4%)
16
(3%)
23
(4%)
The most common mistakes were analyzed. They
are as follows:
• Loss of information in the binarization of the
image when it has a highly variable brightness.
• Omission of the decimal point in the
transcription.
• Misalignment of a characteristic with its
quantity if the chart remains slightly rotated
after the preprocessing.
• Incorrect transcriptions if the typography is
unusual.
• Loss of data in the binarization in nutritional
information charts that alternate two highly
contrasted colors.
• Tables that do not follow typical structure
Energy-Fat-Saturated-Carbohydrates-Sugar-
Proteins-Salt.
Table 4: Number (and percentage) of times that each one of
the parameters is incorrectly obtained by the final system.
Energy kJ Energy
kcal
Fat Saturated
fat
Number
of errors
131
(21%)
135
(21%)
145
(23%)
155
(24%)
Carbohydrates Suga
r
Proteins Salt
Number
of errors
163
(
26%
)
155
(
24%
)
214
(
34%
)
206
(
33%
)
The errors are mainly in the last characteristics
that appear in the tables (proteins and salt). This may
be due to the presence of unusual characteristics. For
example, if fiber appears in the table, it appears
between proteins and salt. So, the system would
expect salt to be after proteins, but it would be fiber.
The same happens with other unusual quantities, like
"polyunsaturated fats" or "polyalcohols".
Automatic Transcription System for Nutritional Information Charts of Spanish Food Products
417

On the other hand, the characteristics with the
least error are precisely those that are always at the
beginning of the table. This may be because they are
easy to locate even with a bad transcription, as the
first numerical value from the top is most likely the
energy one. Furthermore, this would reinforce the
hypothesis of the previous paragraph.
5 CONCLUSIONS
In this paper, application of modern OCR models and
artificial intelligence techniques to the effective and
structured transcription of nutritional information
labels was studied. It was checked how, with the
appropriate finetuned preprocessing, it is possible to
accurately transcribe text from visually-complex and
widely variable images. We also proved that, in
domains where data follows certain rules and
patterns, taking this information into account and
algorithmically using it, it is possible to
significatively improve the overall results and get a
low error rate in a complex environment.
ACKNOWLEDGMENTS
Grant RTI2018-096883-R-C43 funded by
MCIN/AEI/ 10.13039/501100011033 and by "ERDF
A way of making Europe".
REFERENCES
Canny, J. (1986). A Computational Approach to Edge
Detection. IEEE Transactions On Pattern Analysis And
Machine Intelligence, PAMI-8(6), 679-698. doi:
10.1109/tpami.1986.4767851
Dome, S., & Sathe, A. (2021). Optical Charater
Recognition using Tesseract and Classification. 2021
International Conference On Emerging Smart
Computing And Informatics (ESCI). doi: 10.1109/
esci50559.2021.9397008
Duda, R., & Hart, P. (1972). Use of the Hough
transformation to detect lines and curves in pictures.
Communications Of The ACM, 15(1), 11-15. doi:
10.1145/361237.361242
Guidance document for competent authorities for the
control of compliance with EU Legislation. (2012).
Retrieved 29 November 2021, from
https://www.fsai.ie/uploadedfiles/guidance_tolerances
_december_2012.pdf
Hadar, E., & Ben-Tal, A. (2001). Optimal locally adjustable
filtering of PET images by a genetic algorithm.
Proceedings 2001 International Conference On Image
Processing (Cat. No.01CH37205). doi: 10.1109/
icip.2001.958496
Hercberg, S., Touvier, M., Salas-Salvado, J., & on behalf of
the Group of European scientists supporting the
implementation of Nutri-Score in Europe. (2021). The
Nutri-Score nutrition label. International Journal For
Vitamin And Nutrition Research. doi: 10.1024/0300-
9831/a000722
Improving the quality of the output. (2021). Retrieved 3
October 2021, from https://tesseract-ocr.github.io/
tessdoc/ImproveQuality.html
Lu, H., Guo, B., Liu, J., & Yan, X. (2017). A shadow
removal method for tesseract text recognition. 2017
10Th International Congress On Image And Signal
Processing, Biomedical Engineering And Informatics
(CISP-BMEI). doi: 10.1109/cisp-bmei.2017.8301946
Palekar, R., Parab, S., Parikh, D., & Kamble, V. (2017).
Real time license plate detection using openCV and
tesseract. 2017 International Conference On
Communication And Signal Processing (ICCSP). doi:
10.1109/iccsp.2017.8286778
Revathi, A. S., & Modi, N. A. (2021). Comparative
Analysis of Text Extraction from Color Images using
Tesseract and OpenCV. 2021 8th International
Conference on Computing for Sustainable Global
Development (INDIACom), 931–936. doi:10.1109/
INDIACom51348.2021.00167
Smith, R. (2007). An Overview of the Tesseract OCR
Engine. Ninth International Conference On Document
Analysis And Recognition (ICDAR 2007) Vol 2. doi:
10.1109/icdar.2007.4376991
Suzuki, S., & be, K. (1985). Topological structural analysis
of digitized binary images by border following.
Computer Vision, Graphics, And Image Processing,
30(1), 32-46. doi: 10.1016/0734-189x(85)90016-7
Tao, X., Gao, H., Shen, X., Wang, J., & Jia, J. (2018). Scale-
Recurrent Network for Deep Image Deblurring. 2018
IEEE/CVF Conference On Computer Vision And
Pattern Recognition. doi: 10.1109/cvpr.2018.00853
Undrill, P., & Delibassis, K. (1997). Stack filter design for
image restoration using genetic algorithms.
Proceedings Of International Conference On Image
Processing. doi: 10.1109/icip.1997.638814
Wint, Z., Ducros, T., & Aritsugi, M. (2017). Spell corrector
to social media datasets in message filtering systems.
2017 Twelfth International Conference On Digital
Information Management (ICDIM). doi:
10.1109/icdim.2017.8244677
Yamakawa, D., & Yoshiura, N. (2012). Applying
Tesseract-OCR to detection of image spam mails. 2012
14Th Asia-Pacific Network Operations and
Management Symposium (APNOMS). doi:
10.1109/apnoms.2012.6356068
VISAPP 2022 - 17th International Conference on Computer Vision Theory and Applications
418
