
Automated Damage Inspection of Power Transmission Towers from UAV
Images
Aleixo Cambeiro Barreiro
1 a
, Clemens Seibold
1 b
, Anna Hilsmann
1 c
and Peter Eisert
1,2 d
1
Fraunhofer HHI, Berlin, Germany
2
Humboldt University of Berlin, Berlin, Germany
Keywords:
Automatic Damage Localization, Infrastructure Inspection, Artificial Neural Networks, Data Augmentation.
Abstract:
Infrastructure inspection is a very costly task, requiring technicians to access remote or hard-to-reach places.
This is the case for power transmission towers, which are sparsely located and require trained workers to climb
them to search for damages. Recently, the use of drones or helicopters for remote recording is increasing in the
industry, sparing the technicians this perilous task. This, however, leaves the problem of analyzing big amounts
of images, which has great potential for automation. This is a challenging task for several reasons. First, the
lack of freely available training data and the difficulty to collect it complicate this problem. Additionally, the
boundaries of what constitutes a damage are fuzzy, introducing a degree of subjectivity in the labelling of the
data. The unbalanced class distribution in the images also plays a role in increasing the difficulty of the task.
This paper tackles the problem of structural damage detection in transmission towers, addressing these issues.
Our main contributions are the development of a system for damage detection on remotely acquired drone
images, applying techniques to overcome the issue of data scarcity and ambiguity, as well as the evaluation of
the viability of such an approach to solve this particular problem.
1 INTRODUCTION
Damage inspection is a core task in the maintenance
process of big infrastructures. It is vital to detect
structural issues as soon as possible in order to prevent
further damages or even a complete collapse. Espe-
cially for critical infrastructures, damages need to be
detected and evaluated before they cause any harm.
However, this inspection can be a daunting task, since
such structures are often located very sparsely, have a
very large size and are comprised of numerous indi-
vidual components. Additionally there is usually a
large intra-class variability. All of these issues are
present in inspections of power transmission towers,
which need to be performed on a regular basis. The
traditional way to do this is to have specialized tech-
nicians travel to the location of each of the towers
in the energy network, deploy the necessary security
equipment and inspect from every side, which can be
very challenging depending on the environment. He-
licopters are also sometimes additionally required to
a
https://orcid.org/0000-0002-1019-4158
b
https://orcid.org/0000-0002-9318-5934
c
https://orcid.org/0000-0002-2086-0951
d
https://orcid.org/0000-0001-8378-4805
fly along the transmission lines. However, with the
recent increase in availability of drones to the gen-
eral public, the industry is moving towards remote
acquisition of images of these structures. Feasibility
of such approaches and working examples are docu-
mented in (Morgenthal and Hallermann, 2014; Sony
et al., 2019). This would allow a visual analysis of
the components without the need of experts physi-
cally accessing them. Although it is already a big
improvement with respect to physical inspection, this
approach still has its limitations. One of them is the
fact that all this information must be manually in-
spected, which is in itself a very costly task to per-
form.
Automation of the visual inspection addresses this
issue. Vision-based detection techniques have im-
proved vastly in recent years following the revolution
in the field of machine learning brought by artificial
neural networks. These methods rely on large datasets
of labeled images to be used as training data, which
results in another challenge: due to power transmis-
sion towers being critical infrastructure there are, to
the best of our knowledge, no freely available datasets
of labeled images for this task. Therefore, images had
to be collected and manually labeled for our experi-
382
Cambeiro Barreiro, A., Seibold, C., Hilsmann, A. and Eisert, P.
Automated Damage Inspection of Power Transmission Towers from UAV Images.
DOI: 10.5220/0010826500003124
In Proceedings of the 17th International Joint Conference on Computer Vision, Imaging and Computer Graphics Theory and Applications (VISIGRAPP 2022) - Volume 5: VISAPP, pages
382-389
ISBN: 978-989-758-555-5; ISSN: 2184-4321
Copyright
c
2022 by SCITEPRESS – Science and Technology Publications, Lda. All rights reserved
ment. The difficulty and effort associated with image
collection and their labelling mean that only a very
limited amount of data is available. This problem is
aggravated by the fact that images with damages are
rare, since these damages are repaired as soon as pos-
sible, making it impossible to gather a large dataset.
Additionally, the exact definition of a damage and its
extent are in some cases unclear, especially in areas
further away from the camera and/or with low visibil-
ity, introducing a degree of subjectivity to the labeling
process. Hence, one of the focal points of this paper
is dealing with the scarcity of data and abundance of
unclear examples.
Due to the aforementioned lack of training data,
the amount of literature related to this problem is lim-
ited. Some examples of work that tackle similar is-
sues are (Gopalakrishnan et al., 2018; Varghese et al.,
2017; Shihavuddin et al., 2019). Gopalakrishnan et
al. also use deep-learning methods to detect damages
in structures in images taken from unmanned aerial
vehicles (UAV), but they only perform classification
of the images and not localization of the actual dam-
ages (Gopalakrishnan et al., 2018). Varghese et al. as
well apply deep-learning techniques to drone images
of power transmission lines and towers, but the fo-
cus is mainly placed on detecting the structures: the
only type of damage detected is tilting of the towers
due to erosion of the soil (Varghese et al., 2017). The
work of Shihavuddin et al. (Shihavuddin et al., 2019)
is closer to ours in that they also use deep neural net-
works to detect damages in power structures, in their
case, wind turbines. However, in their work the detec-
tion targets are more clearly isolated and delimited,
and usually contrast strongly against the white color
of the turbines. This makes it a more suitable prob-
lem for a bounding-box detector. In our case, this is
not possible due to several factors, including the lower
visibility of many damages, their clustering and com-
plicated delimitation, their relative lack of conspic-
uousness within the structures or their similarity in
some cases to patches of dirt. These make the detec-
tion harder and require more complex techniques to
address them.
The contributions of this paper can be summarized
as follows:
• We propose a solution to the problem of automa-
tion of the vision-based inspection of damages in
power transmission towers.
• We develop techniques to improve the training re-
sults despite of the scarcity and ambiguity of the
available data. Particularly, we devise a sophisti-
cated augmentation method tailored for the prob-
lem at hand and the chosen network, and analyze
the best way to deal with the input image size.
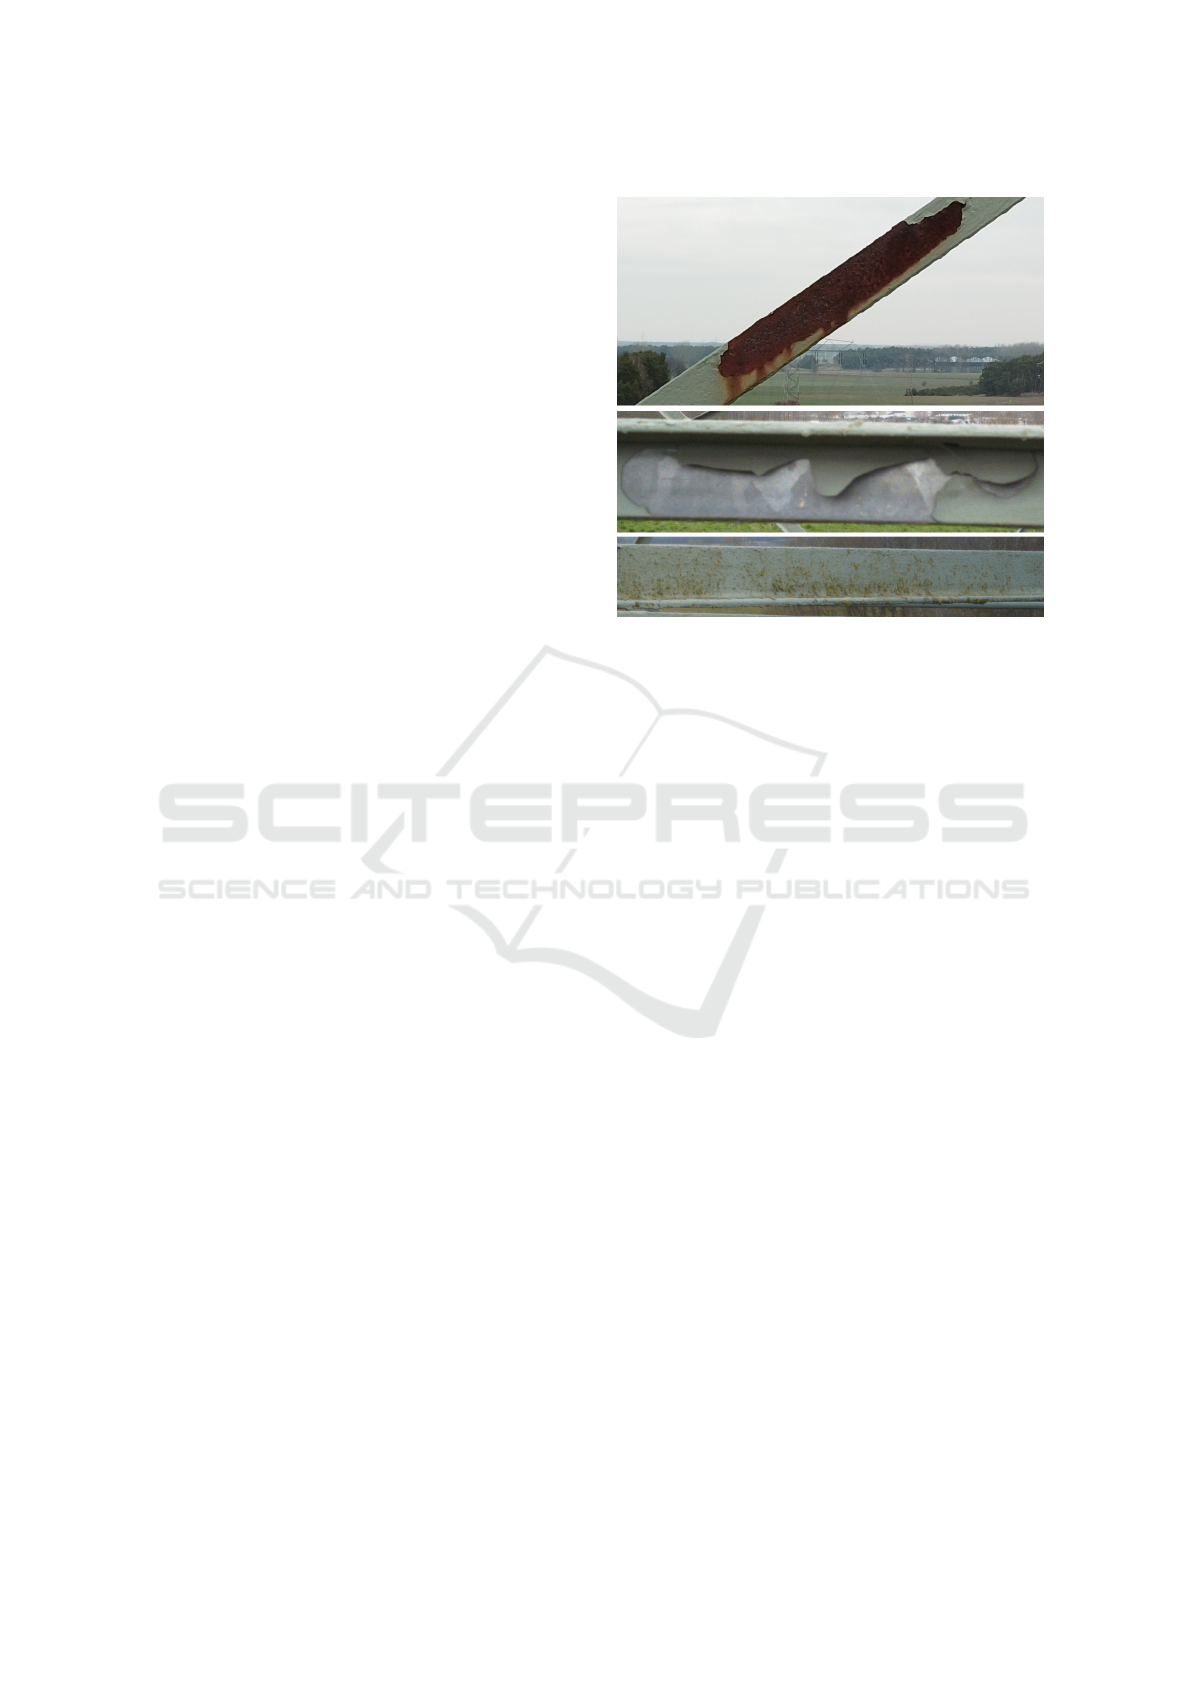
Figure 1: Examples of a corrosion damage, a missing paint-
ing damage and a patch of dirt, from top to bottom.
• We evaluate the viability of our approach as a so-
lution to the problem of damage inspection. Con-
cretely, we propose metrics suitable for our goal
and complement them with a qualitative analysis
of the results.
Additionally, with our work we set the basis for
more-advanced damage inspection tasks. Particularly,
thanks to the good results achieved in the segmenta-
tion of the damages, it is possible in many cases to
determine the area of the damaged components, as ex-
plained in section 4. This opens the door to possible
future work to further the extent of automation in this
process.
2 DATASET AND
METHODOLOGY
In this section, we will present the dataset we acquired
for our experiments, as well as the methodology used
in developing our solution.
2.1 Dataset
The dataset used in our experiments consists of im-
ages collected on-site by means of drone-mounted
cameras. These drones were remotely controlled by
professional pilots that manually flew them around a
number of power transmission towers. The images
consist mostly of frontal shots of the structures with
a line of view roughly parallel to the ground plane,
taken from different distances. Since the damages
Automated Damage Inspection of Power Transmission Towers from UAV Images
383
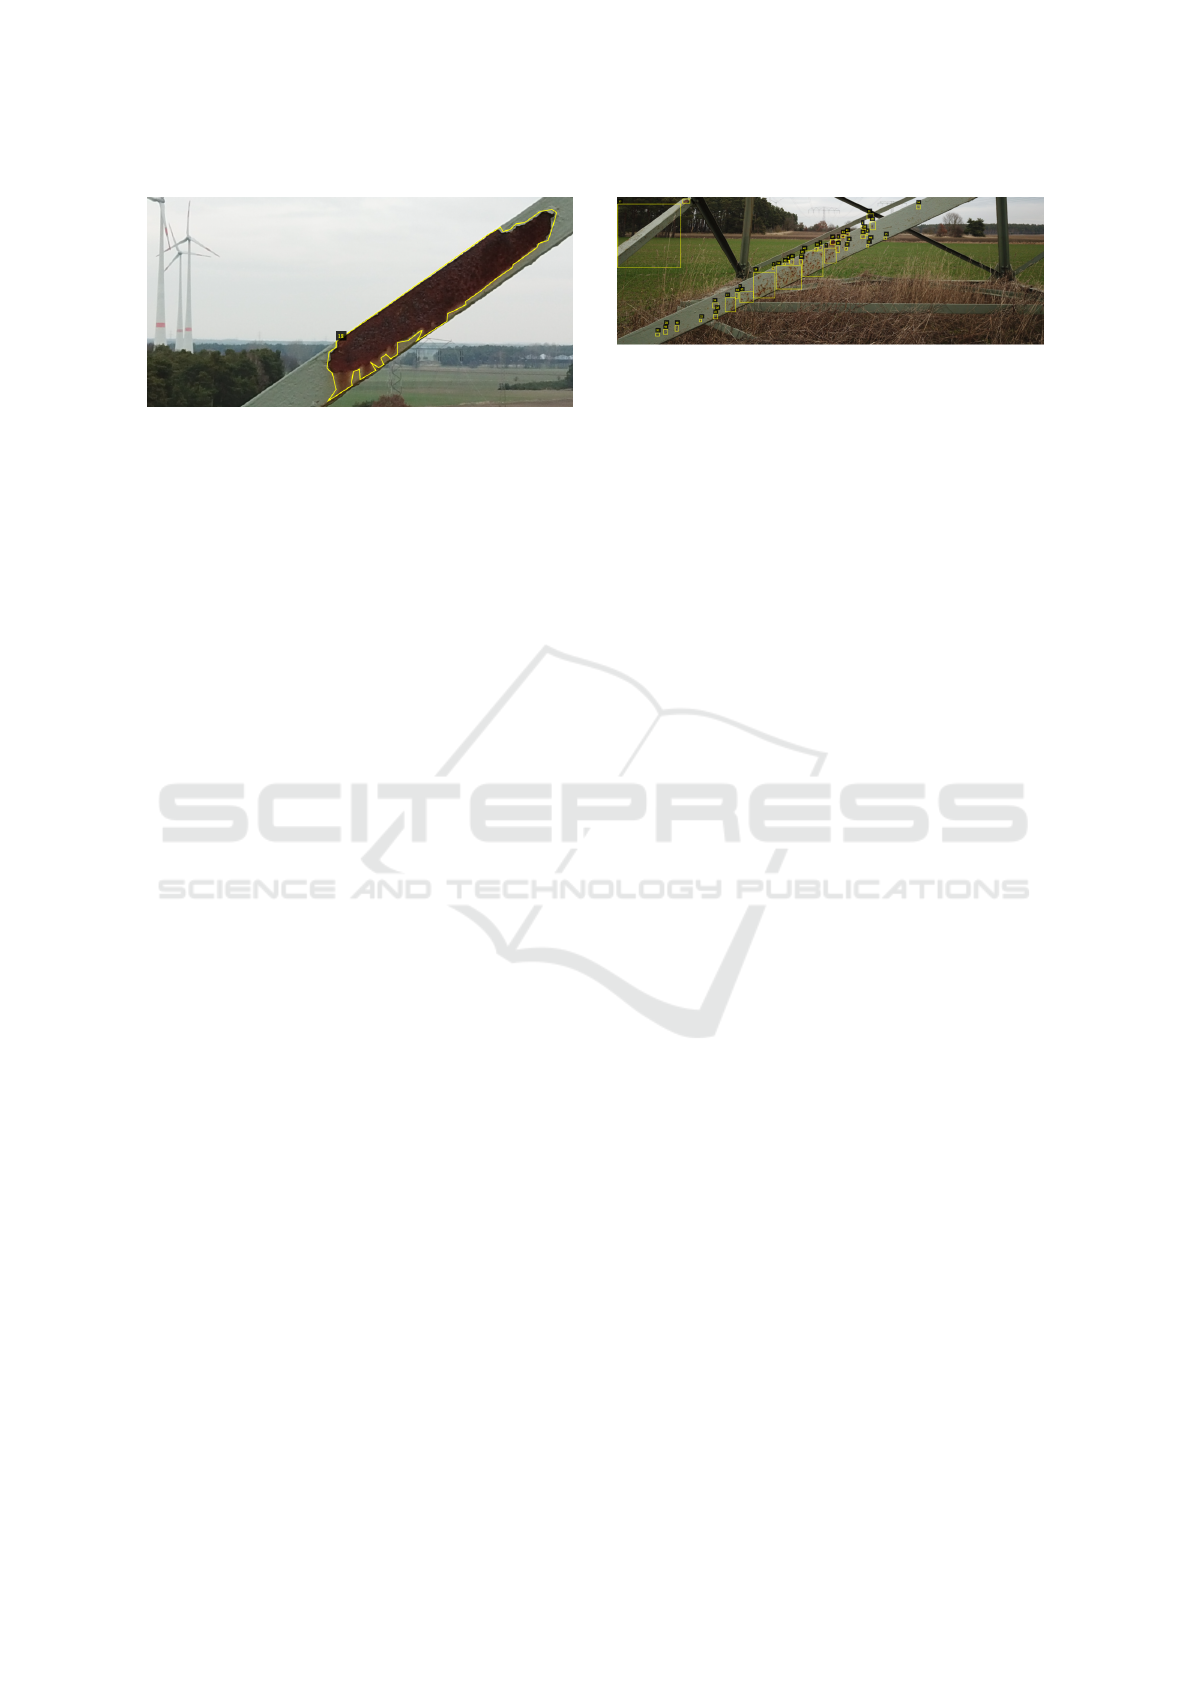
Figure 2: Example of the polygon-based annotations as la-
beled by an expert.
that have been spotted are usually repaired quickly,
the towers with actual examples of damages are ex-
tremely scarce. This further limits the amount of us-
able images obtained and creates a class imbalance
where most of the image content is background, un-
derscoring the necessity of a method to deal with the
small amount of data available. Some images of struc-
tures without any issues have also been taken as a ref-
erence.
As for the damages, they are quite diverse in ap-
pearance, which further complicates their automatic
detection. Apart from substantial differences in size,
shape and lighting conditions, we have recognized
some other intra-class variations. The most common
type of damage in our dataset is corrosion, where the
layer of paint has completely fallen off and the metal
underneath it has become rusty. Another type of dam-
age is the lack of paint, which leaves the metal ex-
posed to the elements and corrosion. It is also possi-
ble that only the outermost layer of paint is missing,
revealing layers underneath it of a different color but
not yet the metal. All of these can be present as ei-
ther big patches or small dots and on different com-
ponents, adding yet another degree of intra-class vari-
ability. Hence, fewer examples are available for learn-
ing for each of these types. Moreover, patches of dirt
are also present on these structures, which can easily
be mistaken for damages even by an expert labeler.
Examples can be seen in Figure 1.
The dataset consists of a total of 165 high-
resolution pictures, most of them of 4000x2250 pix-
els, with other similar resolutions also present in
smaller numbers. Of these, 20 pictures show struc-
tures in a good condition, without any damages. We
divided these 165 images randomly into a training set,
with 142 images, and a validation set, with 23, ap-
proximately 14% of the total. After this division, we
proofed that different damage types had representa-
tion in the validation set. The same damages are not
present in different pictures. These images have been
manually labeled by an expert in the field using the
VGG Image Annotator (VIA) (Dutta and Zisserman,
Figure 3: Examples of difficult cases for labeling with rect-
angular bounding boxes. Labeling of pixel regions is more
suitable in such cases.
2019). The labels consist of polygons that approx-
imate the perimeter of the detection targets, as seen
in Figure 2.
2.2 Instance Segmentation
In the field of computer vision, there are several tasks
related to the detection of objects in images. Some
of the most common ones are bounding-box detec-
tion, semantic segmentation and instance segmenta-
tion. The task of bounding-box detection consists in
determining the smallest rectangular box that contains
each distinct object of interest in the image. On the
other hand, in semantic segmentation one class label
is assigned to each pixel, determining what kind of
an object it corresponds to, without distinguishing in-
dividual objects. Instance segmentation is an inter-
mediate approach in which each individual object of
interest in the image is located and the pixel region it
occupies is determined.
Although the labels required by bounding-box de-
tection are simpler to produce than those for segmen-
tation, in our dataset many damages are hard to isolate
using rectangular boxes, as shown in Figure 3. Espe-
cially with such a small amount of examples, it is a
difficult task for a neural network to distinguish the
relevant content that should be learnt from each box
in such cases. This was our experience when trying
the Faster-RCNN network (Girshick, 2015).
With a more time-consuming pixelwise labeling,
the damages are more clearly defined. However,
in the case of semantic-segmentation, the individual
classification of each pixel is a very difficult task to
perform due to the strong class imbalance (in average
around 99% of the pixels are background) and, once
again, the very limited amount of examples. This
was the case for several networks (Ronneberger et al.,
2015; Zhao et al., 2017; Chao et al., 2019; Shah,
2017) we tried, even after modifying their loss func-
tions to compensate for the class imbalance.
An approach based on instance segmentation
yielded the best initial results and, thus, is the cho-
sen approach for our experiments. It is introduced in
the following section.
VISAPP 2022 - 17th International Conference on Computer Vision Theory and Applications
384
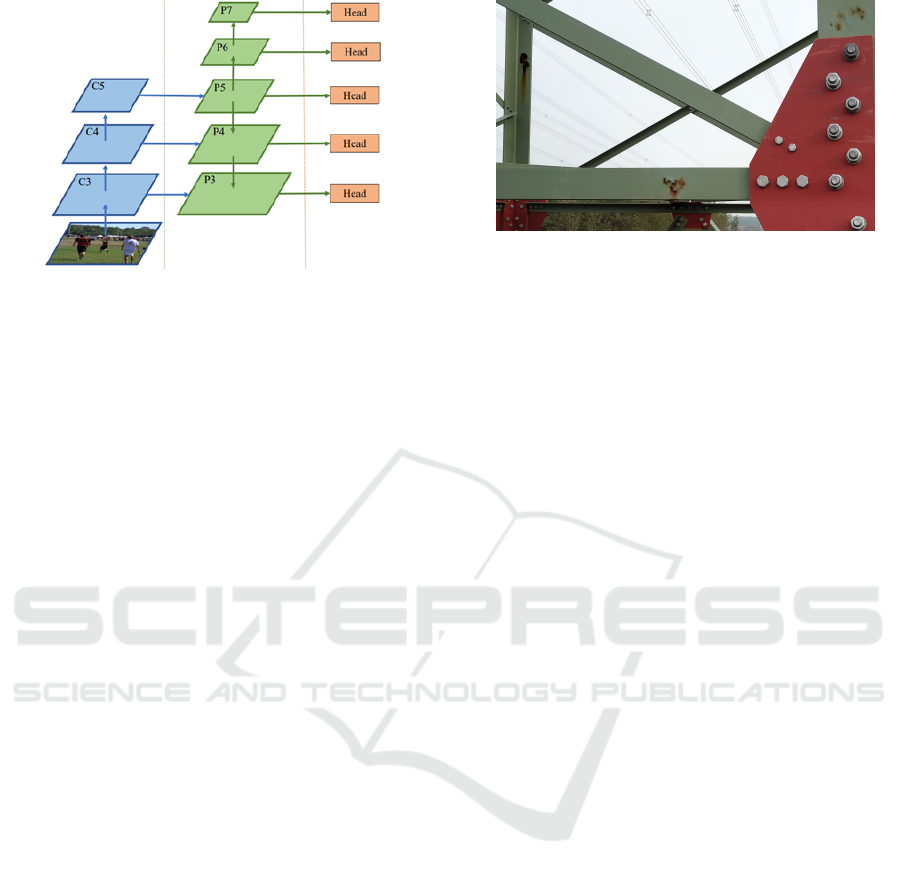
Figure 4: FCOS feature pyramid (image from original pa-
per). The outputs of applying successive convolutional lay-
ers of the backbone to the input are used to generate the
different levels of feature maps. From the last one, which
constitutes the feature map P
5
, further convolutions are ap-
plied to obtain P
6
and P
7
. In the opposite direction, P
5
is
scaled successively and combined with the previous levels
of outputs to obtain P
4
and P
3
. Predictions are made directly
from each of these feature levels, which are responsible for
predicting targets of different sizes.
2.3 CenterMask
In our experiments, we use the CenterMask (Lee and
Park, 2020) architecture for instance segmentation
due to its good performance on relevant benchmarks.
It consists of three main components:
• An interchangeable backbone for feature extrac-
tion.
• A detection head based on the Fully Convolu-
tional One-Stage Object Detection (FCOS) (Tian
et al., 2019) architecture.
• Spatial Attention-Guided Mask (SAGM) for the
segmentation of the detected objects.
The architecture of the FCOS detection head is
relevant to our data augmentation process due to its
feature pyramid system, depicted in Figure 4, based
on the concept proposed in (Lin et al., 2017). In the
following section, we explain how this design affects
our data augmentation process. As for the backbone,
we use VoVNetV2 (Lee and Park, 2020) as proposed
by the authors.
In our experiments, we use two different classes,
damage and dirt, everything else being considered
background. The reason we have included dirt as a
class is the fact that, in many cases, it can be visually
similar to damages, but it is not relevant for the main-
tenance. In order to avoid raising false alarms about
damages, we choose to explicitly learn the difference
between both classes.
We have developed different techniques that we
applied to the network in order to improve the train-
Figure 5: In this image, three corrosion damages from other
pictures have been pasted onto undamaged components us-
ing the Poisson Image Editing (P
´
erez et al., 2003) tech-
nique.
ing. Those yielding the best results in our experiments
are discussed in the following subsections.
2.4 Data Augmentation
One of the focal points of this paper is dealing with
the extreme scarcity of training data. One way to mit-
igate this issue is the use of data augmentation. To
this end, different techniques have been tried, rang-
ing from simple framework-supported augmentation
techniques to a more sophisticated system we devel-
oped for this purpose. As for the basic, framework-
supported techniques, we applied to the input im-
ages randomized scaling to a given set of short-
edge sizes, random horizontal flipping and random
cropping. While these simpler methods already in-
crease the diversity of the training data received by
the network, the composition of the images remains
mostly unchanged. Addressing this issue, we used an
augmentation method based on Poisson Image Edit-
ing (P
´
erez et al., 2003). In this method, some damages
are manually segmented and seamlessly pasted using
the aforementioned technique onto undamaged parts
of structures in other images, increasing the dataset
diversity. An example of this is shown in Figure 5.
In this method, however, the synthetic images must
be manually generated one by one, selecting suitable
spots for the chosen damages. We also propose a
more sophisticated augmentation method that allows
to automatically generate high amounts of synthetic
training images, designed after a detailed analysis of
the characteristics of the available dataset. In this
dataset, we have identified the following issues that
need to be addressed:
• Severe scarcity of images.
• Scarce detection targets for training, especially for
each intra-class variation.
• Invariability of the appearance and surroundings
of these examples.
Automated Damage Inspection of Power Transmission Towers from UAV Images
385

• Fuzzy description of what constitutes a damage
yielding unclear examples.
• Significant numeric predominance of small, bor-
derline examples over more relevant damages.
Additionally, as explained in the previous section,
different feature layers are responsible for predicting
objects of different sizes, which means that examples
of each type of damage are required at different scales
as well.
In order to address these issues more specifically,
we have resorted to a method that augments the most
relevant examples for the generation of additional
synthetic training data. The process of generation of
this data is described in the following.
As a first step, a manual selection of the “best ex-
amples” from the available training data is performed.
The goal here is to focus the training on the most rele-
vant information. Hence, the criteria for determining
which ones constitute the best examples are mainly
their unambiguity and the coverage of appearance
variations. Focusing on these examples should reduce
the impact of the numerous small or unclear labels
that dominate the images. Increasing the relevance of
the good examples this way has yielded much better
results than a different approach we explored based
on merely reducing the influence of the majority of
small, lower-quality examples through a weighting
system. The latter was, therefore, discarded.
These selected examples are then manually seg-
mented, including some of the surrounding structure
for context, but without background. The regions of
the crop around the example that are not part of the
structure are removed and left transparent. Examples
are taken of both damaged and undamaged compo-
nents, as well as those with patches of dirt, for a com-
plete coverage.
As a next step, these selected examples are used
to generate synthetic images. In order for the net-
work to focus on the examples and ignore the areas
of the image that are not relevant, we have decided
to use randomized backgrounds. To this end, a col-
lage is made using random images from the Com-
mon Objects in Context (COCO) dataset (Lin et al.,
2014), which is then used as a background over which
our examples will be pasted. Once the background is
generated, a random number of cropped examples are
chosen from the different categories. These are pro-
cessed and pasted onto the background. This process-
ing is aimed at optimizing the quality of the training,
and includes the following steps:
• Random Position of the Example within the
Image. This helps reinforce the translational in-
variance of the network.
Figure 6: Example of augmented data. Over the back-
ground, composed of random images from COCO dataset,
there are six augmented examples: one of them from the
class ”dirt”, three of them from the class ”damage”, and two
of them of undamaged structures that are to be considered
background.
• Random Rotation of the Example. This in-
creases the variation in appearance in our dataset
and helps provide rotational invariance.
• Random Cropping of the Surroundings of the
Target. This makes the learning process less de-
pendent on the exact structure that surrounds the
targets, while still allowing us to preserve some of
it for context, since we want the network to learn
that the damages will always be on the structure.
• Random Scaling. Each of the examples is indi-
vidually scaled before being pasted onto the back-
ground in order to maximize the size diversity for
each type of damage. This is especially relevant
in our approach given the architecture of the net-
work, in which different layers are responsible for
predicting targets of different sizes. This is ex-
pected to make examples of each instance avail-
able for learning in different layers.
This means that each synthetic image may have a
number of both positive and negative examples with
multiple controlled appearance variations, as seen in
Figure 6. The combination of real training data with
synthetically generated images has proven a very use-
ful approach to extract the most amount of informa-
tion from our small dataset, as shown in the results
section.
2.5 Input Image Subdivision
The images available in our dataset are of a very high
resolution, which makes it unfeasible for the network
to process them directly. Hence, an important deci-
sion is how to deal with the size of the input.
One approach would be to perform a downsam-
pling of the input images until they reach a manage-
able size for the network. Experimentally, we have
VISAPP 2022 - 17th International Conference on Computer Vision Theory and Applications
386

found that scaling both dimensions of the images to
approximately 50% of their original values makes it
feasible for the network to process them on common
consumer graphics cards with 11 GB RAM. Doing
this, however, implies a relatively high loss of infor-
mation, although most of the relevant damages are
still clearly recognizable to the human eye.
Another option consists in splitting the image into
smaller parts that can then be processed in nearly
original size as separate inputs. Expected downsides
of this approach include the extra processing time
required and potential loss of context by cropping.
However, the visual information would be preserved
and, in such a small dataset, feeding image subsec-
tions separately in random order could come as an
advantage to artificially increase the training diversity.
This option has been implemented as a “sliding win-
dow” approach, dividing the input images vertically
and horizontally in overlapping regions of the same
size. We expect this overlap to help mitigate the loss
of context due to cropping, since the same region is
present in different windows with different surround-
ings, preventing potentially misleading crops of tar-
gets on the edges. As a final step, the predictions from
different windows are offset and the overlapping ones
aggregated to be merged into a single image. Experi-
mentally, we have found this approach to offer better
results than downsampling of the input.
3 RESULTS
In this section, we propose different performance met-
rics and discuss their suitability to our problem. These
metrics are used for a quantitative analysis of the re-
sults. This is complemented by an additional qualita-
tive analysis, taking into account the particular char-
acteristics of our data. We take the network trained
without using any of the proposed techniques as a
baseline to compare our methods.
The following two performance metrics have been
used to analyze the quality of the results:
• Precision vs. recall. In this case, we define preci-
sion as the ratio of predictions that have any over-
lapping with a detection. This accounts for our
goal to detect all damages, not to accurately seg-
ment them. As for recall, we define it as the ratio
of the labeled damages that have been detected,
again taking any overlapping with a prediction as
a detection. This metric gives a rough idea of how
many of the total damages have been detected and
how many false detections have been made. Its
main flaw is the dominance of small damages,
which might not be so relevant.
Figure 7: Precision-recall curves for the different ap-
proaches. Baseline (blue) corresponds to the network
trained without using any of the proposed improvement
techniques, Augmented (yellow), to the use of our sophis-
ticated augmentation technique, Image Split (green), to the
use of the proposed subdivision of input images, and Im-
age Split Augmented (red) to the combination of these two
techniques.
Table 1: Maximum IoU values for each method in Figure 8.
Baseline Augmented Image
Split
Image Split
Augmented
53.56% 60.09% 59.85% 60.07%
• Intersection over union (IoU). This metric is cal-
culated as the ratio between the area of the inter-
section of predictions and targets and this of their
union. The downside of this metric is that it tends
to assign low scores when the surface has not been
predicted with a very high degree of accuracy,
which in our case is an ill-posed problem given
that, as previously mentioned, the boundaries of
damages are many times unclear even to an ex-
pert annotator. Moreover, accurate segmentation
is not the goal of this system. On the other hand,
it has the advantage of determining how much of
the labeled surface has been predicted correctly,
reducing the influence of less-relevant, tiny dam-
ages. This metric has been computed over the to-
tal labeled/predicted area across the validation set
instead of per image, which is expected to give a
more accurate representation of the success rate in
such a small dataset.
In the following, we will analyze the results using
both the proposed metrics and a qualitative discussion
in order to provide a more complete insight.
Figure 7 shows the first of the proposed met-
rics, precision vs. recall, applied to the different ap-
proaches. Figure 8 shows the second one, with its
maximum values displayed in Table 1. For both met-
rics, it is clear that the baseline is overcome by all 3 of
our approaches, particularly so for the approaches in-
cluding our augmentation method. The latter seem to
be better at suppressing false positives, with their best
results being for lower confidence thresholds. This
Automated Damage Inspection of Power Transmission Towers from UAV Images
387
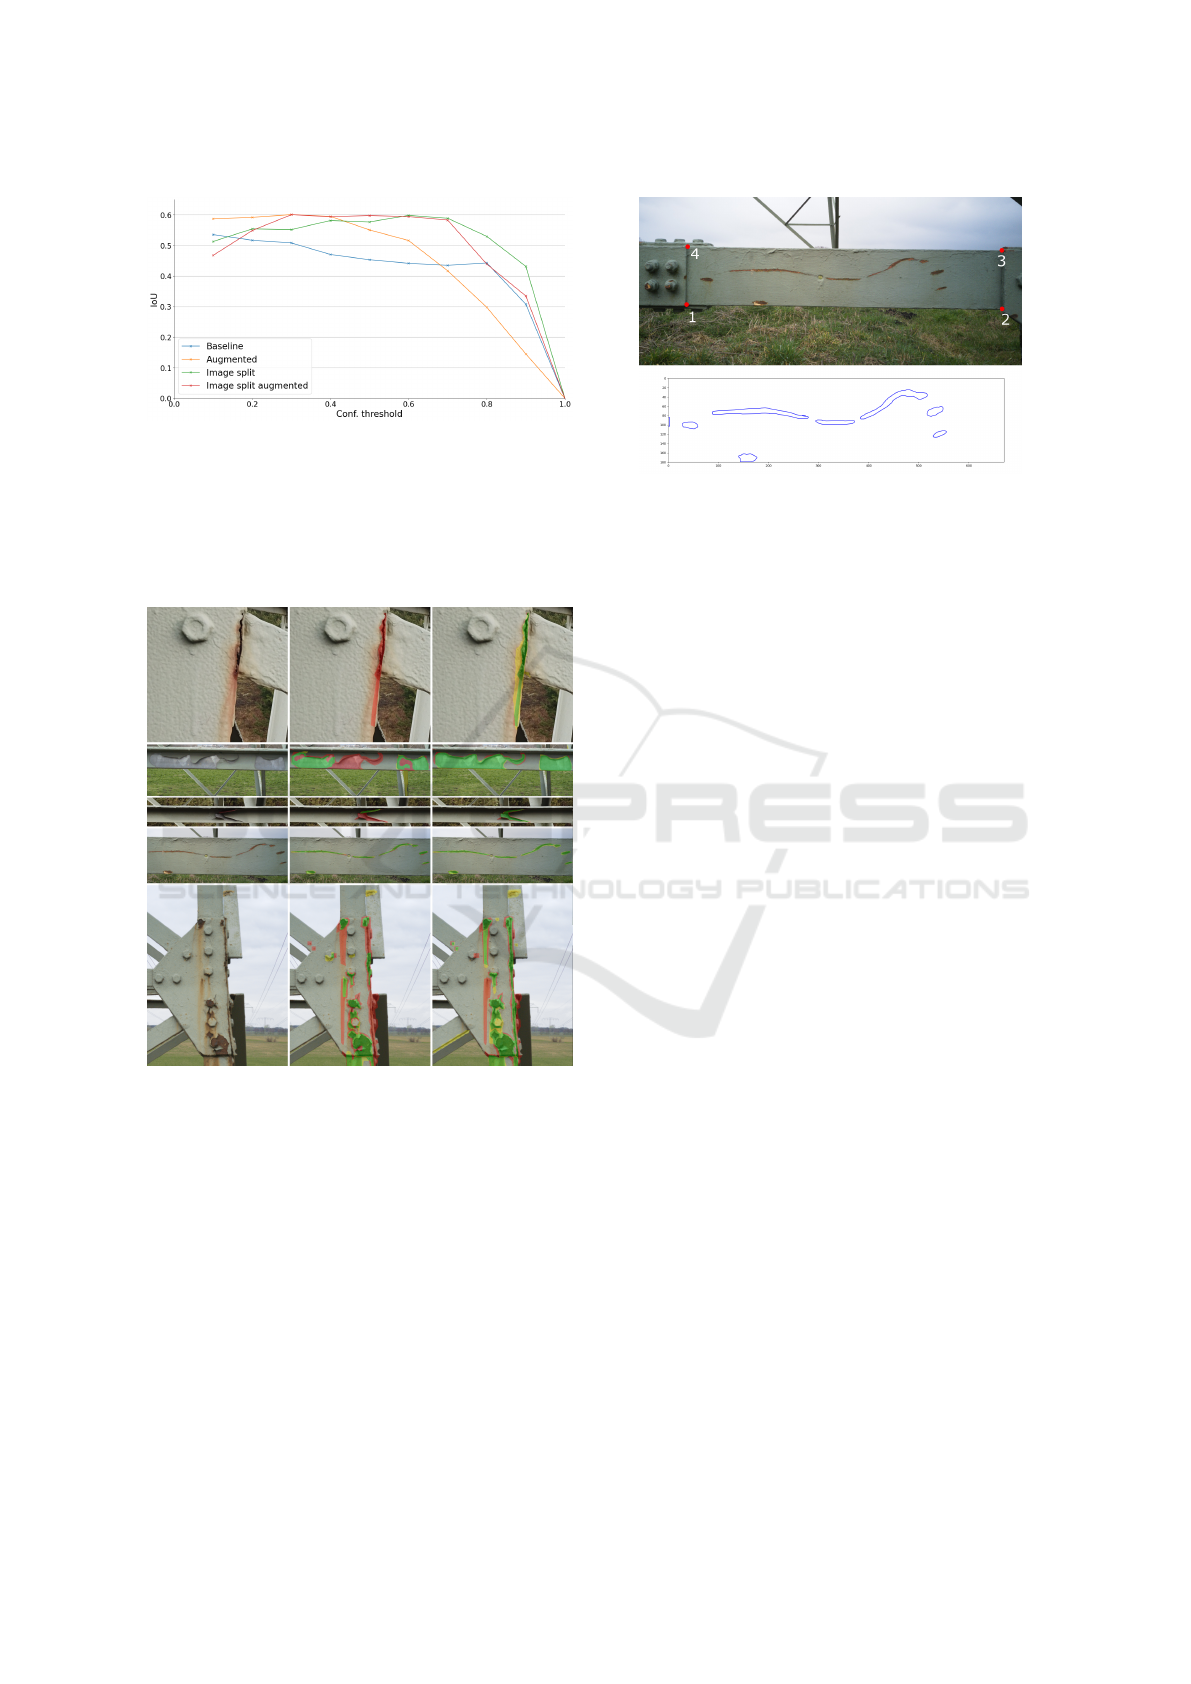
Figure 8: IoU values for each confidence threshold used for
the different approaches. Baseline (blue) corresponds to the
network trained without using any of the proposed improve-
ment techniques, Augmented (yellow), to the use of our so-
phisticated augmentation technique, Image Split (green), to
the use of the proposed subdivision of input images, and
Image Split Augmented (red) to the combination of these
two techniques.
Figure 9: Prediction examples. The left column corre-
sponds to parts of original images showing damages, the
middle one to the baseline approach, and the right one to
the approach using augmentation and image splitting. The
correctly detected areas are colored green, the undetected
areas labeled as damages, in red, and the false positives, in
yellow.
might be due to better examples being emphasized in
our training method, ignoring the bad ones. On the
other hand, the approaches using input image split-
ting have a higher maximum recall, which was ex-
pected due to the lower loss of resolution in the input.
The method including both techniques seems to offer
a good compromise solution. Figure 9 shows some
detection examples for the baseline method and our
proposed approach (the combined method).
Figure 10: On the top, a reference component with a dam-
age is shown. Below, the real measurements of the detected
damages.
From these examples, we can draw several con-
clusions. First, in some cases detections marked as
false positives are unclear and could very well have
been labeled as damages by a different annotator. The
exact borders of the damages, which often affect sub-
stantially the IoU score, could also in many instances
be subject of discussion. Other than this, we see that
most of the clearly visible damages have been seg-
mented with a reasonable level of accuracy by all
methods. However, some of the intra-class variations
have proven to be harder to detect, particularly those
cases in which the coating has fallen off, showing
the metal below, which is of a similar color. For
these, it is possible to see that our proposed best-
solution shows clearly better results than the base-
line approach, generalizing better for damage types
for which there are less examples or that are visually
more challenging to detect.
4 DISCUSSION
As discussed in the results section, most of the clearly
visible damages in the validation set have been rec-
ognized by the system. After having applied the
proposed techniques to improve the training, this in-
cludes most of the challenging intra-class variations,
such as the lack of paint without corrosion.
As for the undetected damages, for many of them
there are different reasonable labeling possibilities
and we expect that different annotators would gener-
ate different labels for such cases, perhaps with a rel-
atively low IoU score between them. Many others are
due to poor visibility. We expect that a denser image
coverage of the structures would yield better points of
view that would help solve this.
Given these results, we believe that the system
would be suitable for its purpose, namely minimiz-
VISAPP 2022 - 17th International Conference on Computer Vision Theory and Applications
388

ing human interaction in the inspection of structures
through automation. Although ideally its perfor-
mance could be improved by increasing the amount
of training data, the relatively high detection rate and
reduced number of false positives achieved are ex-
pected to guarantee a relevant speedup with respect
to human-only inspection. As a matter of fact, the
good segmentation results make it possible to deter-
mine the area of damaged components in many cases.
In an experiment, given the dimensions of a reference
component we calculated the damaged area, as shown
in Figure 10.
5 CONCLUSIONS
In this paper, we have proposed a system for auto-
mated detection of damages in power transmission
towers using drone images. We have successfully
overcome the limitations of the scarcity of training
data and the inherent ambiguity of part of it. These
challenges have been tackled using an instance seg-
mentation network and diverse techniques to optimize
the training suited to the particular conditions of the
available data. Furthermore, we have evaluated the
results obtained by the proposed methods, both quan-
titatively and qualitatively, and compared them to the
baseline. In doing so, we reached the conclusion that,
not only do these techniques improve the results, but
the resulting system shows a promising performance
that would make it suitable for our goal of automa-
tion. Thanks to our sophisticated augmentation, dam-
ages of different types are detected accurately even if
they are underrepresented or subjectively labeled in
the training data. We expect that the usage of this
system will help reduce the human input needed and
substantially speed up the whole process.
REFERENCES
Chao, P., Kao, C.-Y., Ruan, Y.-S., Huang, C.-H., and Lin,
Y.-L. (2019). Hardnet: A low memory traffic network.
In Proceedings of the IEEE/CVF International Con-
ference on Computer Vision, pages 3552–3561.
Dutta, A. and Zisserman, A. (2019). The VIA annotation
software for images, audio and video. In Proceedings
of the 27th ACM International Conference on Multi-
media, MM ’19, New York, NY, USA. ACM.
Girshick, R. (2015). Fast r-cnn. In Proceedings of the IEEE
international conference on computer vision, pages
1440–1448.
Gopalakrishnan, K., Gholami, H., Vidyadharan, A., Choud-
hary, A., and Agrawal, A. (2018). Crack damage
detection in unmanned aerial vehicle images of civil
infrastructure using pre-trained deep learning model.
Int. J. Traffic Transp. Eng, 8(1):1–14.
Lee, Y. and Park, J. (2020). Centermask: Real-time anchor-
free instance segmentation. In Proceedings of the
IEEE/CVF conference on computer vision and pattern
recognition, pages 13906–13915.
Lin, T.-Y., Doll
´
ar, P., Girshick, R., He, K., Hariharan, B.,
and Belongie, S. (2017). Feature pyramid networks
for object detection. In Proceedings of the IEEE con-
ference on computer vision and pattern recognition,
pages 2117–2125.
Lin, T.-Y., Maire, M., Belongie, S., Hays, J., Perona, P.,
Ramanan, D., Doll
´
ar, P., and Zitnick, C. L. (2014).
Microsoft coco: Common objects in context. In Euro-
pean conference on computer vision, pages 740–755.
Springer.
Morgenthal, G. and Hallermann, N. (2014). Quality assess-
ment of unmanned aerial vehicle (uav) based visual
inspection of structures. Advances in Structural Engi-
neering, 17(3):289–302.
P
´
erez, P., Gangnet, M., and Blake, A. (2003). Poisson im-
age editing. ACM Trans. Graph., 22(3):313–318.
Ronneberger, O., Fischer, P., and Brox, T. (2015). U-net:
Convolutional networks for biomedical image seg-
mentation. In International Conference on Medical
image computing and computer-assisted intervention,
pages 234–241. Springer.
Shah, M. P. (2017). Semantic segmenta-
tion architectures implemented in pytorch.
https://github.com/meetshah1995/pytorch-semseg.
Shihavuddin, A., Chen, X., Fedorov, V., Nymark Chris-
tensen, A., Andre Brogaard Riis, N., Branner, K.,
Bjorholm Dahl, A., and Reinhold Paulsen, R. (2019).
Wind turbine surface damage detection by deep
learning aided drone inspection analysis. Energies,
12(4):676.
Sony, S., Laventure, S., and Sadhu, A. (2019). A literature
review of next-generation smart sensing technology in
structural health monitoring. Structural Control and
Health Monitoring, 26(3):e2321.
Tian, Z., Shen, C., Chen, H., and He, T. (2019). Fcos:
Fully convolutional one-stage object detection. In
Proceedings of the IEEE/CVF international confer-
ence on computer vision, pages 9627–9636.
Varghese, A., Gubbi, J., Sharma, H., and Balamuralidhar,
P. (2017). Power infrastructure monitoring and dam-
age detection using drone captured images. In 2017
International Joint Conference on Neural Networks
(IJCNN), pages 1681–1687. IEEE.
Zhao, H., Shi, J., Qi, X., Wang, X., and Jia, J. (2017).
Pyramid scene parsing network. In Proceedings of
the IEEE conference on computer vision and pattern
recognition, pages 2881–2890.
Automated Damage Inspection of Power Transmission Towers from UAV Images
389
