
CLOSED: A Dashboard for 3D Point Cloud Segmentation Analysis using
Deep Learning
Thanasis Zoumpekas
1,2 a
, Guillem Molina
1
, Anna Puig
1 b
and Maria Salam
´
o
1 c
1
Department of Mathematics and Computer Science, University of Barcelona, Barcelona, Spain
2
Unit Industrial Software Applications, RISC Software GmbH, Softwarepark 35, Hagenberg, Austria
Keywords:
Segmentation, Point Clouds, Analysis, Dashboard, Data Visualization, Deep Learning.
Abstract:
With the growing interest in 3D point cloud data, which is a set of data points in space used to describe a 3D
object, and the inherent need to analyze it using deep neural networks, the visualization of data processes is
critical for extracting meaningful insights. There is a gap in the literature for a full-suite visualization tool to
analyse 3D deep learning segmentation models on point cloud data. This paper proposes such a tool to cover
this gap, entitled point CLOud SEgmentation Dashboard (CLOSED). Specifically, we concentrate our efforts
on 3D point cloud part segmentation, where the entire shape and the parts of a 3D object are significant. Our
approach manages to (i) exhibit the learning evolution of neural networks, (ii) compare and evaluate different
neural networks, (iii) highlight key-points of the segmentation process. We illustrate our proposal by analysing
five neural networks utilizing the ShapeNet-part dataset.
1 INTRODUCTION
Nowadays, deep learning is a highly studied field.
However, the detailed evaluation of such highly com-
plex intelligent models is still an open issue due to
the presence of millions of configurations, parame-
ters, and characteristics to tune (Dargan et al., 2019).
Recently, the need for better interpreting the results of
these techniques has appeared in the literature (Chatz-
imparmpas et al., 2020). Going beyond the accuracy-
related performance metrics of deep learning models,
other crucial factors should be considered in the eval-
uation process, such as the evolution of learning of the
model and/or the required time and/or the resources to
finish the learning process (Zoumpekas et al., 2021;
Garcia-Garcia et al., 2018). Furthermore, in complex
data formats, such as the point clouds, the interpreta-
tion of the results ends up being more challenging.
A point cloud is a set of data points in space that
represents a 3D shape or object, characterized by x,
y, and z coordinates and sometimes by color fea-
tures and intensity. Neural networks are considered
the most suitable models to handle and segment the
huge amount of points (i.e millions in most of the
a
https://orcid.org/0000-0002-3736-1155
b
https://orcid.org/0000-0002-2184-2800
c
https://orcid.org/0000-0003-1939-8963
cases) that a 3D point cloud dataset contains (Bello
et al., 2020). In this segmentation process, it is im-
portant not just to analyze the accuracy of the learn-
ing, but also to understand the learned parts of an ob-
ject and later visualize them (Nguyen and Le, 2013).
In the field of segmentation analysis, different neu-
ral network architectures have been proposed recently
to segment inner structures of point cloud, such as
(Qi et al., 2017a; Qi et al., 2017b; Yan et al., 2020).
However, it is a daunting task to decide which is the
most appropriate of them in each context. It depends
strongly on a considerable number of characteristics,
such as the parameters of the neural network itself,
the topology and shape of the object to be segmented,
the required learning time, the number of utilized
datasets, etc. Moreover, detailed performance evalua-
tion has a significant role in selecting the best neural
network and especially presents a high significance
in point cloud segmentation analysis, because of the
millions of points to segment.
Specifically, it is crucial to identify the character-
istics of the hardest and the easiest classes of point
clouds to learn or to determine in which iteration you
should stop the learning process. It is also important
to visually compare and check the values of the vari-
ous performance metrics with the actual rendering of
the resulted point cloud. Thus, evaluating in detail the
performance of a set of different deep learning mod-
Zoumpekas, T., Molina, G., Puig, A. and Salamó, M.
CLOSED: A Dashboard for 3D Point Cloud Segmentation Analysis using Deep Learning.
DOI: 10.5220/0010826000003124
In Proceedings of the 17th International Joint Conference on Computer Vision, Imaging and Computer Graphics Theory and Applications (VISIGRAPP 2022) - Volume 4: VISAPP, pages
403-410
ISBN: 978-989-758-555-5; ISSN: 2184-4321
Copyright
c
2022 by SCITEPRESS – Science and Technology Publications, Lda. All rights reserved
403
els on such highly complex and unstructured data, i.e.
point clouds (Bello et al., 2020), with just plain metric
values on various occasions and conditions can be an
overwhelming task. Thus, there is a need of a dash-
board visualization environment to aid users analyse,
compare and understand the trends and the insights in
complex data relationships (Friendly, 2008).
The advances in computer graphics and the need
for complex evaluation analysis of explanatory intel-
ligent machine learning algorithms bring to the fore-
ground the full-suite visualization systems, namely
dashboards (Pappas and Whitman, 2011), which may
incorporate a vast majority of metrics, graphs, com-
plex animations according to the exact case study.
In this paper, we present an interactive dash-
board to facilitate the 3D point cloud segmenta-
tion analysis, named point CLOud SEgmentation
Dashboard (CLOSED) aiming to evaluate and vi-
sualize in depth different aspects of the neural net-
works’ learning process. Some specific properties
of CLOSED are: (i) Ability to compare different
deep learning models by visualizing a variety of
performance metrics, (ii) Evaluation of individual
model performance on each learning epoch in order
to analyse their improvement in time, (iii) Meaning-
ful insights on the model failures and successes on
part segmentation by visualizing sampled shapes of
a point cloud dataset. The software of CLOSED
is available at GitHub in the following repository:
https://github.com/thzou/CLOSED dashboard.
2 RELATED WORK
There has been a rise in demand for dependable graph
representation tools for improving neural networks’
trust and explainability driving researchers to investi-
gate interactive visualization tools (Chatzimparmpas
et al., 2020). Also, transparency of machine learning
through visualizations, monitoring and interpretable
results is considered essential for both academic and
industrial users (Zhou and Chen, 2018).
Many methods and visualizations have been pro-
posed to aid the segmentation processes in the 2D do-
main, such as (Faulkner and Bhandarkar, 2003). In
the 3D domain, the existence of visualization tools for
monitoring and enhancing intelligent procedures are
fairly new. ModLayer is an interactive graphical user
interface for engaging with 3D data in MATLAB pro-
gramming environment (Hanhan and Sangid, 2019).
Also, (Escalera et al., 2011) presented a complete
framework of intelligent techniques to label multiple
regions of interest in 3D volumetric representations.
Moreover, (Sampathkmar et al., 2017) proposed a 3D
visualization framework with multiple applications in
natural, biomedical, and aerial photography segmen-
tation. Other studies offer visualization and segmen-
tation of 3D medical images through haptic rendering
and stereo graphic operations (Nystr
¨
om et al., 2009),
highlighting the need for efficient interactive tools for
segmentation and visualization in 3D medical images.
The need for 3D point cloud visualization to facili-
tate users is highlighted also in some research studies,
such as (Richter and D
¨
ollner, 2014), where Richter et
al. utilize a web-based visualization software to en-
able the better exploration of 3D point clouds.
However, the majority of the studies focus on cor-
recting and improving concrete segmentation meth-
ods rather than providing a comparison tool that al-
lows the end-user to evaluate, compare and decide the
best segmentation strategy according to the available
objects. Thus, in an attempt to cover the identified gap
of visualization tools for 3D point cloud analysis, we
propose the CLOSED tool. Following, we provide the
conceptualization of our study and description of our
software. Finally, we portray a showcase of CLOSED
involving practical visualization examples.
3 CONCEPTUALIZATION
In this section, we detail the concepts needed to frame
our dashboard visualization tool.
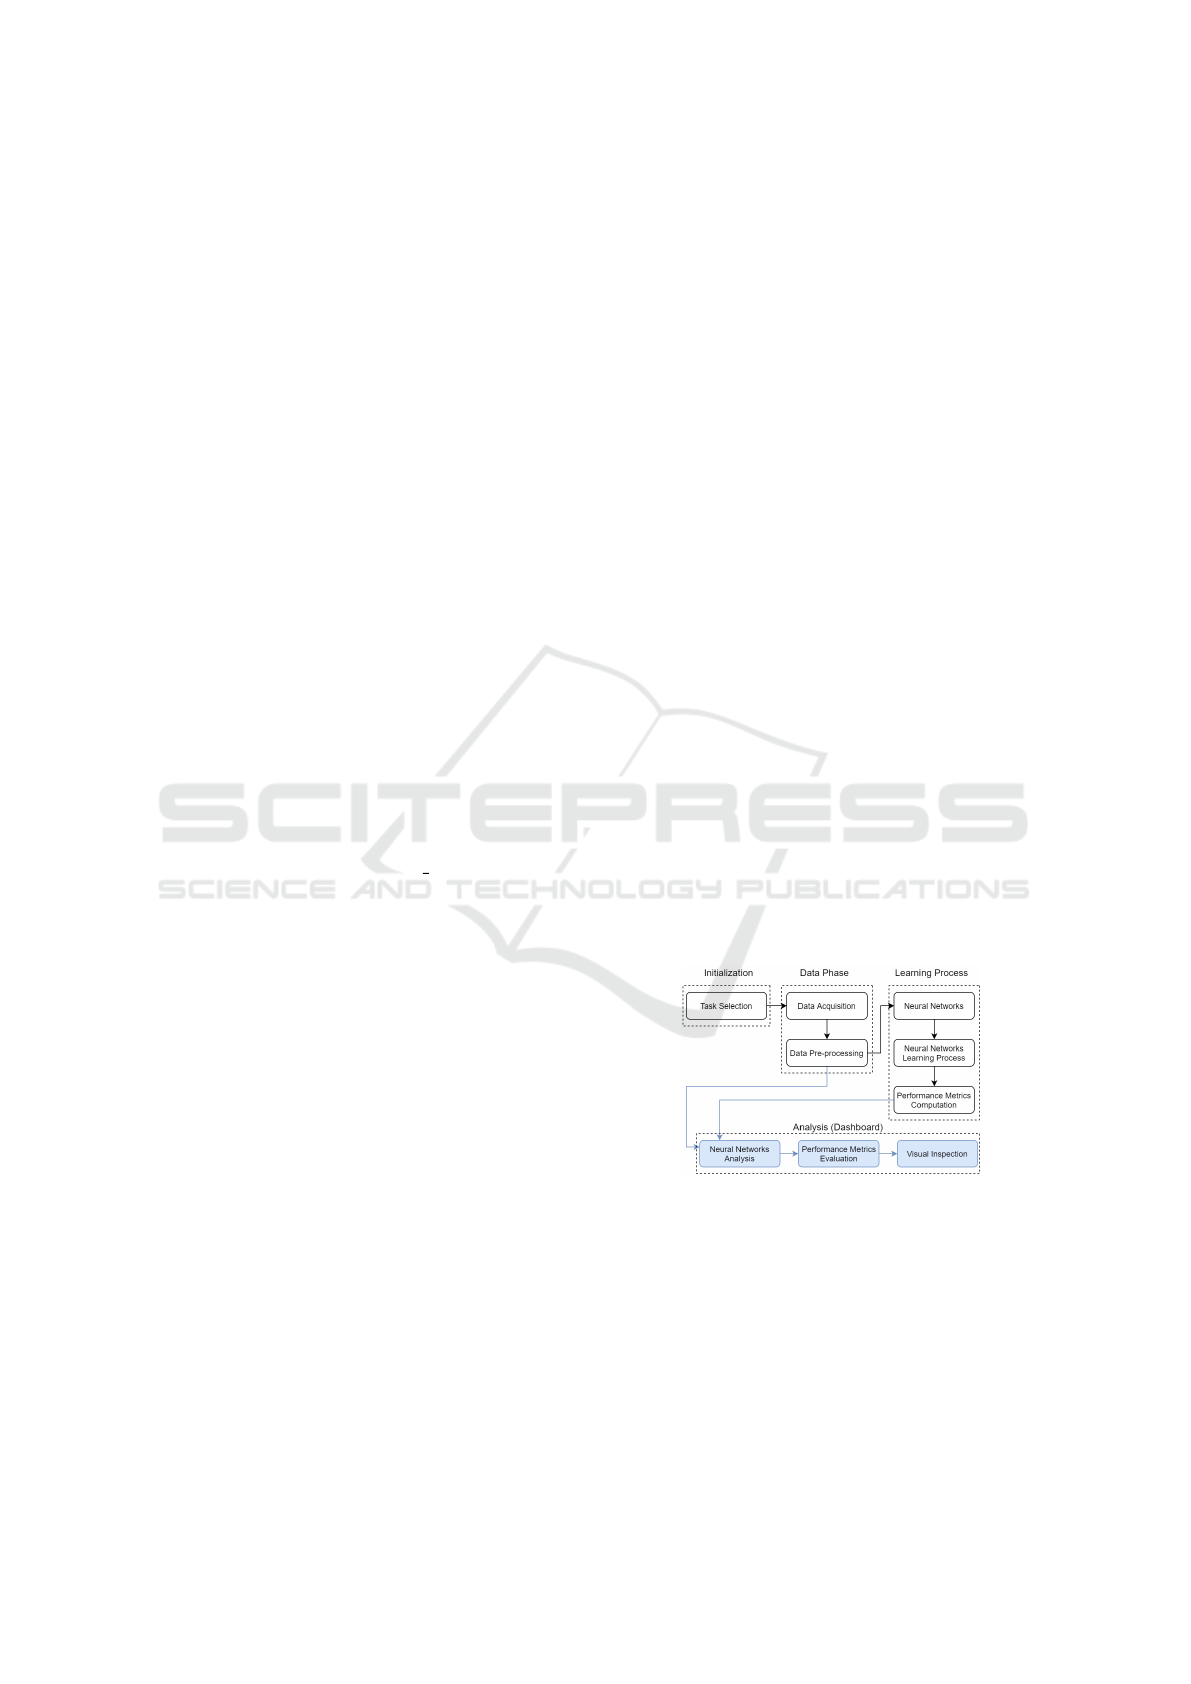
3.1 Deep Learning Models: Neural
Networks
Figure 1: Process overview - Analysis of point cloud data
using neural networks.
Neural networks are computational models able
to learn multiple degrees of abstraction for data rep-
resentations using several processing layers (Butkus
and Luko
ˇ
sevi
ˇ
cius, 2018). The overview of the pro-
cess of analyzing point cloud data using neural net-
works is depicted in Figure 1. This procedure involves
four stages: Initialization, Data Phase, Learning Pro-
cess and Analysis. First, the Initialization stage is de-
voted to the formulation of the problem and the se-
VISAPP 2022 - 17th International Conference on Computer Vision Theory and Applications
404

lection of the task to be analysed. The second stage
is responsible for the data acquisition and its pre-
processing, which involves the separation of the point
cloud datasets in different classes depending on the
type of the objects that they contain. Hence, each
class, i.e. type of object, is represented by a set of
point cloud files, or alternatively, instances. Each
class may include numerous point cloud objects (in-
stances). In the third stage, there is the selection of the
right neural network models for the task to be solved.
Also, the training, validation and testing of them and
the computation of the performance metrics for eval-
uation purposes take place in this stage. The results
of the Learning Process are used as input in the final
stage of the process, the Analysis, where the dash-
board visualization tool takes part in. The proposed
data visualization dashboard facilitates the interpreta-
tion of the whole modeling process by visually ana-
lyzing the models, comparing the performance met-
rics and providing information on the performance of
each individual model.
3.2 Evaluating Neural Networks:
Performance Metrics
In the segmentation performance analysis, it is im-
portant to include not only learning-related metrics,
such as the accuracy metrics, but also system-related
metrics, such as total runtime and memory allocation
(Garcia-Garcia et al., 2018; Zoumpekas et al., 2021).
It is also crucial to select the right model for an indi-
vidual’s needs according to the trade-off between the
learning-related and system-related metrics.
The commonly used learning-related (or accu-
racy) metric in point cloud segmentation is based on
Intersection over Union IoU. The majority of the
studies in segmentation analysis utilize this metric
and variants of it, such as (Qi et al., 2017a; Qi et al.,
2017b; Thomas et al., 2019; Liu et al., 2020; Liu et al.,
2019). We use two of the most used variants of the
IoU, the mean Intersection over Union (mIoU) ob-
tained by averaging across all Classes of the labelled
point clouds (CmIoU ) and all Instances of all classes
(ImIoU ), both detailed at (Liu et al., 2019).
Generalized metrics taking into account both
system-related and learning-related metrics appear in
(Zoumpekas et al., 2021), entitled the F
CmIoU
, F
ImIoU
and F
general
segmentation performance metrics. The
parameters (α and β) of the aforementioned metrics
provide a trade-off between accuracy and efficiency.
It should be noted that the process of analysing the
values of α and β leads to the selection of the best
neural network model.
Figure 2: Data processing workflow.
3.3 Description of Data Processing
The management and the processing of the point
cloud data along the process are illustrated in Fig-
ure 2. Initially, in Data Acquisition phase, point
cloud data is collected either from capturing devices
(i.e. real data), or simulations (i.e. synthetic data).
The pre-processing of the data takes place after the
data collection step, in Data Preparation phase, and it
mainly involves the cleaning of the data from noise
and missing values among other tasks. In the case
of segmentation process, the outcome of this step
is labelled point clouds with annotated inner regions
(parts) of the object. Mainly, each point cloud belongs
to a labelled class and has annotated (segmented)
parts. Synthetic datasets are often already labelled
and annotated. However, real data need to be labelled
and annotated in the Data Pre-processing phase.
Then, the Labelled Data is split in Learning Data
and Testing Data. Learning data are used to train
(Training Data) and validate (Validation Data) the se-
lected neural network model. The process involves
several iterations (epochs) between Model Training
and Model Evaluation, wherein each iteration the neu-
ral network is trained using the Training Data and
then validated using the Validation Data in order to
update its learning weights, as depicted in the Model
Learning stage in Figure 2. The resulted trained neu-
ral network model is tested using the Testing Data,
in the Model Testing step. Finally, we obtain the re-
sults of the Model Learning process. It is worth men-
tioning that the initial labels of the point clouds can
be referred as ”Ground truth”, the predicted ones as
”Predicted” and the error between them as ”Predic-
tion error”. Please note that, the output of the Model
Testing stage includes the results of training, valida-
tion and testing phases. These results are comprised
of the IoU metrics, GPU
mem
and t
total
.
4 CLOSED DASHBOARD DESIGN
In this section we explain every analysis capability
of CLOSED. The design of the dashboard visualiza-
tion tool is presented in Figure 3. The initial steps
to deploy the dashboard application are the availabil-
ity of point cloud data and the training of the neural
CLOSED: A Dashboard for 3D Point Cloud Segmentation Analysis using Deep Learning
405

networks in order to assess the performance of them
utilizing specific metrics. Afterwards, the dashboard
tool uses as input the obtained results of the aforemen-
tioned procedure and portrays meaningful insights di-
vided in four distinct tabs.
Briefly, the first tab, entitled General metrics, uti-
lizes generalized performance metrics, defined in Sec-
tion 3.2. The second one, entitled Per class anal-
ysis, focuses on the performance evaluation of the
neural networks regarding each individual class and
specifically on how accurately each neural network
has learned the distinct classes. The third one, entitled
Model analysis, emphasizes on comparisons between
the neural networks. Finally, the last one presents
visual comparisons and quality inspection of the ob-
tained results, which is entitled Visual inspection. The
CLOSED visualization dashboard is depicted in Fig-
ure 3, where all its tabs are clearly enumerated. Fol-
lowing, we explain in detail the design of each tab.
4.1 Generalized Performance Analysis
The first tab of CLOSED, namely General met-
rics, facilitates the comparisons across different deep
learning models based on the generalized metric,
F
general
. It provides the ability to interactively weight
the segmentation performance between accuracy and
time and memory efficiency of the models. We depict
the F
CmIoU
, F
ImIoU
and the arithmetic mean of those
F
general
in a bar chart format clearly indicating the im-
pact of accuracy and efficiency related metrics in the
segmentation performance of each model. It is worth
mentioning that the parameters α and β of the equa-
tions F
CmIoU
and F
CmIoU
respectively, can be adjusted
interactively. Additionally, a table shows the results
in plain numbers for detail comparisons between the
models. Figure 4 depicts a visualization example of
this tab. Please note, that a user can interactively add
its own neural network learning results in a dedicated
panel, entitled ”Add Model” in order to be analysed
and compared in this tab of CLOSED.
4.2 Per Class Analysis
The aim of the second tab of CLOSED, namely
Per class analysis, is to compare the segmentation
learning-related metrics of CmIoU and ImIoU of all
the trained and tested deep learning models in a chart.
We present and compare the CmIoU and ImIoU val-
ues across all learning epochs. Also, we show the
obtained mIoU per class, which facilitates the detail
comparison of deep learning models among different
object classes. A user is able to select and display
different neural networks, splits of the data, i.e. train-
ing, validation and test sets, and classes. Line chart
formats are used to show the evolution of the metrics
across the epochs and classes. It is worth mentioning
that users also can zoom in and out in all the charts
as well as hover over the points to see detailed infor-
mation. Figures 5 and 6 present example charts of the
second tab of CLOSED.
4.3 Model Specific Analysis
The aim of the third tab of CLOSED, namely Model
analysis, is to analyse the individual performance of
the neural networks among all the learning epochs.
The format of this tab is similar to the second one, i.e.
the per class comparison, however this tab focuses on
the learning results of each model. Specifically, line
charts display the evolution of the CmIoU and ImIoU
metrics among training, validation and test sets and
compare them to monitor learning related issues, such
as overfitting. Also, a chart depicts how a model per-
formed in each class of the input dataset. The user
can select a neural network model and evaluate its ac-
curacy detailed per class of objects along the epochs.
Moreover, Figure 7 shows an example of the individ-
ual model performance evaluation of this tab.
4.4 Visual Inspection and Comparisons
of Sampled Point Clouds
The fourth tab of CLOSED, namely Visual inspec-
tion, facilitates the analysis of the individual segmen-
tation performance of each model in multiple sampled
shapes of point clouds during all the learning epochs.
Line charts display the chosen point cloud evalua-
tion metrics detailing the inner segmented parts, i.e.
features, such as recall and precision, that are used
to evaluate per point accuracy in segmentation in
all learning epochs. However, just displaying the
graphs of segmentation accuracy is not enough to as-
sess learning failures. Thus, we also include three-
dimensional (3D) point cloud renderings to display
the sampled point cloud objects, where someone can
observe clearly the ground truth, the prediction, and
the error in each point cloud. Figures 9 and 8 illus-
trate examples of visual inspection and comparisons
of a specific sampled point cloud.
5 SHOWCASE OF CLOSED
This section describes a simulated analysis using the
visualizations of CLOSED.
VISAPP 2022 - 17th International Conference on Computer Vision Theory and Applications
406
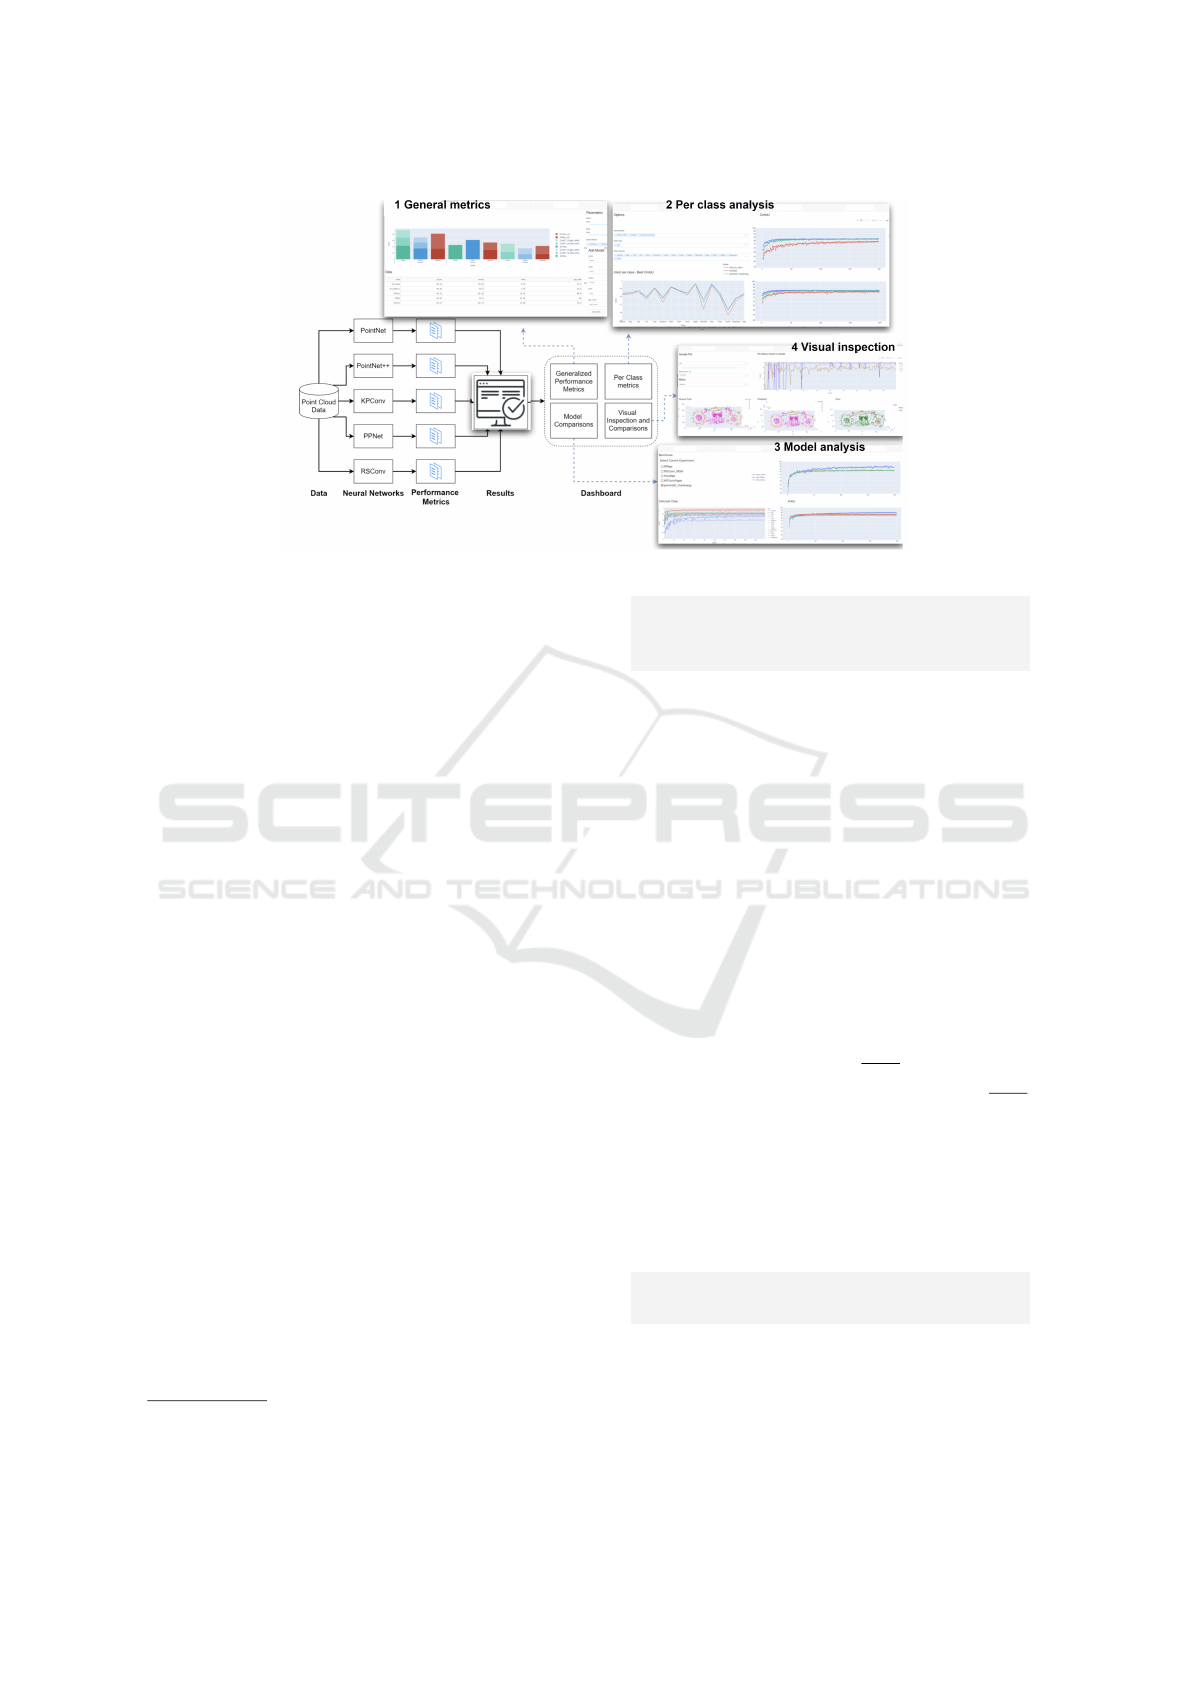
Figure 3: Design of the visualization tool. The numbered pictures denote the 4 distinct tabs of the dashboard.
5.1 Data and Models
The data used in this study is the popular and widely-
used ShapeNet data for part segmentation (Chang
et al., 2015; Yi et al., 2016). The dataset contains
16881 3D objects of point clouds that are organized in
16 different shape categories (or classes). Each shape
category is annotated with two to six parts, having 50
annotated parts in total. The labelled classes of ob-
jects are the following: airplane, bag, cap, car, chair,
earphone, guitar, knife, lamp, laptop, motorbike, mug,
pistol, rocket, skateboard and table, in alphabetical
order. More information of the ShapeNet data may be
found in its official and published papers and reposi-
tories (Chang et al., 2015; Yi et al., 2016).
For the simulation of the segmentation process
and the task of learning intelligent models from point
cloud data, we selected five of the most accurate
neural networks
1
for 3D part segmentation analysis.
Thus, the utilized deep learning models, i.e. neural
networks, are the following: (i) PointNet (Qi et al.,
2017a), (ii) PointNet++ (Qi et al., 2017b), (iii) Kernel
Point Convolution, abbreviated as KPConv (Thomas
et al., 2019), (iv) Position Pooling, denoted as PPNet
(Liu et al., 2020), and (v) Relation Shape Convolu-
tion, denoted as RSConv (Liu et al., 2019).
5.2 Possible Analysis Aspects
In this section, we show the potential of CLOSED
by answering four possible aspects of the many that
could be analysed.
1
https://paperswithcode.com/sota/3d-part-
segmentation-on-shapenet-part
Aspect 1. According to specific hardware re-
sources and time constraints which neural net-
work model is more appropriate to use?
Figure 4 presents the generalized performance
evaluation (obtained from tab 1 of CLOSED) of the
five selected neural networks with parameters α = 0.5
and β = 0.5, concerning balance between segmenta-
tion accuracy and efficiency of the deep learning mod-
els. Please note that the parameters α and β can be
adjusted interactively in range [0,1] according to the
needs of the user. For each model, we can observe
the F
general
, F
CmIoU
and F
ImIoU
and visually compare
the proportions of each part of their equations. For
instance, comparing the F
CmIoU
of PointNet++ neu-
ral network with the F
CmIoU
of KPConv, we can say
that PointNet++ comes first with F
CmIoU
= 0.95 ap-
proximately compared to F
CmIoU
= 0.65 and this is
mainly because the KPConv achieves lower values in
the efficiency related portions of the metric, i.e. the
one related to total run time (
(1−β)
2
∗ (1 − t
total
)) and
the one to average GPU memory allocation (
(1−β)
2
∗
(1 − GPU
mem
)). This helps the user to better under-
stand and interpret the proportions of each evaluation
metric and how all of them contribute to the general
performance. Additionally, this visualization triggers
an important practice of creating novel and special-
ized deep learning architectures, close to the needs of
each individual.
Aspect 2. In which learning epoch we could
stop the training process?
By analyzing Figures 5 (related to tab 2, namely
”Per class analysis”) and 7 (obtained from tab 3,
namely ”Model analysis”), a user can extract mean-
ingful information on the detection of the exact epoch
to stop the learning process of a neural network. It is
CLOSED: A Dashboard for 3D Point Cloud Segmentation Analysis using Deep Learning
407

Figure 4: F
general
metric with α = 0.5, β = 0.5 on PointNET,
PointNET++, KPConv, PPNET and RSConv.
worth noticing that a stop epoch could be the point,
where the neural network achieved a significantly
high accuracy value in the test data and then its ac-
curacy remains in more or less stable values. For in-
stance, in Figure 5 (b) KPConv achieves an ImIoU
value of almost 84% at the 25th epoch and then it re-
mains almost constant at this value until the end.
Indeed, CmIoU reflexes how well a model per-
formed across all classes, as explained in Section 3.1.
Figure 5 (a) displays the evolution of the aforemen-
tioned metric in 200 learning epochs of the five se-
lected neural networks in the test data. Also, it can
be easily displayed the same but in the training set
by using the filtering interactive buttons. Figure 5 (b)
portrays the per instance, i.e. per 3D object, mIoU ,
or alternatively the ImIoU performance metric. Sim-
ilarly as in the CmIoU occasion, we display the evo-
lution of the ImIoU metric in 200 learning epochs in
the test data.
Model specific analysis focuses on the per class
mIoU metric of each model. For instance, Figure 7
presents the mIoU segmentation accuracy of Point-
Net++ model that is obtained across all 200 learning
epochs in each class. It can be observed that lap-
top class has almost identical mIoU in all the epochs
while others, such as motorbike start from low values,
i.e. harder to learn, and they steadily increase until
the last epochs. Thus, depending on the 3D object
that we want to focus on, we could stop the learning
process earlier or later depending on the target class
of segmentation.
Aspect 3. Which are the most difficult (and eas-
iest) point cloud object classes to learn? Do all
the learning models have the same learning be-
haviour in all classes?
Each one of the selected deep learning models has
its particularities and its special design characteristics.
Therefore it is somehow expected that each of them
will perform better than the others in specific classes.
This is shown in Figure 6 (included in tab 2, namely
”Per class analysis”), where we can see that, for in-
stance, RSConv performed better than the PointNet
and PointNet++ by far in ”Motorbike” or ”Rocket”
class. However, it is worth mentioning that the perfor-
mance tendency of all models is the same. This fact
indicates the presence of ”ill” data classes of point
cloud objects, which are difficult to segment either be-
cause of the lack of enough data or, in general, present
more difficulties in feature learning.
Additionally, Figure 9 (included in tab 4, namely
”Visual inspection”) shows the per feature metrics of
each class, in this occasion, the precision metric. In
this way, we provide insights on the correct predic-
tion of each point belonging to a specific feature la-
bel. Thus, the information on the performance of both
class labels and inner class features aids the identifi-
cation of the difficult and easy point cloud classes of
objects to learn.
Aspect 4. To what extent the segmentation accu-
racy metric values are related to the visual rep-
resentation of the results?
By observing the accuracy metrics in Figures 5, 6
and 7 of the neural network models and object classes,
we can visually compare, check and interpret their
actual performance. In order to further facilitate the
fine-tuning of deep learning segmentation models and
to find specific issues on the modelling process, the
visualization of sampled point clouds is essential to
visually evaluate the results.
In this purpose, for example, we show in Figure
8 (included in tab 4, namely ”Visual inspection”) the
visualization of a chosen sampled point cloud with
class label ”motorbike”. Specifically, we show the
initial (actual) sampled point cloud, namely Ground
truth, the predicted point cloud, Predicted, and the
error between the actual and the predicted one, Pre-
diction error of two selected models, the PointNet
and RSConv. For clarification, the demonstrated se-
lection of models has been done according to Figure
6, where PointNet has the worst mIoU of about 0.64
in ”motorbike” class and RSConv the best one, with
approximately mIoU = 0.77.
In a randomly selected sampled point cloud in-
stance of the class ”motorbike” both models seem to
have properly segmented all the annotated parts of the
point cloud, as indicated by Figure 8 (e) and (f). How-
ever, by focusing on specific points we can identify
specific faults of each model and detect in which ex-
act points each model fail. Thus, except for the fine-
tuning of specific neural networks, Figure 8 could also
provide information for the visual comparison of the
actual performance of two or more neural networks.
Besides, by zooming into specific error areas in Fig-
ure 8 (e) and (f) facilitates the understanding of the
pros and cons of different neural network architec-
tures. It is worth noticing that we can choose the ex-
act epoch, out of the 200 epochs of the whole learning
process, and display Figure 8.
VISAPP 2022 - 17th International Conference on Computer Vision Theory and Applications
408
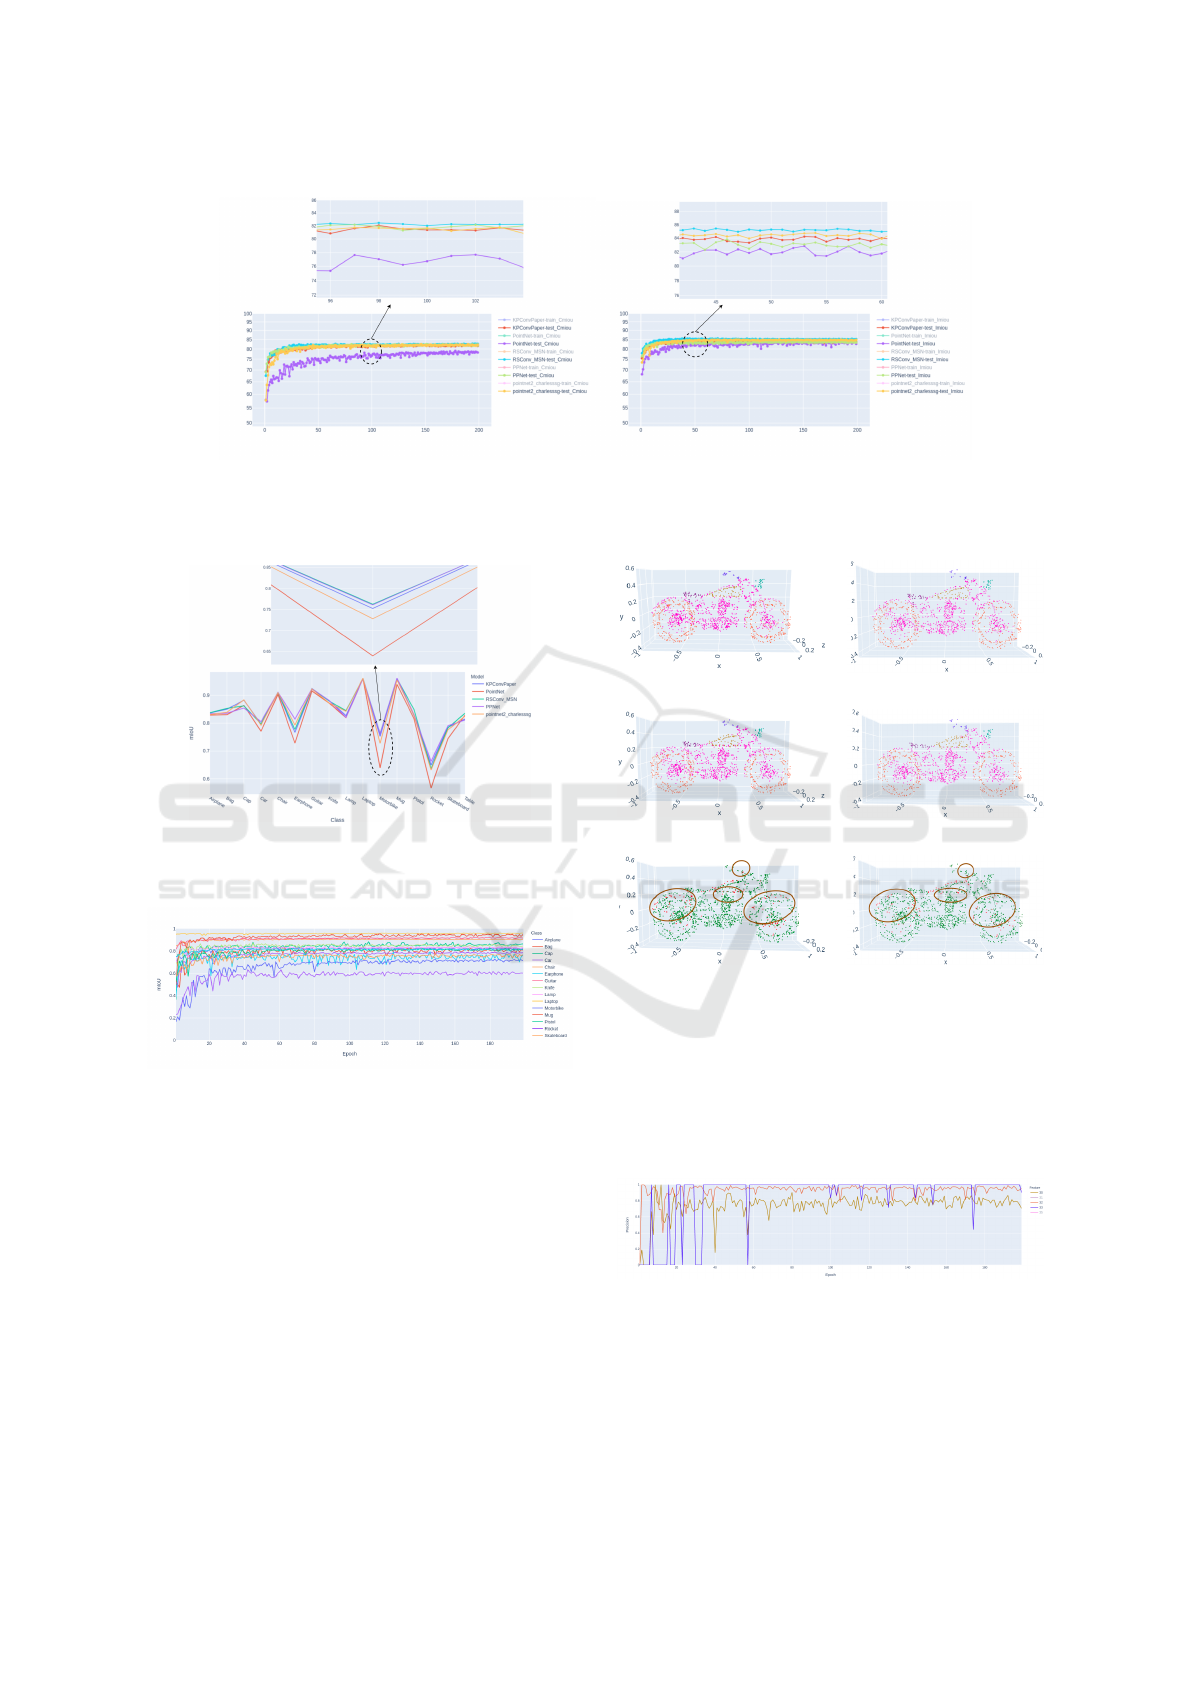
(a) CmIoU metric. (b) ImIoU metric.
Figure 5: Performance evaluation of different neural networks on the test set. The highlighted areas in the graphs show the
zooming feature of CLOSED, facilitating the comparisons among the neural networks.
Figure 6: Per class mIoU comparison between deep learn-
ing models on ShapeNet dataset. In the zoomed and high-
lighted area, we show the mIoU performance of the neural
networks in class ”motorbike”.
Figure 7: Evolution of mIoU metric through training epochs
of PointNET++ on ShapeNet dataset.
6 CONCLUSION
Visualization tools aid to a great extent the analysis of
deep learning models and intelligent solutions by of-
fering explainability and interpretability. Also, point
cloud segmentation analysis presents a great chal-
lenge in the computer science and engineering field.
In this paper, we fill the identified research gap in the
visualization of 3D point cloud segmentation analysis
and facilitate the interpretation of the results of neu-
ral networks by proposing the CLOSED visualization
tool. We provide multiple visualizations to answer a
(a) Ground truth - PointNet.
(b) Ground truth - RSConv.
(c) Predicted - PointNet.
(d) Predicted - RSConv.
(e) Prediction error - Point-
Net.
(f) Prediction error -
RSConv.
Figure 8: Sampled point cloud object - Comparisons be-
tween models. The different colours in (a), (b), (c), (d) de-
note the distinct parts of the point cloud. The colours green
and red in (e) and (f) denote the correctly and incorrectly
predicted points respectively. Also, in (e) and (f), the brown
circles highlight example areas that appear to have differ-
ences between the two neural networks.
Figure 9: Per feature performance metrics. In this exam-
ple, we show the Precision metric across the 200 epochs
of a randomly selected point cloud belonging to class ”mo-
torbike”, which is achieved by utilizing PointNet++ neural
network.
CLOSED: A Dashboard for 3D Point Cloud Segmentation Analysis using Deep Learning
409

great variety of analysis aspects that may arise dur-
ing the comparison and selection of neural networks
models on 3D part segmentation on point cloud ob-
jects. As future work, we plan to enhance the point
cloud renderings.
ACKNOWLEDGEMENTS
This project has received funding from
the European Union’s Horizon 2020 re-
search and innovation programme under
the Marie Skłodowska-Curie grant agree-
ment No 860843.
REFERENCES
Bello, S. A., Yu, S., Wang, C., Adam, J. M., and Li, J.
(2020). Review: Deep Learning on 3D Point Clouds.
Remote Sensing, 12(11):1729.
Butkus, L. and Luko
ˇ
sevi
ˇ
cius, M. (2018). A Polite Robot:
Visual Handshake Recognition Using Deep Learning.
In CEUR-WS, pages 78–83.
Chang, A. X., Funkhouser, T., Guibas, L., Hanrahan, P.,
Huang, Q., Li, Z., Savarese, S., Savva, M., Song,
S., Su, H., Xiao, J., Yi, L., and Yu, F. (2015).
ShapeNet: An Information-Rich 3D Model Reposi-
tory. arXiv:1512.03012.
Chatzimparmpas, A., Martins, R. M., Jusufi, I., Kucher, K.,
Rossi, F., and Kerren, A. (2020). The State of the Art
in Enhancing Trust in Machine Learning Models with
the Use of Visualizations. Computer Graphics Forum,
39(3):713–756.
Dargan, S., Kumar, M., Ayyagari, M. R., and Kumar, G.
(2019). A Survey of Deep Learning and Its Ap-
plications: A New Paradigm to Machine Learning.
Archives of Computational Methods in Engineering
2019 27:4, 27(4):1071–1092.
Escalera, S., Puig, A., Amoros, O., and Salam
´
o, M. (2011).
Intelligent GPGPU Classification in Volume Visual-
ization: A framework based on Error-Correcting Out-
put Codes. Computer Graphics Forum, 30(7):2107–
2115.
Faulkner, A. and Bhandarkar, S. (2003). An interactive
tool for segmentation, visualization, and navigation of
magnetic resonance images. Proc. of the IEEE Sym-
posium on Computer-Based Medical Systems, pages
340–345.
Friendly, M. (2008). A Brief History of Data Visualization.
Handbook of Data Visualization, pages 15–56.
Garcia-Garcia, A., Orts-Escolano, S., Oprea, S., Villena-
Martinez, V., Martinez-Gonzalez, P., and Garcia-
Rodriguez, J. (2018). A survey on deep learning tech-
niques for image and video semantic segmentation.
Applied Soft Computing, 70:41–65.
Hanhan, I. and Sangid, M. D. (2019). ModLayer: A MAT-
LAB GUI Drawing Segmentation Tool for Visualizing
and Classifying 3D Data. Integrating Materials and
Manufacturing Innovation, 1:3.
Liu, Y., Fan, B., Xiang, S., and Pan, C. (2019). Relation-
shape convolutional neural network for point cloud
analysis. In Proc. of the IEEE CVPR, volume 2019-
June, pages 8887–8896. IEEE Computer Society.
Liu, Z., Hu, H., Cao, Y., Zhang, Z., and Tong, X. (2020). A
Closer Look at Local Aggregation Operators in Point
Cloud Analysis. In LNCS, volume 12368, pages 326–
342.
Nguyen, A. and Le, B. (2013). 3D point cloud segmenta-
tion: A survey. In 2013 6th IEEE Conf. on Robotics,
Automation and Mechatronics (RAM), pages 225–
230. IEEE.
Nystr
¨
om, I., Malmberg, F., Vidholm, E., and Bengtsson, E.
(2009). Segmentation and Visualization of 3D Med-
ical Images through Haptic Rendering. In Pattern
Recognition and Information Processing.
Pappas, L. and Whitman, L. (2011). Riding the Technol-
ogy Wave: Effective Dashboard Data Visualization.
LNCS, 6771(PART 1):249–258.
Qi, C. R., Su, H., Mo, K., and Guibas, L. J. (2017a). Point-
Net: Deep learning on point sets for 3D classification
and segmentation. In Proc. - CVPR 2017, volume
2017-Janua, pages 77–85. IEEE Inc.
Qi, C. R., Yi, L., Su, H., Guibas, L. J., Li, C. R. Q., Hao,
Y., Leonidas, S., and Guibas, J. (2017b). PointNet++:
Deep hierarchical feature learning on point sets in a
metric space. In Advances in Neural Information Pro-
cessing Systems, volume 2017, pages 5100–5109.
Richter, R. and D
¨
ollner, J. (2014). Concepts and techniques
for integration, analysis and visualization of massive
3D point clouds. Computers, Environment and Urban
Systems, 45:114–124.
Sampathkmar, U., Surya Prasath, V. B., Meenay, S., and
Palaniappan, K. (2017). Assisted ground truth gener-
ation using interactive segmentation on a visualization
and annotation tool. Proc. - Applied Imagery Pattern
Recognition Workshop.
Thomas, H., Qi, C. R., Deschaud, J. E., Marcotegui, B.,
Goulette, F., and Guibas, L. (2019). KPConv: Flexible
and deformable convolution for point clouds. In Proc.
of the IEEE Int. Conf. on Computer Vision, volume
2019-Octob, pages 6410–6419. IEEE Inc.
Yan, X., Zheng, C., Li, Z., Wang, S., and Cui, S. (2020).
PointASNL: Robust Point Clouds Processing Using
Nonlocal Neural Networks With Adaptive Sampling.
In Proc. of the IEEE CVPR, pages 5588–5597. IEEE.
Yi, L., Kim, V. G., Ceylan, D., Shen, I. C., Yan, M., Su, H.,
Lu, C., Huang, Q., Sheffer, A., and Guibas, L. (2016).
A scalable active framework for region annotation in
3D shape collections. ACM Trans. on Graphics, 35(6).
Zhou, J. and Chen, F. (2018). 2D Transparency
Space—Bring Domain Users and Machine Learning
Experts Together. pages 3–19.
Zoumpekas, T., Molina, G., Salam
´
o, M., and Puig, A.
(2021). Benchmarking deep learning models on point
cloud segmentation. volume 339 of Frontiers in Ar-
tificial Intelligence and Applications, pages 335–344.
IOS Press.
VISAPP 2022 - 17th International Conference on Computer Vision Theory and Applications
410
