
Enhancement of Physiological Stress Classification using Psychometric
Features
Karl Magtibay
1 a
, Xavier Fernando
2 b
and Karthikeyan Umapathy
2
1
Faculty of Engineering and Architecture Science, Ryerson University, 350 Victoria St., Toronto, Ontario, Canada
2
Department of Electrical, Computer, and Biomedical Engineering, Ryerson University,
Keywords:
Stress, Well-being, Feature Extraction, Joint Data Analysis.
Abstract:
Psychological data features are underutilized in many acute stress studies since they are challenging to repli-
cate and validate due to their inherent subjectivity. However, psychology and perception play essential roles
in stress research according to the well-established allostatic load model. Therefore, we demonstrate the
importance of accounting for psychological data in acute stress research in an ambulatory setting through a
joint analysis. We enhanced stress classification by combining psychometric features with standard phys-
iological signal features. We used the publicly available Wearable Stress and Affect Database (WESAD),
from which we obtained physiological signals and psychological self-assessments from 15 participants. For
each participant, a set of physiologically relevant features were extracted from each signal type. In paral-
lel, we adapted psychometric features, positive emotion (PE
score
) and negative emotion (NE
scores
) scores, by
calculating the weighted average of self-evaluation scores. Using a stepwise feature selection and a linear-
discriminant-analysis-based classifier, we found that PE
scores
, along with select physiological signal features,
could enhance cross-validated stress classification accuracy by 8%, higher than a previous benchmark study
using the same dataset. More importantly, we found that such a classification accuracy could be achieved with
significantly fewer physiological signal features (by 20 times) with the aid of a psychometric feature. Finally,
we found that psychometric features could indicate the type of perceived stress relating to an individual’s mood
descriptor scores. Thus, a combination of psychometric and physiological data could be beneficial towards
improving the detection and management of stress and support the development of holistic stress models.
1 INTRODUCTION
Stress is a complex physiological, and psychological
response of the human body towards perceived or ac-
tual threats to its well-being (O’Connor et al., 2021).
Stress has been reported to cause many medical and
mental health issues experienced by workers in highly
demanding jobs, such as personal support workers
and healthcare practitioners (Pappa et al., 2020). In
addition, prolonged stress could induce many long-
term health issues like cardiovascular disease and de-
pression (Legault et al., 2017; O’Connor et al., 2021).
Therefore, persistent or chronic stress without proper
and regular intervention could be detrimental to an in-
dividual’s well-being.
Some stress studies on workers in harsh envi-
ronments primarily focused on using commercial-
a
https://orcid.org/0000-0001-5846-5327
b
https://orcid.org/0000-0001-7120-528x
grade wearables(Choi et al., 2011; Runkle et al.,
2019) or building wireless body area networks
(WBANs)(de Fazio et al., 2020; Wu et al., 2019) to
monitor and detect physiological and environmental
indicators of stress. Studies cited above are crucial
for developing stress studies standards, such as ex-
perimental protocols and devices, in a dynamic set-
ting such as the workplace. However, the psychologi-
cal correlates of stress, such as affect, perception, and
past experiences have been under-represented.
Evidence of the dynamic interaction of human
physiology and psychology in response to stres-
sors has been long established (Guidi et al., 2021;
McEwen and Rasgon, 2018). The interaction of dif-
ferent physiological and psychological systems in the
human body is the building block of the allostatic
model(Guidi et al., 2021; Fava et al., 2019; McEwen
and Rasgon, 2018). The allostatic model provides a
framework to elucidate the physiological and psycho-
430
Magtibay, K., Fernando, X. and Umapathy, K.
Enhancement of Physiological Stress Classification using Psychometric Features.
DOI: 10.5220/0010823300003123
In Proceedings of the 15th International Joint Conference on Biomedical Engineering Systems and Technologies (BIOSTEC 2022) - Volume 5: HEALTHINF, pages 430-437
ISBN: 978-989-758-552-4; ISSN: 2184-4305
Copyright
c
2022 by SCITEPRESS – Science and Technology Publications, Lda. All rights reserved
logical mechanisms that contribute to the overall wear
and tear of the body (allostatic load) as a result of
prolonged exposure to stressors. Although adminis-
tering psychological evaluations in a dynamic envi-
ronment is challenging, accounting for psychological
biomarkers along with physiological biomarkers of a
stress response could be beneficial to improve stress
classification tasks.
The disjunct in methods of measurement or as-
sessment of the stress response is apparent in some
studies. While some have focused on characterizing
stress through physiological signal features(Schmidt
et al., 2018; Choi et al., 2019), others solely relied
on evaluating its psychological effects through obser-
vational studies and self-reports analysis(Vitale et al.,
2021; Edmondson et al., 2014). A previous study by
(Schmidt et al., 2018) called for accounting psycho-
logical data from self-reports to improve physiolog-
ical characterization of stress and affective states for
individuals. The importance of psychological data to
stress modeling using ambulatory data has been pre-
viously shown (Hovsepian et al., 2015; Sarker et al.,
2016; Plarre et al., 2011) however, a joint quantitative
analysis of raw psychological and physiological stress
factors has been underutilized.
Our work highlights the importance of accounting
for psychological correlates of stress, such as affect
and perception, along with physiological signals from
wearable devices. We jointly analyze the physiologi-
cal signal and psychometric features to enhance stress
classification. In addition, we introduce new psycho-
metric features, the emotion scores, translated from
an established psychological questionnaire, and as-
sess their relevance in improving stress classification,
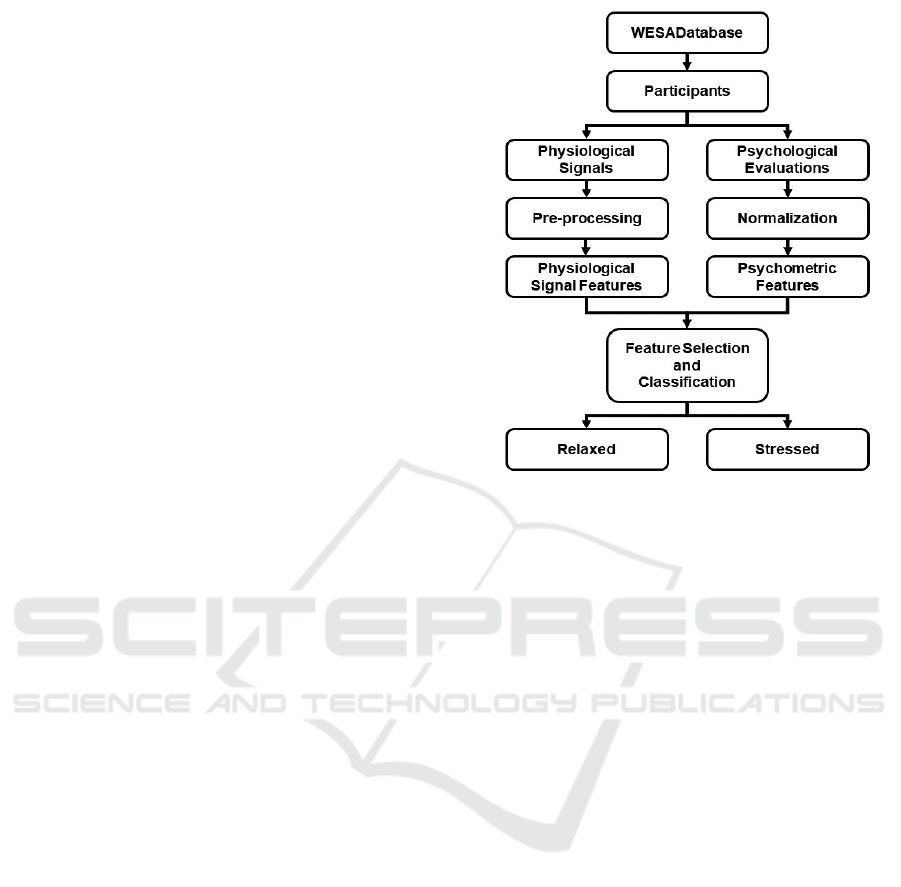
consistent with the allostatic load model. Outlined in
Figure 1 is the overall organization of our work pre-
sented in this paper.
2 METHODS
2.1 Database
Data used in this work was obtained from the Wear-
able Stress and Affect Database (WESAD) as part
of the study done by (Schmidt et al., 2018), made
available through the University of California Irvine’s
machine learning repository (Asuncion and Newman,
2007). Below, we briefly describe WESAD and sum-
marize its authors’ data collection methods relevant
to our proposed work. Then, we direct the reader to
(Schmidt et al., 2018) for a detailed description of the
data acquisition and validation of WESAD.
Figure 1: Overall organization of proposed study to improve
stress classification accuracy using both physiological and
psychometric data features.
WESAD provides a standard multi-modal dataset
for stress and affect detection in an ambulatory set-
ting. In addition, the authors of WESAD offered
benchmark classification results using standard data
features and machine learning methods for compari-
son against future stress and affect studies.
WESAD consists of physiological and psycholog-
ical data collected from 15 participants, 12 males and
3 females, with an average age of 27.5 ± 2.4 years
old. Physiological data from each participant were
obtained from two wearable devices, one strapped
around the chest (RespiBAN professional) and the
other around the wrist (Empatica E4). In this work,
we limited our data source to the chest device due
to its superior signal quality compared to the wrist
device. Therefore, from the chest device, only ac-
celerometer (ACC), plethysmograph (RESP), elec-
trocardiograph (ECG), electrodermal activity (EDA),
and temperature (TEMP) data were included for fea-
ture extraction.
Moreover, from all of the questionnaires used in
the Schmidt study, we chose only the Positive Affect
and Negative Affect Schedule (PANAS)(Crawford
and Henry, 2004) as the source of our psychometric
features since it was consistently used throughout that
study. The authors of WESAD added affect state de-
scriptors (i.e., Stressed, Frustrated, Happy, and Sad)
to the original PANAS questionnaire to suit the goals
of the original study. We used the ‘Stressed’ descrip-
tor as ground truth for later classification. Finally, we
Enhancement of Physiological Stress Classification using Psychometric Features
431

included data only from neutral/relaxed and stressed
states to perform binary classification.
2.2 Physiological Signal Feature
Extraction
Due to the length of both baseline (20 mins) and stress
(6.5 mins) conditions, we calculated signal features
within a sliding one-minute window on increments
of 10 seconds for all signal types. The set of sig-
nal features for each signal type were ensured to have
been proven in the literature to be physiologically rel-
evant in stress research. The median of sliding win-
dow increments for each physiological signal feature
was calculated for baseline and stress conditions. Ta-
ble 1 summarizes physiological signal features used
in this study.
2.2.1 Electrocardiograph (ECG)
Standard beats per minute (BPM), heart rate variabil-
ities (HRV), and its root mean squared (HRV
rms
) were
calculated from the ECG data. Moreover, features
of the HRV spectrum were calculated. HRV features
are critical because they can relate psychological pro-
cesses to physiological processes (Grossman and Tay-
lor, 2007). Therefore, to indicate physiological re-
sponse to stressful situations, we calculated the ratio
(HR
ratio
) of the area under the curve of low-frequency
bands (0.05 – 0.15 Hz) over high-frequency bands
(0.15 – 0.5 Hz), the HRVratio (Healey and Picard,
2005).
2.2.2 Plethysmograph (RESP)
Several relevant features were calculated from RESP
data. Respiration cycle features could provide
clues on blood-oxygen saturation, which is essen-
tial in maintaining proper organ function (Schmidt
et al., 2018). We calculated inhalation and ex-
halation duration (RESP
indur
& RESP
exdur
) and ra-
tio (RESP
ratio
), respiration duration (RESP
dur
), chest
stretch (RESP
stretch
), inhalation volume (RESP
invol
),
and respiration rate (RESP
rate
).
2.2.3 Respiratory Sinus Arrhythmia (RSA)
Respiratory sinus arrhythmia (RSA) describes irreg-
ularity in heart rate due to cardiac vagal efferent dis-
charge and time-alignment to breath cycles (Gross-
man and Taylor, 2007). It has been observed that
during inhalation, the heart beats faster and slower
during exhalation. In a highly stressful situation, hy-
perventilation could occur therefore increasing the oc-
currence of RSA (Campbell and Wisco, 2021; Tavel,
2021). Therefore, RSA is a multimodal feature, de-
pendent on both the ECG and RESP signals. The
RSA feature was calculated using the peak-valley
method(Grossman and Taylor, 2007) such that the
shortest beat interval during inhalation was subtracted
from the longest beat interval during exhalation. We
also calculated the beat number ratio between exhala-
tion over inhalation segments (RSA
ratio
). The respira-
tion window was extended 750 ms forward to account
for phase shifts between respiration and heart rates
in sync with respiratory rates (Grossman and Taylor,
2007).
2.2.4 Electrodermal Activity (EDA)
Skin conductance level (SCL) and skin conductance
response (SCR) are two components of the EDA sig-
nal. While SCL reflects general changes in autonomic
arousal, SCR indicates autonomic responses specific
to external stimuli (Boucsein, 2012). We separated
these components via regularized least-squares de-
trending method used by (Choi et al., 2011) in a previ-
ous study. However, no particular startle events were
noted in the Schmidt study; therefore, we included
only the statistical features from EDA’s SCL compo-
nents in our analysis.
2.2.5 Accelerometer (ACC) and Skin
Temperature (TEMP)
From ACC, we calculated an approximation of the
energy expenditure of each subject through the inte-
gral of the modulus of acceleration (IMA)(Karantonis
et al., 2006). Finally, we calculated the average skin
temperature (TEMP) for each subject within each
condition.
2.3 Psychometric Features
We calculated psychometric features, positive
(PE
score
) and negative (NE
score
), from each subject
based on their self-reported perceptions of emotional
descriptors within the PANAS questionnaires. Each
item in the questionnaire was scored using a 5-point
scale. A score of 1 indicates descriptor perception
as ‘Very Slightly’ or ‘Not at All’ while 5 as ‘Ex-
tremely.’ First, we grouped the questionnaire items
into 10 positive and 10 negative adjectives associated
with positive and negative emotions. Second, we
normalized the participants’ scores for each adjective
using min-max normalization, where 0 is the lowest
and 1 is the highest. We implemented a weighted
average (ρ
i j
, η
i j
) on the normalized scores (s
i j
) for
each subject (i) to calculate their PE
score
and NE
score
features such that
HEALTHINF 2022 - 15th International Conference on Health Informatics
432

Table 1: Summary of physiological signal features calculated from wearable data (Schmidt et al., 2018) for stress classifica-
tion.
Summary of physiological signal features
Signal type Feature Description
ECG
BPM Beats per minute
HRV Heart rate variability
HRV
rms
Root mean squared of HRV
HR
ratio
Ratio of low and high frequency bands of HRV spectrum
RESP
RESP
indur
Inspiration duration
RESP
exdur
Expiration duration
RESP
ratio
Ratio of RESP
indur
and RESP
exdur
RESP
dur
Overall respiration duration
RESP
stretch
Chest stretch due to respiration
RESP
invol
Inspiration volume
RESP
rate
Respiration rate
ECG & RESP RSA Respiratory sinus arrhythmia
EDA
SCL
mean
Average skin conductance level
SCL
std
Standard deviation of SCL
SCL
var
Variance of SCL
ACC IMA Integral of modulus of acceleration (energy expenditure)
TEMP TEMP Skin temperature
PE
score,i
=
10
∑
j=1
ρ
i j
s
i j
(1)
and
NE
score,i
=
10
∑
j=1
η
i j
s
i j
. (2)
The weights were calculated according to the ad-
jective groupings from a mood checklist(Crawford
and Henry, 2004). Based on the mood checklist,
negative emotions are weighed equally while positive
emotions have different subgroups hence have their
unique weights, and so a distinction between ρ
i j
and
η
i j
was made.
2.4 Feature Selection and Classification
Using SPSS®(George and Mallery, 2019), we per-
formed stepwise feature selection, with a 95% confi-
dence interval (α = 0.05), to determine a set of inputs
to a linear discriminant analysis (LDA) based classi-
fier that will yield the best cross-validated (CV) clas-
sification accuracy.
Selected features were served as inputs to the
LDA-based classifier to separate stressed individu-
als from those relaxed. Subject data was labeled as
‘stressed’ if they graded the corresponding descriptor
in the PANAS questionnaire between 2 and 5. Sub-
jects with a score of 1 for the same descriptor were la-
beled as ‘relaxed’ or ‘baseline.’ In total, 7 LDA mod-
els were generated, i.e., physiological only (Φ), psy-
chometric PE
score
(Ψ
P
), psychometric NEscore (Ψ
N
),
psychometric only (Ψ), physiological and psychome-
tric PE
score
(Φ, Ψ
P
), physiological and psychometric
NE
score
(Φ, Ψ
N
), and finally, physiological and psy-
chometric (Φ, Ψ). Due to sample size, prior prob-
abilities were adjusted based on the number of par-
ticipants in each group. We validated each classi-
fier model using the leave-one-out cross-validation
(LOOCV) method (George and Mallery, 2019).
3 RESULTS
Eight (8) participants experienced some degree of
stress during a controlled stress test, while 7 partici-
pants minimally experience stress. Participant reports
served as the ground truth for classification. Both
physiological and psychometric feature types were
fed to the LDA-based classifier. Table 2 shows the
detailed classification results and the confusion tables
for only 5 LDA-based models since only the combi-
nations of PE
score
with physiological signal features
improved classification accuracy.
Classification accuracy of 93.3% can be achieved
with only 3 physiological features, while 86.7% can
be achieved using the PE
score
feature. Furthermore,
when stepwise feature selection was applied to the
combined physiological and psychometric features,
3 physiological features and PE
scores
improved to a
perfect classification (100%), improving the previous
results presented by the benchmark study (Schmidt
et al., 2018) using the same binary classification
Enhancement of Physiological Stress Classification using Psychometric Features
433
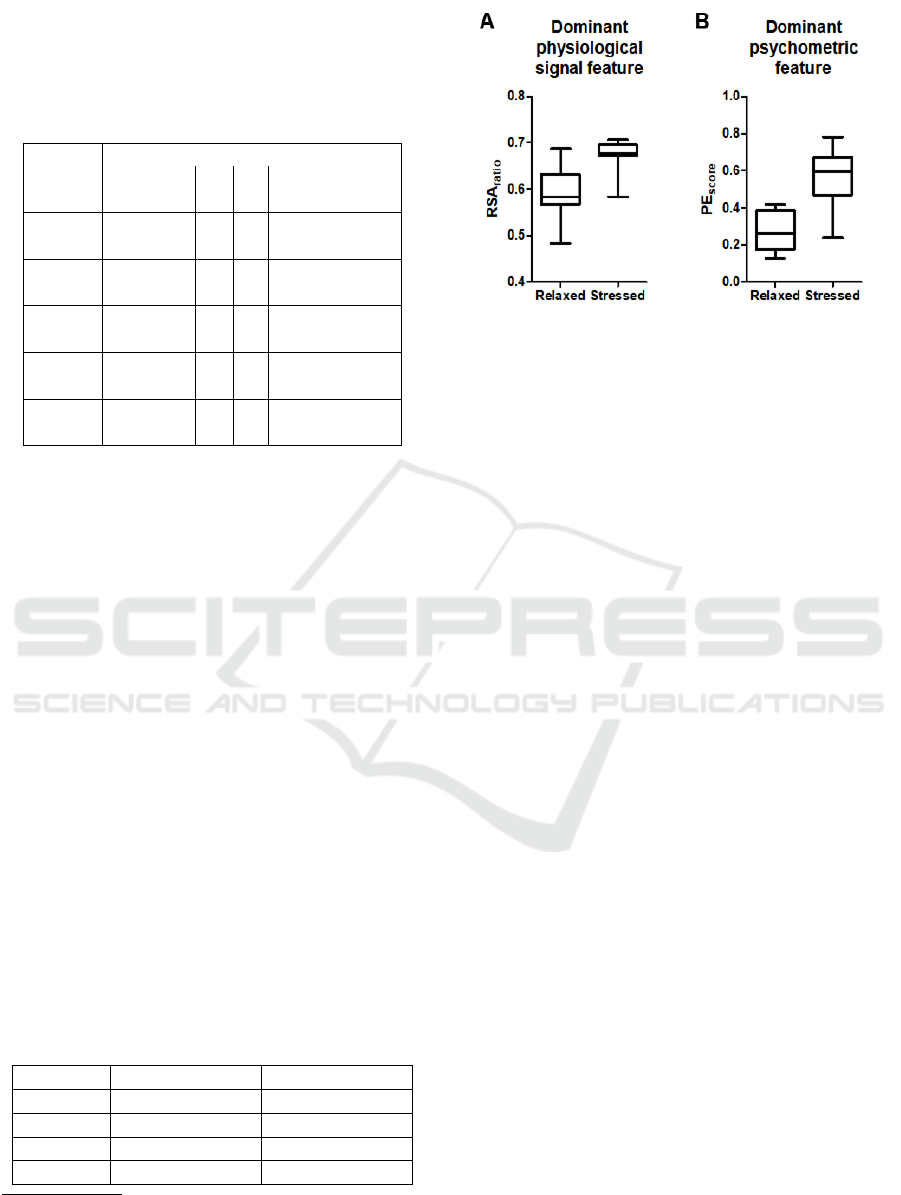
Table 2: Evaluation of stress classification performance
via leave-one-out cross validation (LOOCV) of linear dis-
criminant analysis-based classifier models. O: original, P:
predicted, Φ: physiological only, Ψ: psychometric only,
Ψ
P
: psychometric PE
score
, Ψ
N
: psychometric NE
score
, and
PE
score
(Φ, Ψ
P
): physiological and psychometric PE
score
.
Model
Confusion Matrix
LOOCV (%)
H
H
H
H
H
O
P
R S
Φ
R 7 0
93.3
S 1 7
Ψ
R 6 1
86.7
S 1 7
Ψ
P
R 6 1
86.7
S 1 7
Ψ
N
R 6 1
80.0
S 2 6
Φ, Ψ
P
R 7 0
100.0
S 0 8
method by 8%
1
. In addition, our results show that
such classification accuracy could be achieved with
20 times fewer physiological signal features com-
pared to the same study above. Although the results
obtained are from a small dataset, our results demon-
strate potential in the joint analysis of physiological
and psychometric features to enhance stress classifi-
cation.
Table 3 shows the descriptive statistics of the se-
lected features, RSA
ratio
, HRV
ratio
, IMA, and PE
score
.
We also show in Figure 2 the comparison of the distri-
bution of values of a physiologically dominant signal
feature, RSA
ratio
, and the dominant psychometric fea-
ture PE
score
.
We demonstrate that stressful conditions increase
an individual’s RSA
ratio
values. Specifically, the av-
erage number of beats during exhalation was higher
than during inhalation in stressed individuals, which
explains their higher RSA
ratio
values.
Furthermore, we observed a significant increase
in HRV
ratio
values in stressed individuals, which re-
flects the degree of sympathetic over parasympa-
thetic nervous activity, respectively. A closer ex-
Table 3: Selected features for stress classification and fea-
tures descriptive statistics.
Features Relaxed (n = 7) Stressed (n = 8)
RSA
ratio
0.59 ± 0.06 0.67 ± 0.04
HRV
ratio
2.77 ± 1.77 5.28 ± 4.43
IMA 53, 575 ± 8, 625 50, 484 ± 5, 428
PE
score
0.28 ± 0.11 0.56 ± 0.16
1
(Φ, Ψ
N
) and (Φ, Ψ) are not shown in table 2 since they
do not improve LOOCV results beyond (Φ, Ψ
P
) provided,
therefore are redundant.
Figure 2: Distribution comparison between relaxed and
stressed states of a dominant physiological signal feature,
RSA
ratio
(A), and a psychometric feature, PE
score
(B), for
stress classification.
amination of the area under the low-frequency HRV
spectrum reveals that, while it remained higher than
its high-frequency component for both states, there
was a significant increase in its median values in
stressed individuals compared to those who were re-
laxed (stressed: 74% vs. relaxed: 56%). Such an ob-
servation indicates that individuals under stress have
a greater sympathetic nervous response (i.e., fight-or-
flight) than those in a neutral state, as corroborated by
earlier studies(Choi et al., 2011; Healey and Picard,
2005).
Energy expenditure, as approximated by IMA, de-
creased in individuals under stress. Due to the nature
of IMA calculation (i.e., the sum of integrals of each
accelerometer axis channel), a decrease in an indi-
vidual’s IMA indicates a reduction in an individual’s
overall movement during stress, decreasing their en-
ergy expenditure. This observation could be due to an
evolutionary tendency to conserve energy when faced
with challenges (Pontzer, 2015); however, this war-
rants further investigation within the scope of stress
research in an ambulatory setting as well as an exam-
ination of the stress protocol of a study.
Interestingly, one of our psychometric features,
PE
score
, is also an important feature for stress classifi-
cation. Although PE
score
and NE
score
increased for in-
dividuals during stress, 78% and 50% more than base-
line values, respectively, PE
score
remained higher than
NE
score
in both states suggesting participants experi-
enced eustress (positive stress) through a stress pro-
tocol indicating an overall positive engagement. Nat-
urally, as they were subjected to stressful situations,
individuals’ distress (negative stress) became more
prominent. Different stress types have been previ-
ously described (Le Fevre et al., 2003), and the trend
shown from our psychometric features is concordant
to their observations.
HEALTHINF 2022 - 15th International Conference on Health Informatics
434

It is important to note that PE
score
are based on
the weighted average of the positive mood descriptors
as assessed by each individual. While we achieved a
perfect classification with the inclusion of this psy-
chometric feature, we did not include in its calcu-
lation a participant’s perceived stress score. Many
versions of the PANAS questionnaire have been pre-
viously introduced (i.e., PANAS-C(Laurent et al.,
1999), I-PANAS-SF(Thompson, 2007), and PANAS-
X(Watson and Clark, 1999)) however no version of
the PANAS questionnaire include a ’Stressed’ de-
scriptor. A ’Stressed’ descriptor was added by the au-
thors of WESAD in their PANAS questionnaire to suit
the goals of the original classification study. There-
fore, the perceived stress score of a subject was not
accounted in the calculation of our psychometric fea-
tures and was used only as a label for binary classifi-
cation as described above.
4 DISCUSSIONS
We introduced new psychometric features to enhance
stress classification using physiological data from
wearable technologies obtained from WESAD. Our
psychometric features, derived from traditional ques-
tionnaires from psychological evaluations, were used
to perform a joint analysis with physiologically rele-
vant features for stress research. More importantly,
we demonstrated that stress classification could be
improved when both the physiological and psycho-
logical components of stress are considered.
In comparison, the work by Nkurikiyeyezu et al
(Nkurikiyeyezu et al., 2019) provided a simple frame-
work for creating person-specific models to predict
stress using only physiological signals. Their pro-
posed framework achieved a classification accuracy
of 95.2%, comparable to the results of the original
WESAD study. Another WESAD-based study by Lai
et al (Lai et al., 2021) introduces a stress monitoring
assistant that demonstrates a 96.7% binary stress clas-
sification accuracy using only features of chest-based
physiological signals. However, the above examples
do not account for the available psychological data as
part of the feature pool for later classification and pre-
diction tasks.
While our work does not introduce any stress
models or frameworks, we emphasize the importance
of a joint analysis of physiological and psychologi-
cal data to improve stress classification tasks. As pre-
viously described through the allostatic load model,
physiological and psychological systems are closely
intertwined, if not cascaded. A physiological re-
sponse could be a result of psychological stressors
and vice versa. Moreover, physiological and psycho-
logical systems could provide concerted reactions to
external stressors. While the relationship of physi-
ological and psychological systems has been previ-
ously established in stress research, the contribution
of psychological data to stress classification tasks is
under-recognized.
Self-reports in a dynamic environment are chal-
lenging to validate and replicate due to their inherent
subjectivity. Person-specific models and frameworks
that consider psychological data also require regu-
lar calibration and updates as both physiology and
psychology change over time(Nkurikiyeyezu et al.,
2019), especially in the context of stress and allostatic
load since they are only observed after extended ex-
posure to stressors. However, as we demonstrated in
this work, when physiological and psychological data
are jointly analyzed, stress classification tasks could
be improved, and the number of physiological signal
features needed could be greatly reduced. Evidence
and recommendations from previous works(Schmidt
et al., 2018; Hovsepian et al., 2015; Sarker et al.,
2016; Plarre et al., 2011) provide further motivation
for the inclusion of psychological data in stress clas-
sification tasks.
While we present good stress classification accu-
racy, we acknowledge that our work has limitations.
We recognize that our stress classification task could
be affected by choice of features and pre-processing
methods. Recommendations for analysis window du-
rations for different physiological signals are in the
literature (i.e., HRV (Shaffer and Meehan, 2020) and
EDA (Boucsein, 2012)). Our choice of analysis win-
dow is in keeping with the WESAD benchmark study
(Schmidt et al., 2018), which was based on previ-
ous work by (Kreibig, 2010). On the other hand,
our choice of features was based on existing literature
cited presented in our Methods section. We were care-
ful to select our signal features so that they could ad-
equately represent a stress response. While this strat-
egy naturally decreases the amount of features fed in
to an classification algorithm, it ensures sufficient rep-
resentation of an individual’s autonomic activity re-
lated to external stressors.
We also recognize that our choice of database lim-
its the sample size on which we could test our new
psychometric features. Indeed, a 15-subject cohort is
a small sample size. Subject recruitment for human-
centric studies in biomedical or biomedical-adjacent
fields remains a significant challenge especially for
short-term studies such as acute stress. Despite the
limited number of subjects, we ensured that our meth-
ods for classification and cross-validation were suit-
able for small sample sizes, such as LOOCV.
Enhancement of Physiological Stress Classification using Psychometric Features
435

Future work aims to collect and analyse data from
a larger cohort of subjects to further test and validate
our psychometric features. In addition, we aim to use
our validated psychometric features to create a holis-
tic predictive model concordant with the established
allostatic load model(McEwen and Rasgon, 2018),
giving greater focus on chronic stress and its effect
on a person’s overall well-being.
5 CONCLUSIONS
We demonstrated the importance of including psy-
chological data in an acute stress study. Through a
joint analysis of physiological and psychological fea-
tures, we showed that stress classification could be
enhanced. Furthermore, accounting for psychomet-
ric data reduces the number of physiological signal
features needed stress classification. We also found
that our psychometric features could aid in identifying
the type of stress (eustress or distress) an individual
perceives, as indicated by a self-assessment question-
naire’s independent contributions of each mood de-
scriptor (affect). Our work provides an incremental
step towards translating affect linked to stress to suit-
able quantitative measurements similar to those of-
fered by physiological sensors. Joint analysis of psy-
chological and physiological data could be beneficial
towards the detection and management of stress. Fur-
thermore, our work could support the future devel-
opment of holistic stress models consistent with the
well-established allostatic load model. Such models
could be beneficial for workers in harsh environments
like healthcare and personal support workers.
REFERENCES
Asuncion, A. and Newman, D. (2007). Uci machine learn-
ing repository.
Boucsein, W. (2012). Electrodermal activity. Springer Sci-
ence & Business Media.
Campbell, A. A. and Wisco, B. E. (2021). Respiratory si-
nus arrhythmia reactivity in anxiety and posttraumatic
stress disorder: A review of literature. Clinical Psy-
chology Review, page 102034.
Choi, B., Jebelli, H., and Lee, S. (2019). Feasibility analy-
sis of electrodermal activity (eda) acquired from wear-
able sensors to assess construction workers’ perceived
risk. Safety science, 115:110–120.
Choi, J., Ahmed, B., and Gutierrez-Osuna, R. (2011). De-
velopment and evaluation of an ambulatory stress
monitor based on wearable sensors. IEEE trans-
actions on information technology in biomedicine,
16(2):279–286.
Crawford, J. R. and Henry, J. D. (2004). The positive and
negative affect schedule (panas): Construct validity,
measurement properties and normative data in a large
non-clinical sample. British journal of clinical psy-
chology, 43(3):245–265.
de Fazio, R., Cafagna, D., Marcuccio, G., Minerba, A., and
Visconti, P. (2020). A multi-source harvesting system
applied to sensor-based smart garments for monitor-
ing workers’ bio-physical parameters in harsh envi-
ronments. Energies, 13(9):2161.
Edmondson, D., Green, P., Ye, S., Halazun, H. J., and
Davidson, K. W. (2014). Psychological stress and 30-
day all-cause hospital readmission in acute coronary
syndrome patients: an observational cohort study.
PloS one, 9(3):e91477.
Fava, G. A., McEwen, B. S., Guidi, J., Gostoli, S., Offi-
dani, E., and Sonino, N. (2019). Clinical characteri-
zation of allostatic overload. Psychoneuroendocrinol-
ogy, 108:94–101.
George, D. and Mallery, P. (2019). IBM SPSS statistics 26
step by step: A simple guide and reference. Routledge.
Grossman, P. and Taylor, E. W. (2007). Toward understand-
ing respiratory sinus arrhythmia: Relations to cardiac
vagal tone, evolution and biobehavioral functions. Bi-
ological psychology, 74(2):263–285.
Guidi, J., Lucente, M., Sonino, N., and Fava, G. A.
(2021). Allostatic load and its impact on health: a
systematic review. Psychotherapy and psychosomat-
ics, 90(1):11–27.
Healey, J. A. and Picard, R. W. (2005). Detecting stress dur-
ing real-world driving tasks using physiological sen-
sors. IEEE Transactions on intelligent transportation
systems, 6(2):156–166.
Hovsepian, K., Al’Absi, M., Ertin, E., Kamarck, T., Naka-
jima, M., and Kumar, S. (2015). cstress: towards a
gold standard for continuous stress assessment in the
mobile environment. In Proceedings of the 2015 ACM
international joint conference on pervasive and ubiq-
uitous computing, pages 493–504.
Karantonis, D. M., Narayanan, M. R., Mathie, M., Lovell,
N. H., and Celler, B. G. (2006). Implementa-
tion of a real-time human movement classifier us-
ing a triaxial accelerometer for ambulatory monitor-
ing. IEEE transactions on information technology in
biomedicine, 10(1):156–167.
Kreibig, S. D. (2010). Autonomic nervous system activ-
ity in emotion: A review. Biological psychology,
84(3):394–421.
Lai, K., Yanushkevich, S. N., and Shmerko, V. P. (2021).
Intelligent stress monitoring assistant for first respon-
ders. IEEE Access, 9:25314–25329.
Laurent, J., Catanzaro, S. J., Joiner Jr, T. E., Rudolph, K. D.,
Potter, K. I., Lambert, S., Osborne, L., and Gathright,
T. (1999). A measure of positive and negative affect
for children: Scale development and preliminary vali-
dation. Psychological assessment, 11(3):326.
Le Fevre, M., Matheny, J., and Kolt, G. S. (2003). Eu-
stress, distress, and interpretation in occupational
stress. Journal of managerial psychology.
HEALTHINF 2022 - 15th International Conference on Health Informatics
436

Legault, G., Clement, A., Kenny, G. P., Hardcastle, S., and
Keller, N. (2017). Cognitive consequences of sleep
deprivation, shiftwork, and heat exposure for under-
ground miners. Applied ergonomics, 58:144–150.
McEwen, B. S. and Rasgon, N. L. (2018). The brain and
body on stress: Allostatic load and mechanisms for
depression and dementia.
Nkurikiyeyezu, K., Yokokubo, A., and Lopez, G. (2019).
The effect of person-specific biometrics in improv-
ing generic stress predictive models. arXiv preprint
arXiv:1910.01770.
O’Connor, D. B., Thayer, J. F., and Vedhara, K. (2021).
Stress and health: A review of psychobiological pro-
cesses. Annual review of psychology, 72:663–688.
Pappa, S., Ntella, V., Giannakas, T., Giannakoulis, V. G.,
Papoutsi, E., and Katsaounou, P. (2020). Prevalence
of depression, anxiety, and insomnia among health-
care workers during the covid-19 pandemic: A sys-
tematic review and meta-analysis. Brain, behavior,
and immunity, 88:901–907.
Plarre, K., Raij, A., Hossain, S. M., Ali, A. A., Naka-
jima, M., Al’Absi, M., Ertin, E., Kamarck, T., Kumar,
S., Scott, M., et al. (2011). Continuous inference of
psychological stress from sensory measurements col-
lected in the natural environment. In Proceedings of
the 10th ACM/IEEE international conference on in-
formation processing in sensor networks, pages 97–
108. IEEE.
Pontzer, H. (2015). Energy expenditure in humans and other
primates: a new synthesis. Annual Review of Anthro-
pology, 44:169–187.
Runkle, J. D., Cui, C., Fuhrmann, C., Stevens, S., Del Pinal,
J., and Sugg, M. M. (2019). Evaluation of wearable
sensors for physiologic monitoring of individually ex-
perienced temperatures in outdoor workers in south-
eastern us. Environment international, 129:229–238.
Sarker, H., Tyburski, M., Rahman, M. M., Hovsepian, K.,
Sharmin, M., Epstein, D. H., Preston, K. L., Furr-
Holden, C. D., Milam, A., Nahum-Shani, I., et al.
(2016). Finding significant stress episodes in a dis-
continuous time series of rapidly varying mobile sen-
sor data. In Proceedings of the 2016 CHI conference
on human factors in computing systems, pages 4489–
4501.
Schmidt, P., Reiss, A., Duerichen, R., Marberger, C., and
Van Laerhoven, K. (2018). Introducing wesad, a
multimodal dataset for wearable stress and affect de-
tection. In Proceedings of the 20th ACM interna-
tional conference on multimodal interaction, pages
400–408.
Shaffer, F. and Meehan, Z. M. (2020). A practical
guide to resonance frequency assessment for heart rate
variability biofeedback. Frontiers in neuroscience,
14:1055.
Tavel, M. E. (2021). Hyperventilation syndrome: Why is
it regularly overlooked? The American Journal of
Medicine, 134(1):13–15.
Thompson, E. R. (2007). Development and validation of
an internationally reliable short-form of the positive
and negative affect schedule (panas). Journal of cross-
cultural psychology, 38(2):227–242.
Vitale, E., Galatola, V., and Mea, R. (2021). Observational
study on the potential psychological factors that af-
fected italian nurses involved in the covid-19 health
emergency. Acta Bio Medica: Atenei Parmensis,
92(Suppl 2).
Watson, D. and Clark, L. A. (1999). The panas-x: Manual
for the positive and negative affect schedule-expanded
form.
Wu, F., Wu, T., and Yuce, M. R. (2019). Design and im-
plementation of a wearable sensor network system for
iot-connected safety and health applications. In 2019
IEEE 5th World Forum on Internet of Things (WF-
IoT), pages 87–90. IEEE.
Enhancement of Physiological Stress Classification using Psychometric Features
437
