
PRiDAN: Person Re-identification from Drones with Adaptive Weights
and Expanded Neighbourhood
Chatchanan Varojpipath and Krystian Mikolajczyk
Imperial College London, London, U.K.
Keywords:
Person Re-identification, Visual Surveillance, Drone, Unmanned Aerial Vehicle, Biometrics, Image Retrieval.
Abstract:
There has been a growing interest in drone applications and many computer vision tasks were specifically
adapted to drone scenarios such as SLAM, object detection, depth estimation, etc. Person re-identification is
one of the tasks that can be effectively performed from drones and new datasets specifically geared towards
aerial person imagery emerge. In addition to the common problems found in almost every person re-ID dataset,
the most significant difference to static CCTV re-ID is the very different human pose across views from
the top and similar appearance of different people but also motion blur, light conditions, low resolution and
occlusions. To address these problems, we propose to combine a Part-based Convolutional Baseline (PCB),
which exploits local features, with an adaptive weight distribution strategy, which assigns different weights to
similar and dissimilar samples. The result shows that our method outperforms the state of the arts by a large
margin. In addition, we propose a re-ranking method which aggregates Expanded Cross Neighborhood (ECN)
distance and Jaccard distance to compute the final ranking. Compared to the existing methods, our re-ranking
achieves 3.30% and 3.03% improvement on mAP and rank-1 accuracy, respectively.
1 INTRODUCTION
Person re-identification is in great demand and at-
tracts a lot of attention from both academic and in-
dustrial sectors. It consists of identifying a person
across non-overlapping multi-camera networks (Liu
et al., 2016). Generally, given an image of a person
of interest (query image), the system searches across
gallery images to find the closest matches based on
various similarity measures and then ranks the results
according to those similarity scores.
Recently, intelligent aerial surveillance systems
have been receiving great attention due to the grow-
ing use of drones and their practical applications (Xia
et al., 2018; Zhu et al., 2018). However, many re-
searchers focus either on the task of object detection
(Zhou et al., 2018b; Zhou et al., 2018a) or track-
ing (Xiang et al., 2014) while little attention has
been paid to the task of person re-ID from aerial
views. Furthermore, current datasets for person re-
ID tasks are mostly designed for traditional surveil-
lance systems with fixed locations of cameras. Some
popular datasets under this setting are CUHK03 (Li
et al., 2014), Market-1501 (Zheng et al., 2015), and
DukeMTMC-reID (Ristani et al., 2016).
Recently, a large scale dataset specifically de-
signed towards the task of person re-ID from UAVs
has been introduced (Zhang et al., 2020). This
dataset, PRAI-1581, contains 39461 images from
1581 different person identities, which is comparable
to the ones for fixed CCTV cameras. All images are
taken from 2 different drones at the height of 20-60
meters above the ground, which is significantly higher
than the other benchmarks, and makes the task of
aerial person re-ID much more challenging. In images
taken from very high altitudes, the views of a person
are greatly reduced. Some valuable information such
as their unique facial features, lower body parts, or
overall appearance is partially lost. Consequently, the
difficulties that already exist in traditional person re-
ID datasets are further increased and become harder
to tackle.
We identify two main problems associated with
the aerial person re-ID:
Similar Appearance. Even though the similarity in
appearance is a common issue found in every per-
son re-ID dataset, the fact that aerial images are taken
from different moving drones at height altitudes with
different viewpoint angles and are usually captured in
low resolution due to a long distance from the persons
makes the similar appearance of different IDs even
Varojpipath, C. and Mikolajczyk, K.
PRiDAN: Person Re-identification from Drones with Adaptive Weights and Expanded Neighbourhood.
DOI: 10.5220/0010820000003122
In Proceedings of the 11th International Conference on Pattern Recognition Applications and Methods (ICPRAM 2022), pages 411-422
ISBN: 978-989-758-549-4; ISSN: 2184-4313
Copyright
c
2022 by SCITEPRESS – Science and Technology Publications, Lda. All rights reserved
411
more challenging. Different people start to look sur-
prisingly similar and become very difficult to distin-
guish even when judged by a human eye. The left side
of figure 1 shows an example of images with similar
appearance. Note that the persons at the top row and
bottom row are different IDs. Moreover, as a result of
smaller field of view of person’s body parts, there are
less discriminative feature that can be exploited by a
learning algorithm e.g. shoes. Consequently, a learn-
ing model is less likely to distinguish between these
similar persons.
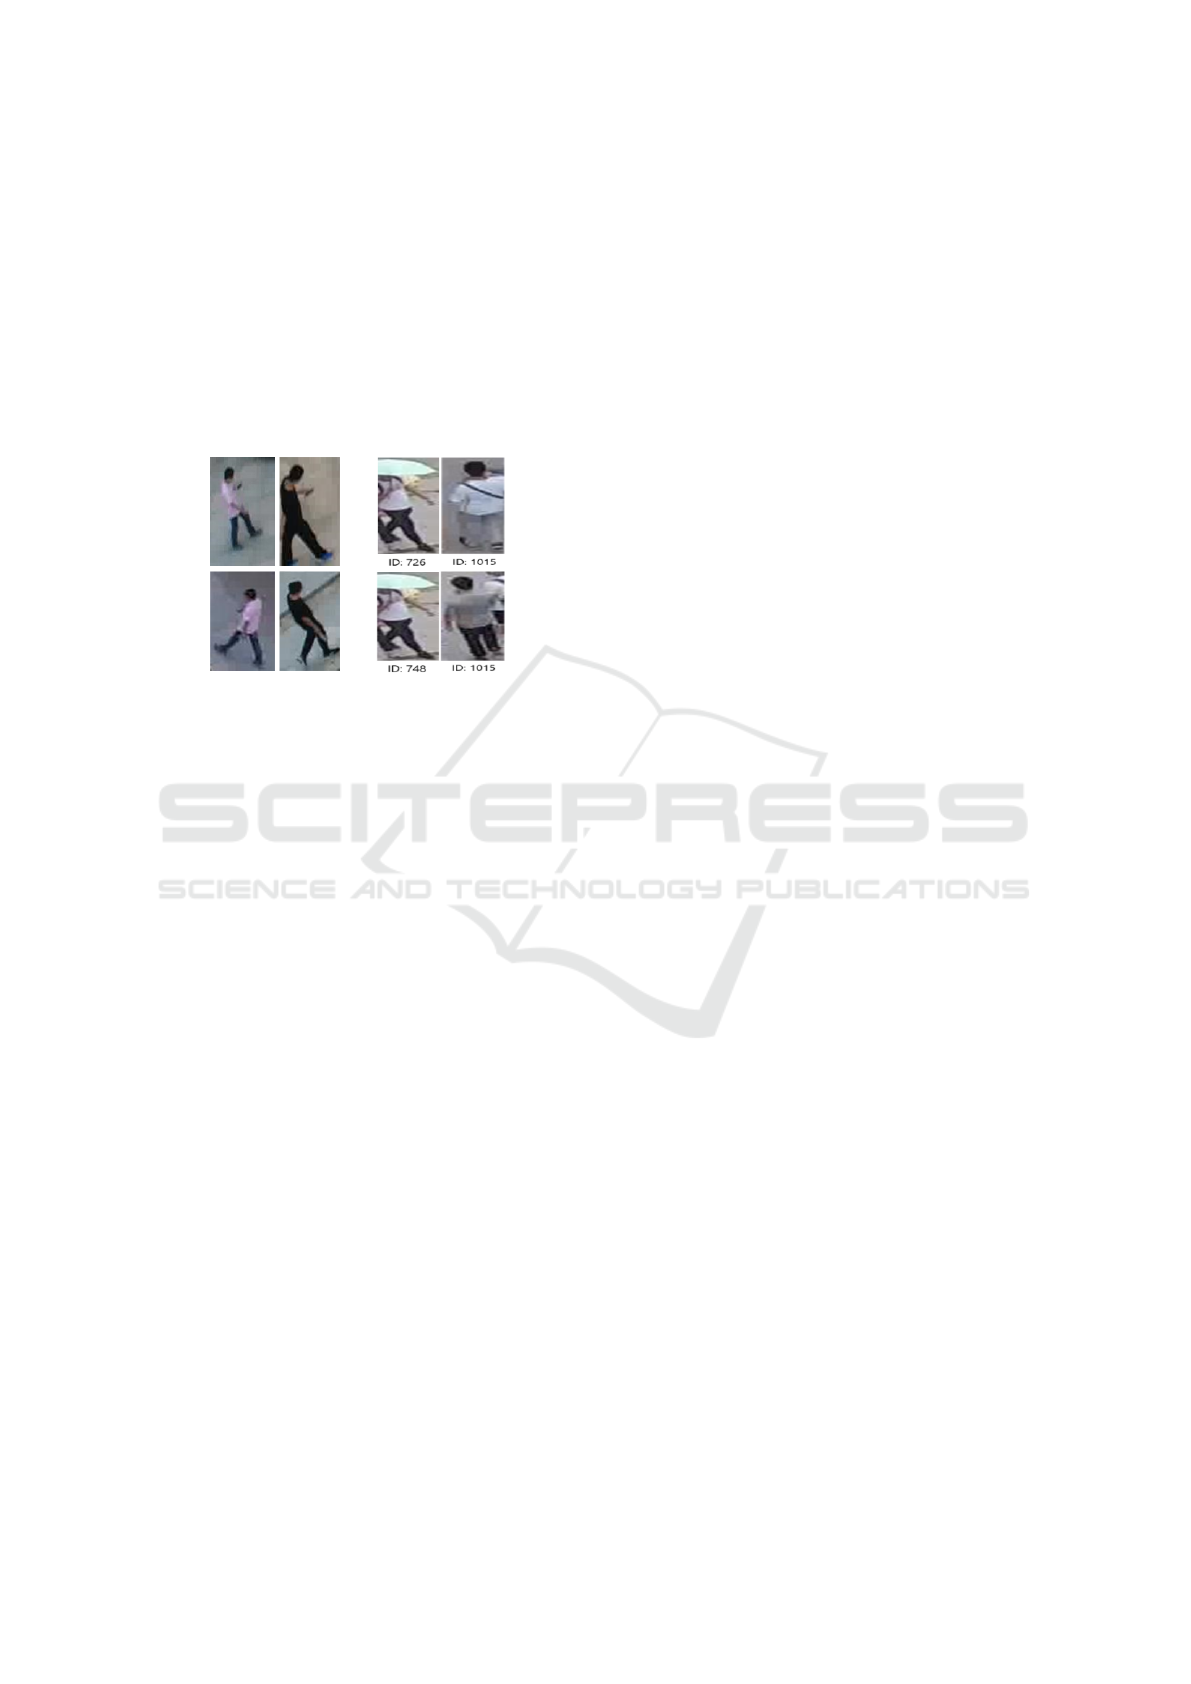
Figure 1: Challenges in UAV person re-ID. Similar appear-
ance for different IDs (left). Outliers (right). The same per-
son with different ID labels (third column). Different per-
sons with the same ID label (fourth column). The images
are from PRAI-1581 dataset.
Outliers. They refer to images that are labelled in-
correctly, which negatively impacts the learning pro-
cess by making a model optimize an invalid objec-
tive, when the same person has different ID annota-
tions or different persons have the same ID annota-
tion (Elgendy, 2020). Due to the problem of similar
appearance, the ground truth of aerial person images
is more likely to include such outliers. The right side
of figure 1 shows examples of outliers in PRAI-1581
dataset. Note that outliers are also general problems
found in other datasets but this label noise is more
frequent in data from aerial views.
We address the above challenges with the follow-
ing contributions:
• Exploiting local features in the learning objective
of the model to address the problem of similar ap-
pearance between a query and gallery images.
• Incorporating the adaptive weight strategy into
triplet selection process in order to mitigate the
negative effect of outliers.
• Introducing cross neighborhood relationship ma-
trix in the re-ranking approach that improves the
performance of ranking results.
• Reporting our and state-of-the-art results in per-
son re-ID from drones on widely used PRAI-1581
benchmark.
2 RELATED WORK
In this section, we provide some background and
summarize previous works pertinent to the method
proposed in this paper.
Loss Functions. There are three commonly used
loss functions in person re-ID literature, namely iden-
tity loss (Zheng et al., 2017b), verification loss (Chen
et al., 2018), and triplet loss (Wang et al., 2018c; Her-
mans et al., 2017). Note that some works use variants
or combinations of these losses (Wang et al., 2018a;
Guo and Cheung, 2018; Zheng et al., 2017a). In the
identity loss, a person re-ID task can be thought of as
an image classification problem where each identity
corresponds to a class. After training, an image re-
trieval can be performed using the last fully connected
layer as the feature extractor. Regarding the verifica-
tion loss, person re-ID can be viewed as a binary clas-
sification where the system indicates whether two im-
ages belong to the same class or not. In this loss, pair-
wise relationship between two images is optimized
using either a contrastive loss (Varior et al., 2016)
or binary verification loss (Ye et al., 2021; Li et al.,
2014). Lastly, in triplet loss, a person re-ID task can
be considered as a retrieval ranking problem. The in-
tuition behind this loss is that distance between posi-
tive pairs (same identity) should be smaller than dis-
tance between negative pairs (different identities) by
a pre-defined margin (Hermans et al., 2017).
Sampling Techniques. A majority of easy triplets
which results in low or zero loss may dominate the
training process and affect the performance of the
model. As a result, several techniques for selecting
informative triplet, also known as mining, have been
extensively studied in the literature. One of the popu-
lar approaches that consist of searching for meaning-
ful samples is hard data mining. It is a sampling tech-
nique that selects a hard positive and a hard negative
sample relative to an anchor. In the context of triplet
loss, a hard negative sample refers to the one that is
similar to the anchor. Similarly, a hard positive is fur-
ther away from the anchor in the embedding space. In
(Hermans et al., 2017) the batch hard (BH) and batch
all (BA) sampling techniques were proposed. In BA,
all valid triplets within a batch are used, which can
potentially lead to averaging out the contributions of
the informative triplets as many valid triplets are triv-
ial. In contrast, BH only considers the hardest sample
relative to an anchor. The advantage of BH is that it
is robust against information averaging out, as trivial
samples are ignored. However, in datasets with noisy
labels i.e., outliers, the problem is that these outliers
ICPRAM 2022 - 11th International Conference on Pattern Recognition Applications and Methods
412

with incorrect labels can be selected as hard samples
(Elgendy, 2020). To address this issue, (Ristani and
Tomasi, 2018) proposed the adaptive weight strategy
which assigns weight to positive and negative sam-
ples based on their distance from a corresponding an-
chor. This technique results in harder samples receiv-
ing more weight than trivial ones but also does not
ignore other easier yet informative samples.
Feature Representation. It plays an important role
in any person re-ID systems and is directly related to
the discriminatory capability of the model. It is a con-
struction of vector representation which captures and
represents an input image (Ye et al., 2021). Those fea-
tures can be extracted globally from the entire image
or locally from different parts of the image.
Global Feature representation is one of the earli-
est form of vector representation in the deep learning
literature. Originally, with the advent of deep learn-
ing based approach in the image classification task
(Simonyan and Zisserman, 2014), global feature was
the main choice of representation which could cap-
ture overall information of an input image. One of
its drawbacks is that it usually fails to capture the lo-
cations of characteristic features in an image, since
only the global representation is used in single cross
entropy loss. However, we argue that global features
are crucial for any re-ID systems to make it robust
and achieve high classification accuracy (Ye et al.,
2021; Zheng et al., 2017b), as it has been validated
in many person re-ID methods. Therefore, we incor-
porate global feature learning into our learning objec-
tive, with the expectation that it further improves the
re-ID performance.
Local Feature representation extracts local region
information within each person. The regions can be
defined by the body parts extracted either by auto-
matic pose estimation or partitioning. As for pose
estimation, one popular approach from (Suh et al.,
2018; Zhao et al., 2017) exploited full body represen-
tation, along with part-level features to construct the
final vector. A widely used solution under this cat-
egory is to utilize pose-driven matching to make fi-
nal vector robust against clutter and occlusion. How-
ever, this method usually suffers from the additional
error introduced by pose estimation (Iodice and Miko-
lajczyk, 2018) and thus has not been included in our
approach. Local features from uniform partitioning
were used in PCB approach (Sun et al., 2018), which
has served as a strong baseline in person re-ID com-
munity. Later works have build on PCB method and
achieved state-of-the-art result (Song et al., 2019; Sun
and Zheng, 2019; Zhong et al., 2019).
Re-ranking Process. It is a crucial step in improv-
ing the accuracy of the initial ranking list during the
inference stage. It re-computes a ranking result by ex-
ploiting gallery-to-gallery similarity (Ye et al., 2021).
Many previous works on re-ranking methods utilize
similarity relationship among top-ranked images in
initial ranking lists (Chum et al., 2007; Qin et al.,
2011; Ye et al., 2015; Ye et al., 2016). In particu-
lar, (Ye et al., 2015) performs similarity pulling and
dissimilarity pushing for bottom ranked results. How-
ever, the performance of re-ranking greatly relies on
the condition of the initial ranking list. Therefore, di-
rectly using the initial ranking usually leads to worse
performance. One popular solution to this problem is
to exploit k-reciprocal nearest neighbor relationship
(Qin et al., 2011; Jegou et al., 2007). In this approach,
image pairs are considered to be k-reciprocal nearest
neighbors if they are both ranked top-k when the other
image is used as a query image (Zhong et al., 2017).
The method proposed in (Zhong et al., 2017) used
an encoding of k-reciprocal nearest neighbors from
which the Jaccard distance can be computed. The fi-
nal distance matrix is then the aggregation of Jaccard
distance and the original Euclidean distance. How-
ever, the original distance is usually not ideal and con-
tains many false matches, which can compromise the
final result. Therefore, we replace this original dis-
tance matrix with another one computed from a re-
ranking technique proposed by (Sarfraz et al., 2018),
where the author exploits the notion of expanded
neighborhood relationship and aggregates cross dis-
tance between any two images.
3 METHOD
In this section, we introduce our proposed method.
We discuss our model architecture, starting from the
backbone network and present other components of
our model.
3.1 Part-based Convolutional Baseline
In PCB, ResNet50 is used as the backbone network.
It consists of a sequence of convolutional layers and
a set of residual blocks. However, the global aver-
age pooling layer (GAP) is removed from the original
ResNet50 model, as GAP can only produce global
feature and prevents us from utilizing the benefit of
part-level/local features. Additionally, the last fully
connected layer (FC) is also removed to accommo-
date for the number of classes in our training set (781
classes) which differs from 1000 classes in ImageNet
PRiDAN: Person Re-identification from Drones with Adaptive Weights and Expanded Neighbourhood
413
dataset (Deng et al., 2009) on which ResNet model is
trained.
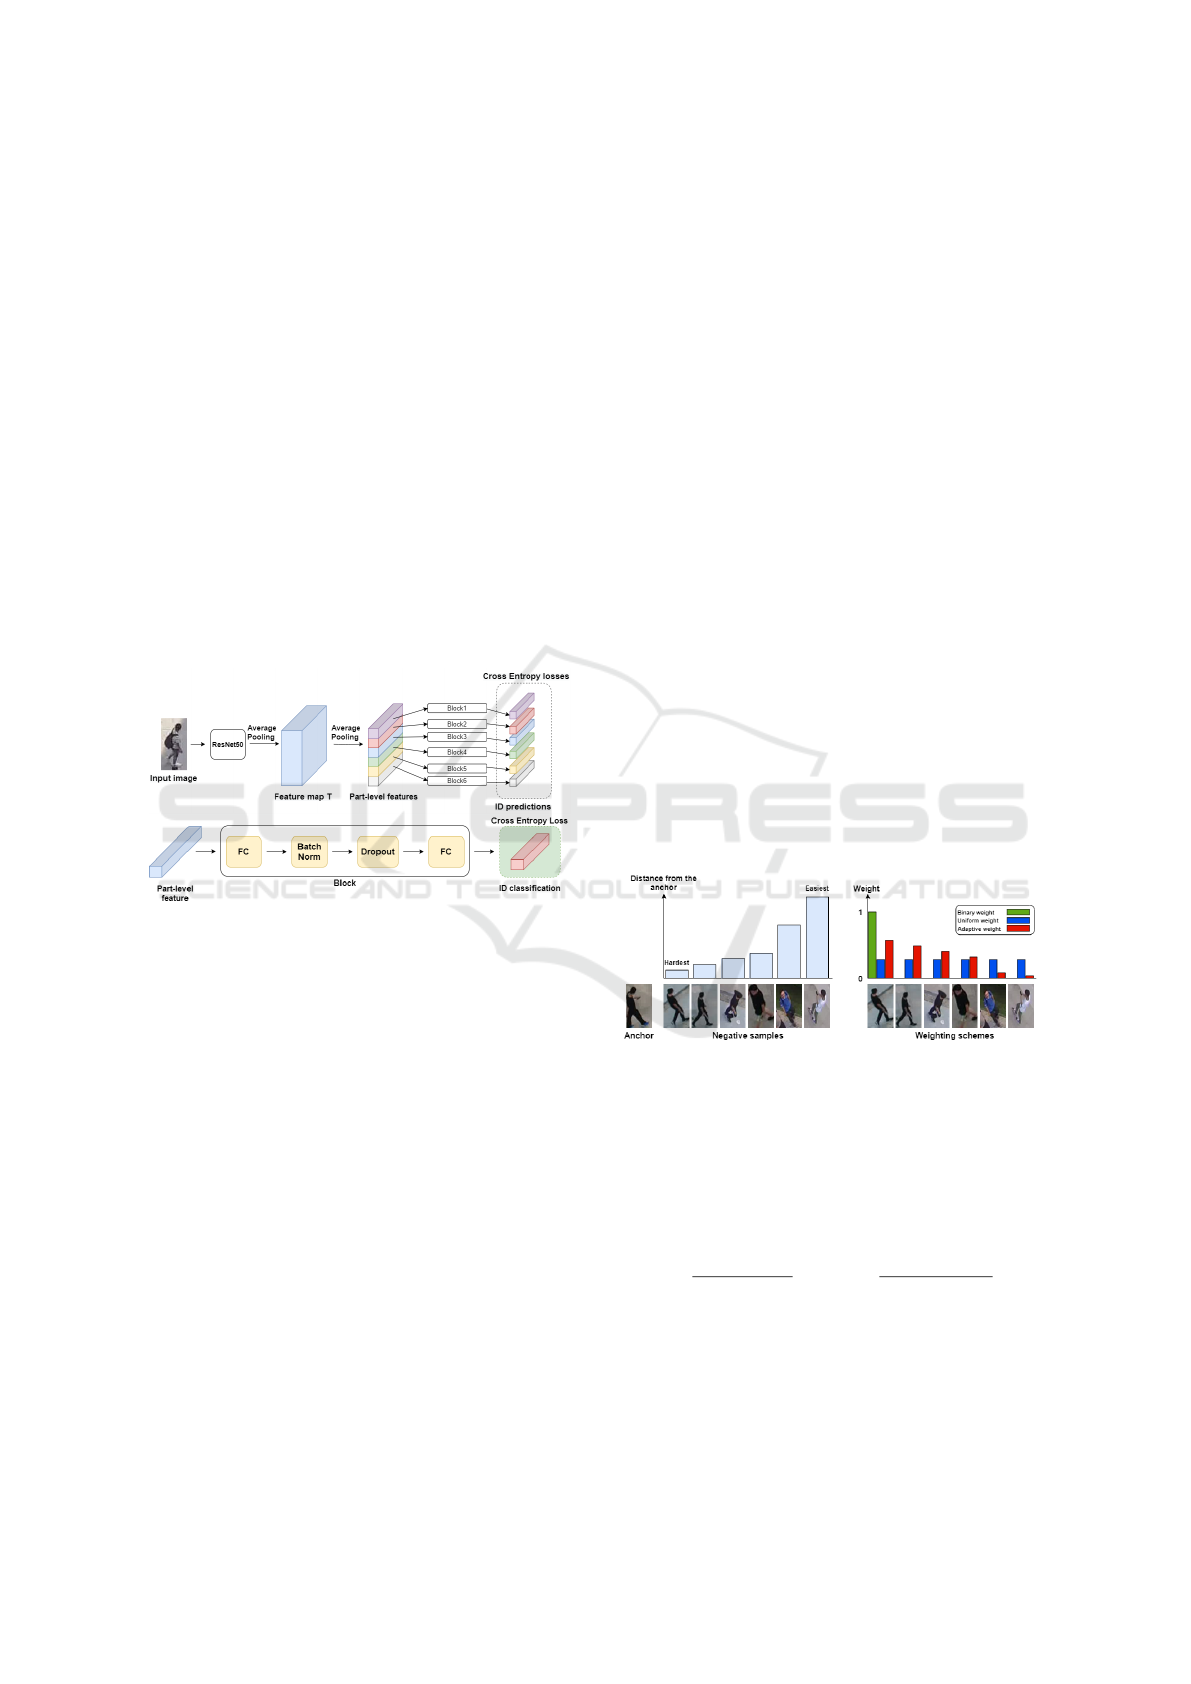
Figure 2(top) illustrates the architecture of PCB
model. Note that we replace the GAP layer in orig-
inal ResNet50 network with the conventional aver-
age pooling layer, as we want to utilize local fea-
tures instead of global ones. An input image is fed
into ResNet50 backbone to output a 3D tensor feature
map T . This is followed by another average pooling
which is applied to this feature map T to reduce its di-
mension to the desired number of part-level features
P. Each of these part-level features is fed into a se-
quence of layers which is called a Block module. The
bottom of figure 2 shows the architecture of the Block
module. Finally, an individual cross entropy loss is
applied to the output of each block module. One can
see that by forcing the model to learn to classify each
part-level feature of an input image, the model can fo-
cus on separate parts of a person, thus incorporating
locally unique information into the learning process.
Figure 2: The architecture of PCB model (top) and compo-
nents of the Block module (bottom).
3.2 Adaptive Weight Strategy
The conventional triplet loss is defined as follows:
L
tri
= [m + d(x
a
, x
p
) − d(x
a
, x
n
)]
+
(1)
where x
a
, x
p
, and x
n
are an anchor, positive, and nega-
tive sample, respectively. m is the pre-defined margin.
d(·) represents the distance between two feature vec-
tors in the embedding space, and [·]
+
= max(0, ·). In
our proposal, we incorporate triplet loss into our train-
ing objective to learn appearance features of a person.
The generalized version of triplet loss is formulated
as follows:
L
tri
=
m +
∑
x
p
∈P(a)
w
p
d(x
a
, x
p
) −
∑
x
n
∈N(a)
w
n
d(x
a
, x
n
)
+
(2)
where, given an anchor x
a
, x
p
∈ P(a) are positive sam-
ples and x
n
∈ N(a) are negative samples. One can
see that as opposed to the conventional triplet loss
defined in equation 1 in which only one positive and
one negative sample are chosen per anchor, equation
2 also considers other samples, which enables the im-
plementation of various weight distributions, includ-
ing the adaptive weight strategy. Batch hard (binary
weighted triplet loss) proposed by (Hermans et al.,
2017; Mishchuk et al., 2017) can be implemented
from equation 2 by simply choosing weight to be 1
for the most difficult positive and negative sample and
0 for the rest of samples within a given batch. Triplet
loss with the binary weight distribution (batch hard)
achieves a better result than triplet loss with a uni-
form weight distribution (batch all), since, in batch
all, the contribution of informative/hard samples will
be dominated by many easy samples, resulting in low
loss.
In our proposed method, our goal is to use another
weighting scheme that achieves as high accuracy as
batch hard but also remains robust against outliers as
in batch all. Figure 3 shows the hardness of negative
samples relative to an anchor and the idea of an adap-
tive weight distribution along with other weighting
schemes. Note that hard negatives are samples which
are closer to an anchor and vice versa for easy neg-
atives. From the figure, while binary weight assigns
full weight to the most difficult sample and uniform
weight gives equal weight to all samples, the adaptive
scheme assigns weight to negative samples based on
their distance from the anchor.
Figure 3: Weighting schemes. Negative examples ranked
by their distance to the anchor (left). Binary weight in the
batch hard approach, uniform weight distribution in simple
triplet loss, and adaptive weight strategy used in our ap-
proach (right).
The distribution of weights in the adaptive weight
scheme follows softmax and softmin distribution de-
fined as follows:
w
p
=
e
d(x
a
,x
p
)
∑
x∈P(a)
e
d(x
a
,x)
, w
n
=
e
−d(x
a
,x
n
)
∑
x∈N(a)
e
−d(x
a
,x)
(3)
3.3 Model Architecture
We combine the components discussed in the previ-
ous section in our final model, as shown in figure 4.
ICPRAM 2022 - 11th International Conference on Pattern Recognition Applications and Methods
414

Figure 4: The final model architecture. During training, the
input image is input into the ResNet50 backbone to form
a feature map T . In the lower branch, the feature map T is
partitioned into P features which are then processed through
different block modules to form local features used in in-
dividual cross entropy losses. In the upper branch, global
average pooling is applied to a feature map T to produce an
intermediate vector also processed by a block module and
used in adaptive weighted triplet loss as well as single cross
entropy loss. During testing, an appearance and P part-level
features are concatenated to form the final feature vector.
During the training phase, a batch of input im-
ages is fed into ResNet50 backbone to produce fea-
ture maps T . A feature map is then directed to the
lower and upper branch. As for the lower branch,
PCB model is used to partition feature map T into
P different part-level features which are then passed
through block modules and used in individual cross
entropy losses. In the upper branch, we apply global
average pooling to the feature map T in order to pro-
duce an intermediate global feature vector that is then
fed into another block module to output appearance
features. Adaptive weighted triplet loss is applied to
this appearance features to optimize an embedding
space. In addition, as noted earlier, we also utilize
global feature for the classification task, as this fea-
ture is crucial for capturing overall representation of a
person image. The final loss function of our proposed
method is defined below:
L
f inal
= L
local
+ L
tri
+ L
global
(4)
where L
local
denotes P cross entropy losses applied to
respective P local features, and L
tri
follows general-
ized triplet loss with the adaptive weight scheme as
defined in equation 2 and 3. Lastly, L
global
denotes
single cross entropy loss applied to the global feature.
During the testing (inference) phase, the appear-
ance feature and P part-level features are extracted
from an input image in the upper and lower branch,
respectively. These features are then concatenated to
produce the final feature vector as shown in figure 4.
Note that weights are only shared in ResNet50
backbone but not in different block modules, as they
are optimized for different objectives. In particular,
each local feature in the lower branch learns to rep-
resent distinct parts of person images. In the upper
branch, appearance features learn to optimize the dis-
tance between positive and negative pairs in the em-
bedding space and global feature learns to represent a
person image as a whole.
3.4 Proposed Re-ranking
After obtaining final feature vectors of person images,
an initial distance between a query image and gallery
images can be computed by calculating Euclidean dis-
tance between the two features vectors. Then, an ini-
tial ranking list can be obtained by sorting this dis-
tance matrix in an increasing order. According to the
method proposed by (Zhong et al., 2017), an encod-
ing of k-reciprocal nearest neighbors is effective in
improving the feature representation, which is subse-
quently used to compute Jaccard distance. The final
distance in their proposal is the aggregation of Jaccard
distance and original Euclidean distance. However, as
we discussed earlier, this original distance relies on an
image pair only and leads to many false matches in a
top-k ranking list due to the problem of similar ap-
pearance. Thus, we replace the original distance with
the one utilizing cross expanded neighborhoods dis-
tance between image pairs (Sarfraz et al., 2018).
Initial Ranking. Given a query image q and a
gallery set with N images G = {g
i
|i = 1, 2, . . . , N}, the
squared Euclidean distance between q and gallery im-
ages g
i
is d(q, g
i
) =
x
q
− x
g
i
2
2
where x
q
and x
g
i
are
feature vectors of a query and gallery images, respec-
tively. After obtaining all pairwise distances, an ini-
tial ranking list L(q, G) = {g
0
1
, g
0
2
, . . . , g
0
N
} is obtained
where d(q, g
0
i
) < d(q, g
0
i+1
).
Expanded Cross Neighborhood (ECN) Distance.
After the initial ranking list L is computed for all im-
ages in a query and gallery set, we define N(q, t) as
t nearest neighbor images of a query q and N(t, m)
as m nearest neighbor images of each candidate in set
N(q, t). Then, the expanded neighborhood of a query
image q is define as N(q, M) such that
N(q, M) ← {N(q, t), N(t, m)} (5)
N(q, t) = {g
0
i
| i = 1, 2, . . . ,t} (6)
N(t, m) = {N(g
0
i
, m), . . . , N(g
0
t
, m)} (7)
The idea of replacing original distance with ECN
distance is not new, as it has been proposed by (Lv
et al., 2020). However, different from (Lv et al.,
2020), where the authors keep decreasing the num-
ber of m nearest neighbors as more candidates in set
PRiDAN: Person Re-identification from Drones with Adaptive Weights and Expanded Neighbourhood
415

N(q, t) are used as a query to find their nearest neigh-
bors, we directly use ECN distance with m nearest
neighbors for all candidates, since it is believed that
the knowledge of cross distance between all pairs of
images should be considered as much as possible to
fully exploit the benefit of the expanded neighbor-
hood set. Similar to N(q, M), we also define N(g
i
, M)
as the expanded neighbors of each gallery image g
i
where M = t +t × m is the total number of expanded
neighbors. Lastly, ECN distance between a query im-
age q and gallery images g
i
is defined as follows:
ECN(q, g
i
) =
1
2M
M
∑
j=1
d(qN
j
, g
i
) + d(g
i
N
j
, q) (8)
where qN
j
is the j
th
closest neighbor in expanded
neighborhood set of a query N(q, M). Similarly, g
i
N
j
is the j
th
closest neighbor in expanded neighborhood
set of gallery images N(g
i
, M). Thus, the ECN dis-
tance between two images is calculated as the distance
between their expanded neighbourhoods.
K-Reciprocal Nearest Neighbors. Given a query
image q, its k-nearest neighbors set T (q, k) is defined
as follows:
T (q, k) = {g
0
1
, g
0
2
, . . . , g
0
k
} (9)
| T (q, k) | = k (10)
where | · | denotes cardinality. Two images are called
k-reciprocal nearest neighbors if they are ranked top-k
when the other image is used as a query. K-reciprocal
nearest neighbors are formulated as follows:
R(q, k) = {g
i
| (g
i
∈ T (q, k))∧(q ∈ T (g
i
, k ))} (11)
Based on equation 11, the k-reciprocal nearest neigh-
bors can represent a query q more accurately than k-
nearest neighbors (Lv et al., 2020). However, some
false matches can still creep into the top-k ranking re-
sult due to the problem of similar appearance.
Expanded K-Reciprocal Nearest Neighbors. To
improve the Jaccard distance with k-reciprocal near-
est neighbors, we expand k-reciprocal nearest neigh-
bors (Zhong et al., 2017). Specifically,
1
2
k-reciprocal
nearest neighbors for each candidate in R(q,k) are
added into R(q, k) to form a final expanded recipro-
cal nearest neighbors set R
∗
(q, k) which is believed
to include more positive images in the top-k ranking
result. It is defined as follows:
R
∗
(q, k) ← R(q, k) ∪ R
q
∗
,
1
2
k
s.t.
R(q, k) ∩ R
q
∗
,
1
2
k
≥
2
3
R
q
∗
,
1
2
k
,
∀q
∗
∈ R(q, k)
(12)
The intuition behind equation 12 is that if two im-
ages are of the same person, members in their ex-
panded k-reciprocal nearest neighbor set should be
similar to each other.
Jaccard Distance. Given the expanded neighbour-
hoods, the distance between a query image and
gallery images can be defined as follows:
d
j
(q, g
i
) = 1 −
|
R
∗
(q, k) ∩ R
∗
(g
i
, k )
|
|
R
∗
(q, k) ∪ R
∗
(g
i
, k )
|
(13)
Final Distance. The distance between two images
that is used for ranking is defined as:
d
f inal
= (λ)ECN(q, g
i
) + (1 − λ)d
j
(q, g
i
) (14)
where λ ∈ [0, 1] controls the balance between ECN
and Jaccard distances.
4 EXPERIMENTAL EVALUATION
We first discuss the experimental settings and present
our results that include a comparison to the state of the
art on person re-ID from aerial views, ablation study
and experiments on re-ID datasets from static CCTV
cameras.
4.1 Experimental Settings
Below we present the datasets, evaluation metrics and
the implementation of our method. Code will be made
available
1
.
PRAI-1581. It consists of 39461 images from 1581
different person identities. The training set contains
19523 images with 781 identities and the testing set
contains 19938 images with 799 identities. In testing
set, 4680 images with 799 identities are used as query
images and 15258 images with the same number of
identities are used as gallery images. All images are
taken from 2 different drones at the height of 20-60
meters above the ground. The fraction of outliers i.e.
incorrect labels in this dataset is approximately 5%.
Market-1501. One of popular person re-ID datasets
from static cameras. It consists of 32668 images of
1501 different identities. 12,936 images with 751
identities are used in training and 19732 images with
750 identities are for testing where 3,368 images are
used as query and the rest is for gallery images. All
images are captured by 6 different cameras at the
height of less than 10 meters.
1
https://github.com/Chatchanan-V/PRiDAN
ICPRAM 2022 - 11th International Conference on Pattern Recognition Applications and Methods
416

DukeMTMC-reID. It is another commonly used
dataset for a standard CCTV setting with 36411 im-
ages of 1404 identities in total, which are captured by
8 different cameras. 16522 images with 702 identities
are used for training and 19889 images with 702 iden-
tities are for testing. The testing set is split into two
parts: 2228 images are for query images and 17661
images are used as gallery images.
Evaluation Metrics. Cumulated Matching Charac-
teristics (CMC) reports the accuracy of a ranking re-
sult. Rank-k accuracy is defined as the percentage of
query images for which their corresponding relevant
gallery images appear in the top-k ranking list. CMC
top-k accuracy for each query is defined as follows:
rank-k =
(
1 if a top-k result contains a true match
0 otherwise
(15)
However, rank-k accuracy does not reflect the overall
accuracy of a ranking result. Another metric that ad-
dresses this issue is mean average precision (mAP),
which measures how high each of the relevant images
is in the ranking list. To calculate mAP, one needs to
compute average precision (AP) for each rank-list and
average it across all queries. AP is defined as follows:
AP =
1
N
N
∑
i=1
i
r
i
(16)
where r
i
is the rank in which i
th
relevant gallery image
appear and N is the total number of relevant gallery
images.
Data Augmentation. The sequence of data trans-
formation applied to input images during training
phase is as follows. Firstly, all images are resized
to dimension 384x192. This is followed by random
horizontal flip with a probability 0.5. Lastly, normal-
ization is applied to each channel of input images us-
ing mean and standard deviation of ImageNet dataset
(Deng et al., 2009) with mean = [0.485, 0.456, 0.406]
and std = [0.229, 0.224, 0.225].
Training Setup. The model is trained for 60 epochs
with a batch size of 64 samples. For each batch,
16 identities are randomly samples with 4 images
per identity. Weights of the ResNet50 model are
pre-trained on ImageNet dataset (Deng et al., 2009).
For the optimizer, we use Stochastic Gradient De-
scent (SGD) with momentum 0.9 and L2 regulariza-
tion 0.0005. Different learning rates are used in our
setting. In particular, the learning rate of layers in the
ResNet50 backbone is set to 0.001, and the learning
rate of 0.01 is used for layers in each block module.
Triplet Selection. Based on generalized triplet loss
defined in equation 2 and the fact that we apply the
adaptive weight scheme in the triplet selection pro-
cess, the number of negatives samples for each anchor
x
a
in triplet loss equation is another hyperparameter
in our setting. We refer to this number as n
neg
, where
n
neg
=
|
N(a)
|
. Similarly, n
pos
denotes the number of
positive samples corresponding to an anchor, where
n
pos
=
|
P(a)
|
. Note that, in our experiments, the num-
ber of positive samples n
pos
is set to 1, as the per-
centage of samples which happen to be outliers within
the same identities (different persons with same ID) is
much lower than outliers of different identities (same
person with different IDs). Thus, the number of in-
correct positive samples in the triplet selection has a
minimal effect on the final result. We give more in-
sight into the effect of the number of negative samples
n
neg
in our ablation study.
4.2 Comparison to State of the Arts
In this section, we compare our result to state-of-
the-art methods on PRAI-1581 dataset. We train our
model with P = 8 parts for PCB and n
neg
= 3 for the
number of negative samples in the adaptive weight
scheme. The rest of the training setup is the same
as the one given in section 4.1. Table 1 provides a
summary of results on PRAI-1581 dataset. From the
table, ID, TL (Hermans et al., 2017), and PCB (Sun
et al., 2018) are all baseline methods, from which the
ideas are incorporated into our model. ID denotes
identification loss and TL denotes batch-hard triplet
loss. PCB applies P individual cross entropy losses to
P respective local features. ResNet50 is used as the
backbone network to form a feature map T for these
three baselines as well as for our method. It can be
seen that our method achieves a dramatic 16.91% im-
provement over ID method on rank-1 and a 12.06%
increase over TL and PCB methods on rank-1. This
result validates our assumption about the benefit of
combining these methods in our model. Furthermore,
it can be seen that our proposed method outperforms
the previous state-of-the-art works on both mAP and
rank-1 metrics by a large margin.
Figure 5 qualitatively shows some failure cases of
our method. These are mainly caused by view angle
(first 2 rows) and occlusion (last 2 rows). Note that
low resolution can be observed in all those cases.
4.3 Ablation Study
In this section we give insights into the performance
of our method depending on the number of parts and
the number of negative samples during training.
PRiDAN: Person Re-identification from Drones with Adaptive Weights and Expanded Neighbourhood
417
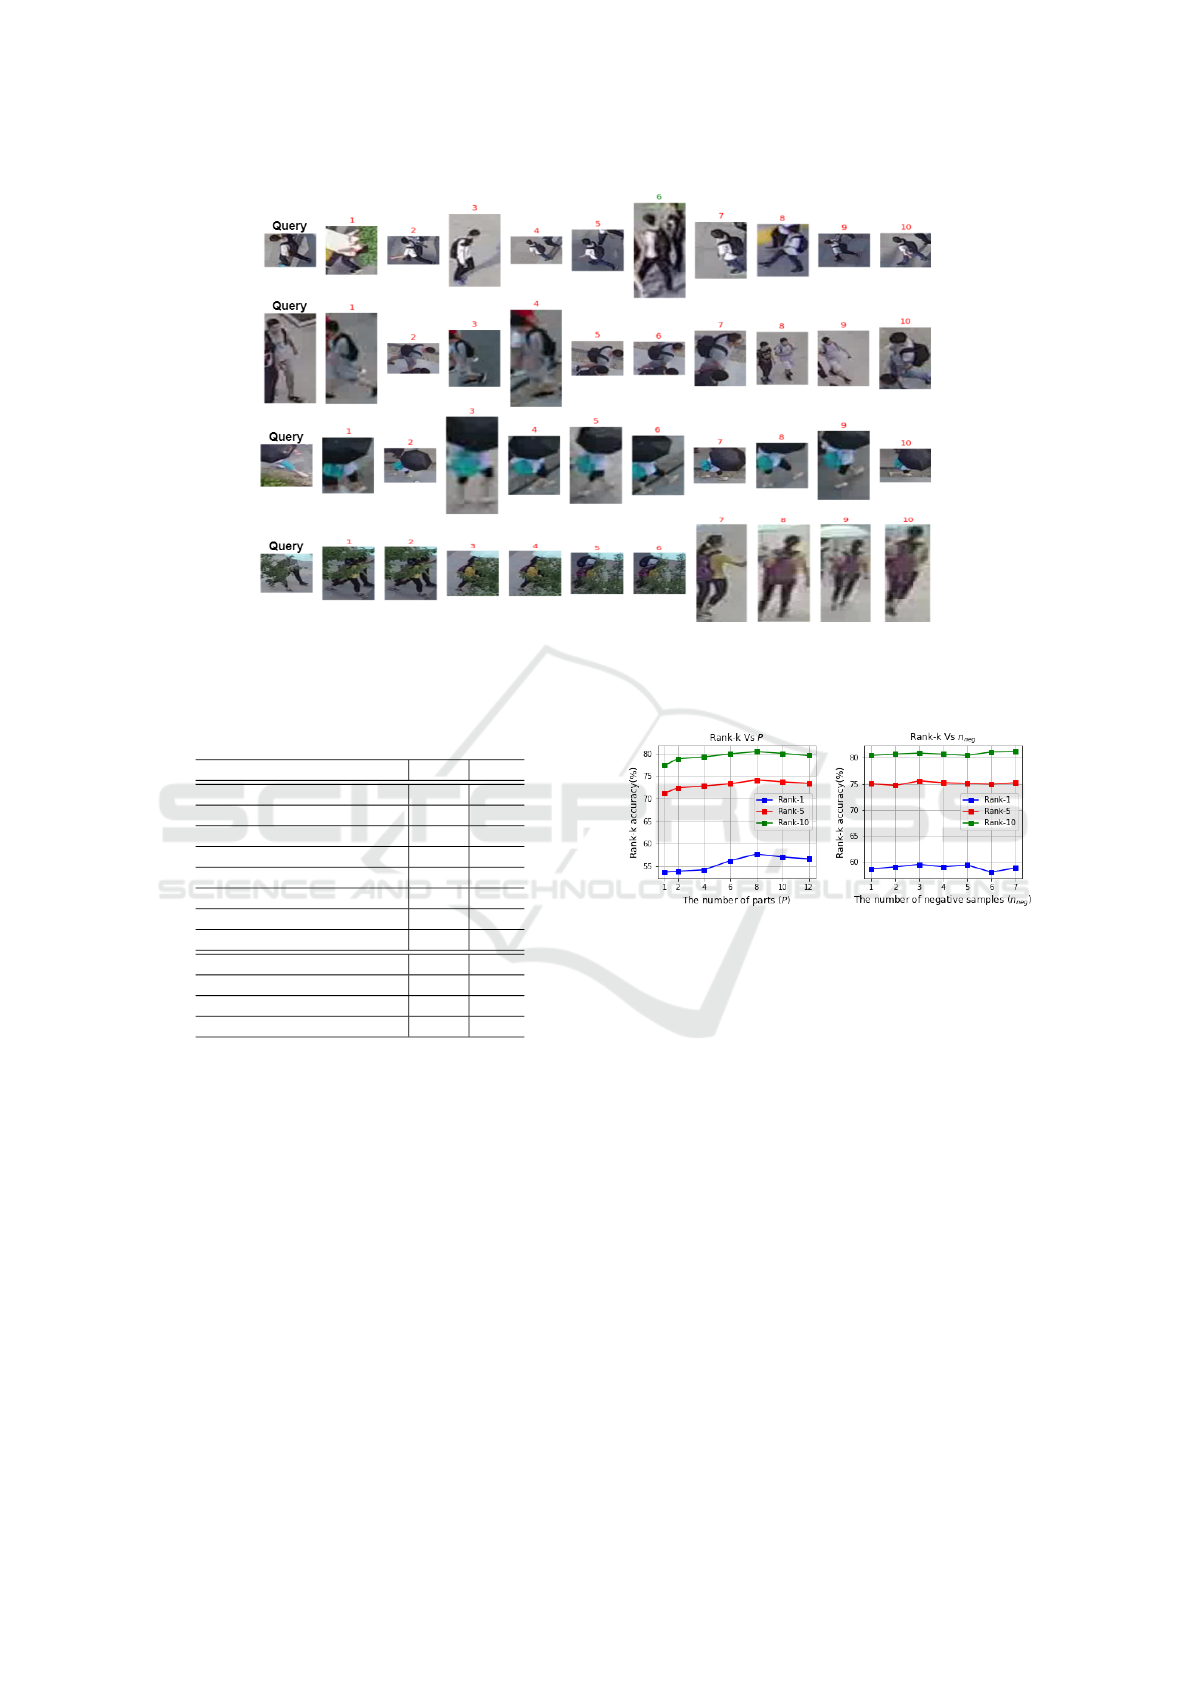
Figure 5: Failure cases of our method. Green and red labels indicate correct and incorrect matches, respectively. The main
challenge are viewing angle (first 2 rows), occlusion (last 2 rows), and low resolution (all rows).
Table 1: Table of results on the PRAI-1581. The results
reported for the state-of-the-art methods are taken from
(Zhang et al., 2020).
Method rank-1 mAP
Part-align (Zhao et al., 2017) 43.14 32.86
IDE (Zhong et al., 2018) 43.90 32.90
SVDNet (Sun et al., 2017) 46.10 36.70
2Stream (Zheng et al., 2017a) 47.79 37.02
AlignedReID (Zhang et al., 2017) 48.54 37.64
MGN (Wang et al., 2018b) 49.64 40.86
DSR (He et al., 2018) 51.09 39.14
OSNET (Zhou et al., 2019) 54.40 42.10
ID 42.62 31.47
TL (Hermans et al., 2017) 47.47 36.49
PCB (Sun et al., 2018) 47.47 37.15
Ours 59.53 45.35
The Number of PCB Parts. Figure 6(left) shows
how rank-1, 5, 10 depend on the number of parts used
in the PCB model. All scores are averages of five rep-
etitions. The accuracy is the lowest when P = 1, as
the learned feature is a global one and the benefit of-
fered by PCB has not been exploited. As the num-
ber of parts increases, rank-k accuracy consistently
increases at first and reaches the highest accuracy at
P = 8. This phenomenon can be explained by the fact
that as more parts of input images are incorporated
into the learning process, the model is given more
meaningful information necessary for discriminating
different persons. However, when P > 8, the accuracy
starts to drop, as each part-level feature will only rep-
resent a very tiny portion of a person image which,
for many images, happen to look similar to each other
and misalignment of parts between images starts to
affect the performance.
Figure 6: Effect of the number of parts on rank-1, 5, and 10
accuracy (left). Effect of the number of negative samples on
rank-1, 5, and 10 accuracy (right).
Effect of Adaptive Weights. Figure 6(right) shows
how the performance depends on the number of nega-
tive samples n
neg
. All rank-k accuracy fluctuates with
the growth of n
neg
. One interesting point from the
figure is that the rank-k accuracy is at its peak when
n
neg
6= 1. This validates the benefit of the adaptive
weight scheme in dealing with the problem of outliers
compared to the binary weights. In particular, when
n
neg
= 3, both rank-1 and rank-5 reach the highest ac-
curacy, and the same goes for rank-10 when n
neg
= 7.
The fluctuation could be attributed to the fact that if
more negative samples are chosen for a corresponding
anchor, the contribution of meaningful samples could
potentially be washed out by some easy, uninforma-
tive samples.
Re-ranking Analysis. We study the effect of pa-
rameters of our re-ranking method on PRAI-1581
dataset, namely k and λ. As explained earlier, k is
ICPRAM 2022 - 11th International Conference on Pattern Recognition Applications and Methods
418
the size of k-reciprocal neighbors set in R
∗
(q, k) as
defined in equation 12, and λ ∈ [0, 1] is the weight
assigned to ECN and Jaccard distance as defined in
equation 14. Moreover, we compare our approach
to a baseline method which is k-reciprocal encoding
(Zhong et al., 2017) on rank-1 accuracy. Finally, we
qualitatively show ranking lists of several methods to
emphasize the advantage of our re-ranking.
The left side of figure 7 illustrates the effect of
the size of k-reciprocal neighbors set k on rank-1 ac-
curacy. Regarding the impact of parameter k on our
re-ranking method (red line), it can be seen that as k
increases, rank-1 improves consistently and reaches
the optimal point when k = 40. This can be attributed
to the fact that there are many sample images per
identity in PRAI-1581 dataset. Therefore, when us-
ing higher k, more positive images will be included in
k-reciprocal set, resulting in full utilization of gallery-
to-gallery relationship and thus better performance.
However, when k > 40, rank-1 accuracy starts de-
creasing due to the fact that more negative images can
potentially creep into the k-reciprocal set and compro-
mise the final performance. Compared to the initial
ranking result without re-ranking (green dashed line),
our re-ranking method achieves a remarkable 9.83%
improvement from 58.70% to 68.53% at k = 40. In
comparison to the baseline method (blue line), our
re-ranking approach consistently outperforms it and
achieves a 1.65% improvement at k = 40.
The right side of figure 7 illustrates the impact of λ
on rank-1 accuracy. Regarding our proposed method
(red line), from the figure, it can be seen that rank-
1 accuracy increases at first and reaches the optimal
point when λ = 0.6. These results confirm that the
best performance can be achieved if both Jaccard and
ECN distance are considered. More importantly, the
fact that the optimal rank-1 accuracy is achieved when
λ is greater than 0.5 also confirms the effectiveness
of using ECN in the final distance. When λ > 0.1,
our re-ranking consistently outperforms the baseline
method. This demonstrates the advantage of our ap-
proach over the baseline where more weight is given
to the original distance.
Figure 7: Effect of the size of k-reciprocal neighbors set k
on rank-1 accuracy (left). Impact of λ on rank-1 accuracy
(right).
Lastly, figure 8 shows an example with three rank-
ing lists: the initial ranking list, k-reciprocal ranking
list, and our result. Note that green colour above the
images indicates true matches, and red colour indi-
cates false matches. From the figure, it can be ob-
served that our method is capable of correcting false
matches in the initial ranking list and also moves
some false matches in k-reciprocal ranking list to
lower ranking positions, resulting in an increase in
rank metrics. This result demonstrates the advantage
of our approach over the baseline method and shows
that the idea of replacing original distance with ECN
distance is beneficial to the final ranking list.
4.4 Performance on Other Datasets
To further demonstrate the effectiveness of our pro-
posed method, we compare our result to the state-
of-the-art methods on two standard person re-ID
datasets: Market-1501 and DukeMTMC-reID. Table
2 shows the summary of mAP and rank-1 results.
Table 2: Results on Market-1501 and DukeMTMC-reID.
Method
Market-1501 DukeMTMC-reID
rank-1 mAP rank-1 mAP
SVDNet (Sun et al., 2017) 82.3 62.1 76.7 56.8
IDE (Zhong et al., 2018) 85.7 65.9 72.3 51.8
FD-GAN (Ge et al., 2018) 90.5 77.7 80.0 64.5
CBN (Zhuang et al., 2020) 91.3 77.3 82.5 67.3
OSNET (Zhou et al., 2019) 94.8 84.9 88.6 73.5
MGN (Wang et al., 2018b) 95.7 86.9 88.7 78.4
ID 88.8 71.6 77.5 60.8
TL (Hermans et al., 2017) 84.9 69.1 72.4 53.5
PCB (Sun et al., 2018) 92.6 77.5 81.8 66.1
Ours 93.0 78.8 86.2 72.5
From the table, it can be seen that our method
outperforms several state-of-the-art works. Moreover,
similar to section 4.2, we also compare our result to
ID, TL, and PCB methods which are used as base-
lines in our proposal. In particular, for Market-1501,
our method achieves an impressive 4.20% and 8.10%
improvement on rank-1 over ID and TL methods,
respectively and outperforms PCB on both Market-
1501 and DukeMTMC-reID datasets. Even though
our results do not surpass the performance of OSNET
(Zhou et al., 2019) and MGN (Wang et al., 2018b)
which fuse multi-scale or multi-granularity global and
part features, it should be noted that our model is
much smaller and less complex compared to them.
PRiDAN: Person Re-identification from Drones with Adaptive Weights and Expanded Neighbourhood
419
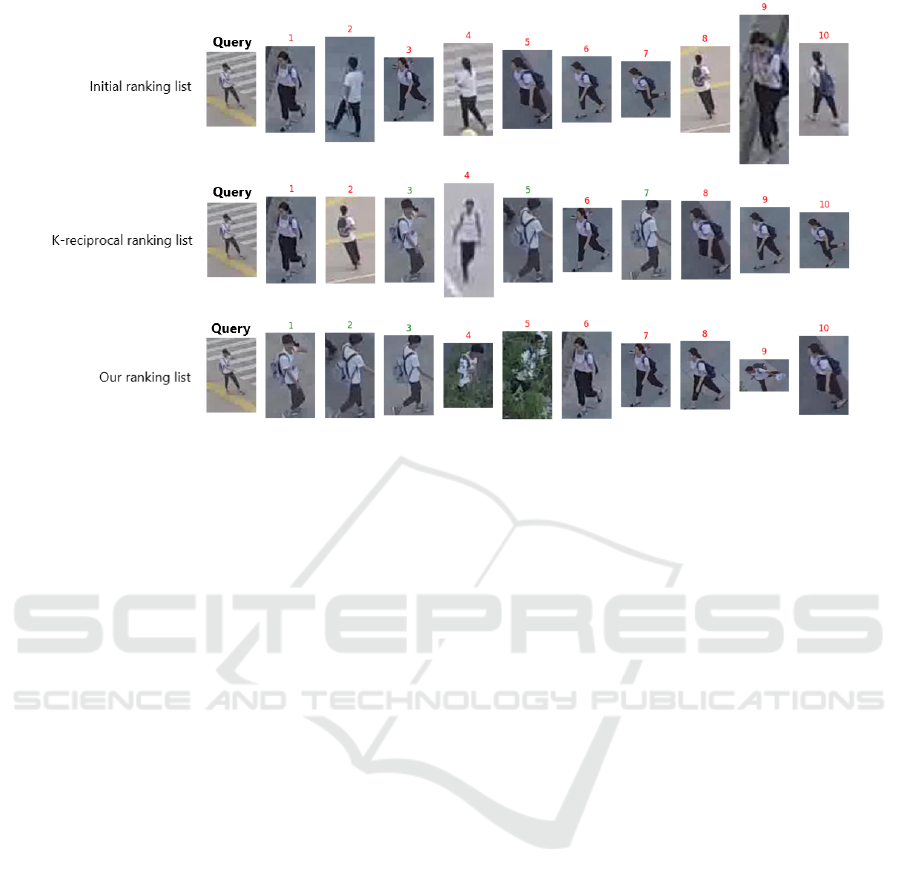
Figure 8: Comparison of the re-ranking methods. Note how our re-ranking method brings to the top the correct matches.
5 CONCLUSIONS
In this paper we extensively study the problem of
large-scale aerial person re-ID. We observe and point
out two main challenges in this task: similar appear-
ance and outliers. Based on these two observations, a
model architecture is designed to specifically address
these problems. In particular, in order to address the
challenge of similar appearance, we adopt PCB model
to learn local features. As for outliers, the adaptive
weight scheme is used to lessen their negative im-
pact on learning process. Lastly, as we observe that
the original ranking distance is not ideal and contains
many false matches due to the problem of similar ap-
pearance, we propose a re-ranking method that ag-
gregates ECN and Jaccard distance. We significantly
outperform the state-of-the-art results on re-ID from
drones dataset PRAI-1581 and obtain competitive re-
sults on standard re-ID benchmarks. We demonstrate
the improvements brought by each of the proposed
components of the system, which validates their con-
tribution to the overall performance.
ACKNOWLEDGEMENT
This project was supported by Chist-Era EP-
SRC IPALM EP/S032398/1 and FACER2VM
EP/N007743/1 grants.
REFERENCES
Chen, D., Xu, D., Li, H., Sebe, N., and Wang, X. (2018).
Group consistent similarity learning via deep crf for
person re-identification. In Proceedings of the IEEE
conference on computer vision and pattern recogni-
tion.
Chum, O., Philbin, J., Sivic, J., Isard, M., and Zisserman, A.
(2007). Total recall: Automatic query expansion with
a generative feature model for object retrieval. In 2007
IEEE 11th International Conference on Computer Vi-
sion.
Deng, J., Dong, W., Socher, R., Li, L.-J., Li, K., and Fei-Fei,
L. (2009). Imagenet: A large-scale hierarchical image
database. In 2009 IEEE conference on computer vi-
sion and pattern recognition.
Elgendy, M. (2020). Deep Learning for Vision Systems.
Manning Publications.
Ge, Y., Li, Z., Zhao, H., Yin, G., Yi, S., Wang, X., and
Li, H. (2018). Fd-gan: Pose-guided feature distilling
gan for robust person re-identification. arXiv preprint
arXiv:1810.02936.
Guo, Y. and Cheung, N.-M. (2018). Efficient and deep per-
son re-identification using multi-level similarity. In
Proceedings of the IEEE Conference on Computer Vi-
sion and Pattern Recognition.
He, L., Liang, J., Li, H., and Sun, Z. (2018). Deep
spatial feature reconstruction for partial person re-
identification: Alignment-free approach. In Proceed-
ings of the IEEE Conference on Computer Vision and
Pattern Recognition.
Hermans, A., Beyer, L., and Leibe, B. (2017). In defense
of the triplet loss for person re-identification. arXiv
preprint arXiv:1703.07737.
Iodice, S. and Mikolajczyk, K. (2018). Partial person re-
ICPRAM 2022 - 11th International Conference on Pattern Recognition Applications and Methods
420

identification with alignment and hallucination. In
Asian Conference on Computer Vision. Springer.
Jegou, H., Harzallah, H., and Schmid, C. (2007). A con-
textual dissimilarity measure for accurate and efficient
image search. In 2007 IEEE Conference on Computer
Vision and Pattern Recognition.
Li, W., Zhao, R., Xiao, T., and Wang, X. (2014). Deep-
reid: Deep filter pairing neural network for person re-
identification. In Proceedings of the IEEE conference
on computer vision and pattern recognition.
Liu, J., Zha, Z.-J., Tian, Q., Liu, D., Yao, T., Ling, Q., and
Mei, T. (2016). Multi-scale triplet cnn for person re-
identification. In Proceedings of the 24th ACM inter-
national conference on Multimedia.
Lv, J., Li, Z., Nai, K., Chen, Y., and Yuan, J. (2020).
Person re-identification with expanded neighborhoods
distance re-ranking. Image and Vision Computing.
Mishchuk, A., Mishkin, D., Radenovic, F., and Matas, J.
(2017). Working hard to know your neighbor’s mar-
gins: Local descriptor learning loss. arXiv preprint
arXiv:1705.10872.
Qin, D., Gammeter, S., Bossard, L., Quack, T., and
Van Gool, L. (2011). Hello neighbor: Accurate ob-
ject retrieval with k-reciprocal nearest neighbors. In
CVPR 2011.
Ristani, E., Solera, F., Zou, R., Cucchiara, R., and Tomasi,
C. (2016). Performance measures and a data set for
multi-target, multi-camera tracking. In European con-
ference on computer vision. Springer.
Ristani, E. and Tomasi, C. (2018). Features for multi-target
multi-camera tracking and re-identification. In Pro-
ceedings of the IEEE conference on computer vision
and pattern recognition.
Sarfraz, M. S., Schumann, A., Eberle, A., and Stiefelhagen,
R. (2018). A pose-sensitive embedding for person re-
identification with expanded cross neighborhood re-
ranking. In Proceedings of the IEEE Conference on
Computer Vision and Pattern Recognition.
Simonyan, K. and Zisserman, A. (2014). Very deep con-
volutional networks for large-scale image recognition.
arXiv preprint arXiv:1409.1556.
Song, J., Yang, Y., Song, Y.-Z., Xiang, T., and Hospedales,
T. M. (2019). Generalizable person re-identification
by domain-invariant mapping network. In Proceed-
ings of the IEEE/CVF Conference on Computer Vision
and Pattern Recognition.
Suh, Y., Wang, J., Tang, S., Mei, T., and Lee, K. M.
(2018). Part-aligned bilinear representations for per-
son re-identification. In Proceedings of the European
Conference on Computer Vision.
Sun, X. and Zheng, L. (2019). Dissecting person re-
identification from the viewpoint of viewpoint. In Pro-
ceedings of the IEEE/CVF Conference on Computer
Vision and Pattern Recognition.
Sun, Y., Zheng, L., Deng, W., and Wang, S. (2017). Svdnet
for pedestrian retrieval. In Proceedings of the IEEE
international conference on computer vision.
Sun, Y., Zheng, L., Yang, Y., Tian, Q., and Wang, S. (2018).
Beyond part models: Person retrieval with refined part
pooling (and a strong convolutional baseline). In Pro-
ceedings of the European conference on computer vi-
sion (ECCV).
Varior, R. R., Shuai, B., Lu, J., Xu, D., and Wang, G. (2016).
A siamese long short-term memory architecture for
human re-identification. In European conference on
computer vision. Springer.
Wang, C., Zhang, Q., Huang, C., Liu, W., and Wang, X.
(2018a). Mancs: A multi-task attentional network
with curriculum sampling for person re-identification.
In Proceedings of the European Conference on Com-
puter Vision (ECCV).
Wang, G., Yuan, Y., Chen, X., Li, J., and Zhou, X. (2018b).
Learning discriminative features with multiple granu-
larities for person re-identification. In Proceedings of
the 26th ACM international conference on Multime-
dia.
Wang, Y., Wang, L., You, Y., Zou, X., Chen, V., Li, S.,
Huang, G., Hariharan, B., and Weinberger, K. Q.
(2018c). Resource aware person re-identification
across multiple resolutions. In Proceedings of the
IEEE Conference on Computer Vision and Pattern
Recognition.
Xia, G.-S., Bai, X., Ding, J., Zhu, Z., Belongie, S., Luo, J.,
Datcu, M., Pelillo, M., and Zhang, L. (2018). Dota:
A large-scale dataset for object detection in aerial im-
ages. In Proceedings of the IEEE conference on com-
puter vision and pattern recognition.
Xiang, Y., Song, C., Mottaghi, R., and Savarese, S. (2014).
Monocular multiview object tracking with 3d aspect
parts. In European Conference on Computer Vision.
Springer.
Ye, M., Liang, C., Wang, Z., Leng, Q., and Chen, J. (2015).
Ranking optimization for person re-identification via
similarity and dissimilarity. In Proceedings of the 23rd
ACM international conference on Multimedia.
Ye, M., Liang, C., Yu, Y., Wang, Z., Leng, Q., Xiao, C.,
Chen, J., and Hu, R. (2016). Person reidentification
via ranking aggregation of similarity pulling and dis-
similarity pushing. IEEE Transactions on Multimedia.
Ye, M., Shen, J., Lin, G., Xiang, T., Shao, L., and Hoi, S. C.
(2021). Deep learning for person re-identification: A
survey and outlook. IEEE Transactions on Pattern
Analysis and Machine Intelligence.
Zhang, S., Zhang, Q., Yang, Y., Wei, X., Wang, P., Jiao,
B., and Zhang, Y. (2020). Person re-identification in
aerial imagery. IEEE Transactions on Multimedia.
Zhang, X., Luo, H., Fan, X., Xiang, W., Sun, Y., Xiao,
Q., Jiang, W., Zhang, C., and Sun, J. (2017). Aligne-
dreid: Surpassing human-level performance in person
re-identification. arXiv preprint arXiv:1711.08184.
Zhao, L., Li, X., Zhuang, Y., and Wang, J. (2017). Deeply-
learned part-aligned representations for person re-
identification. In Proceedings of the IEEE interna-
tional conference on computer vision.
Zheng, L., Shen, L., Tian, L., Wang, S., Wang, J., and Tian,
Q. (2015). Scalable person re-identification: A bench-
mark. In Proceedings of the IEEE international con-
ference on computer vision.
PRiDAN: Person Re-identification from Drones with Adaptive Weights and Expanded Neighbourhood
421

Zheng, Z., Zheng, L., and Yang, Y. (2017a). A discrimi-
natively learned cnn embedding for person reidentifi-
cation. ACM Transactions on Multimedia Computing,
Communications, and Applications (TOMM).
Zheng, Z., Zheng, L., and Yang, Y. (2017b). Unlabeled
samples generated by gan improve the person re-
identification baseline in vitro. In Proceedings of the
IEEE International Conference on Computer Vision.
Zhong, Z., Zheng, L., Cao, D., and Li, S. (2017). Re-
ranking person re-identification with k-reciprocal en-
coding. In Proceedings of the IEEE conference on
computer vision and pattern recognition.
Zhong, Z., Zheng, L., Luo, Z., Li, S., and Yang, Y. (2019).
Invariance matters: Exemplar memory for domain
adaptive person re-identification. In Proceedings of
the IEEE/CVF Conference on Computer Vision and
Pattern Recognition.
Zhong, Z., Zheng, L., Zheng, Z., Li, S., and Yang,
Y. (2018). Camera style adaptation for person re-
identification. In Proceedings of the IEEE conference
on computer vision and pattern recognition.
Zhou, K., Yang, Y., Cavallaro, A., and Xiang, T.
(2019). Omni-scale feature learning for person re-
identification. In Proceedings of the IEEE/CVF In-
ternational Conference on Computer Vision.
Zhou, P., Han, X., Morariu, V. I., and Davis, L. S. (2018a).
Learning rich features for image manipulation detec-
tion. In Proceedings of the IEEE Conference on Com-
puter Vision and Pattern Recognition.
Zhou, P., Ni, B., Geng, C., Hu, J., and Xu, Y. (2018b).
Scale-transferrable object detection. In proceedings of
the IEEE conference on computer vision and pattern
recognition.
Zhu, P., Wen, L., Bian, X., Ling, H., and Hu, Q. (2018).
Vision meets drones: A challenge. arXiv preprint
arXiv:1804.07437.
Zhuang, Z., Wei, L., Xie, L., Zhang, T., Zhang, H., Wu,
H., Ai, H., and Tian, Q. (2020). Rethinking the dis-
tribution gap of person re-identification with camera-
based batch normalization. In European Conference
on Computer Vision. Springer.
ICPRAM 2022 - 11th International Conference on Pattern Recognition Applications and Methods
422
