Cervical Spine Range of Motion Measurement Utilizing Image Analysis
Kana Matsuo
1 a
, Koji Fujita
2 b
, Takafumi Koyama
3 c
, Shingo Morishita
3 d
and Yuta Sugiura
1 e
1
Department of Information and Computer Science, Keio University, Kanagawa, Japan
2
Department of Functional Joint Anatomy, Tokyo Medical and Dental University, Tokyo, Japan
3
Department of Orthopedic and Spinal Surgery, Tokyo Medical and Dental University, Tokyo, Japan
Keywords:
Measurement System, Deep Learning, Cervical Spine, Range of Motion.
Abstract:
Diseases of the cervical spine often cause more serious impediments to daily activities than diseases of other
parts of the body, and thus require prompt and accurate diagnosis. One of the indicators used for diagnosing
cervical spine diseases is measurements of the range of motion (RoM) angle. However, the main measure-
ment method is manual, which creates a burden on physicians. In this work, we investigate the possibility of
measuring the RoM angle of the cervical spine from cervical X-ray images by using Mask R-CNN and image
processing. The results of measuring the RoM angle with the proposed cervical spine motion angle measure-
ment system showed that the mean error from the true value was 3.5 degrees and the standard deviation was
2.8 degrees. Moreover, the standard deviation of the specialist measurements used for comparison was 2.9
degrees, while that of the proposed system was just 0 degrees, indicating that there was no variation in the
measurements of the proposed system.
1 INTRODUCTION
In the medical field, many diagnostic imaging tests
(e.g., those on X-ray images) are performed, but it is
inconvenient for physicians to examine a large num-
ber of images and it takes away from the time they
could be spending on medical treatment. In addi-
tion, at night, when only a small number of physicians
are on duty, they may be asked to perform diagnostic
imaging in areas in which they do not specialize. For
this reason, there has been extensive research in recent
years on automatic image diagnosis using artificial in-
telligence (AI).
The cervical spine is one of the areas on which
many imaging studies have been focused, especially
in orthopedics. When the degeneration of the cervical
spine progresses due to aging, it causes cervical pain
as well as neurological diseases such as myelopa-
thy and radiculopathy. When myelopathy worsens, it
causes dyskinesia of the fingers and gait, resulting in
serious obstacle in daily life, so a prompt and accurate
diagnosis is required.
a
https://orcid.org/0000-0001-9753-2983
b
https://orcid.org/0000-0003-3733-0188
c
https://orcid.org/0000-0002-1676-7578
d
https://orcid.org/0000-0002-5993-2297
e
https://orcid.org/0000-0003-3735-4809
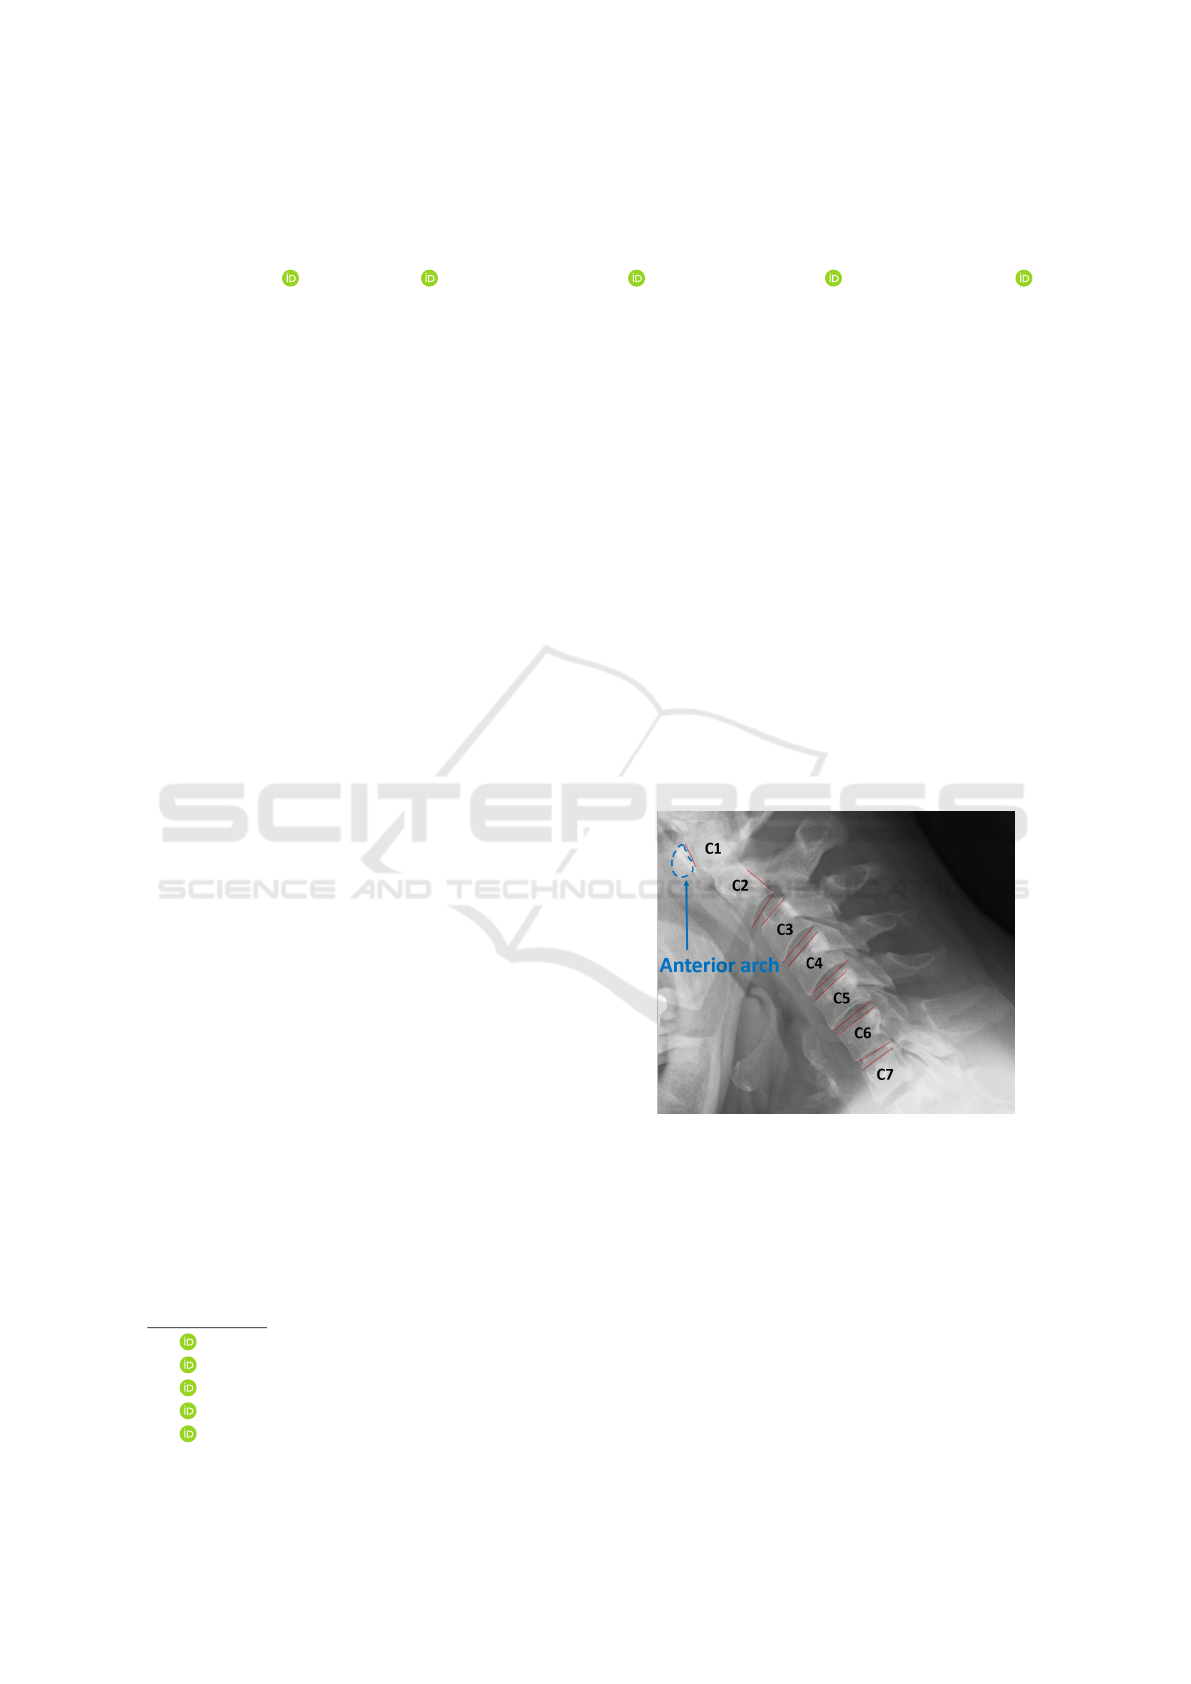
Figure 1: Example of annotation for measurement.
When the neck is moved, movement occurs in
each of the C1–C7 vertebra (Figure 1). In specific
regard to flexion and extension, cervical instability
may be assessed by analyzing the mobility between
vertebrae from cervical X-ray images. For this eval-
uation, it is necessary to measure each range of mo-
tion (RoM) angle between C1 and C7. In the Bakke
method, which is one of the measurements performed
by the physician, X-ray images are taken when the
cervical region is flexed and extended, and lines are
drawn at the upper and lower edges between each
vertebra. The next step is to find the angle between
Matsuo, K., Fujita, K., Koyama, T., Morishita, S. and Sugiura, Y.
Cervical Spine Range of Motion Measurement Utilizing Image Analysis.
DOI: 10.5220/0010819400003124
In Proceedings of the 17th International Joint Conference on Computer Vision, Imaging and Computer Graphics Theory and Applications (VISIGRAPP 2022) - Volume 4: VISAPP, pages
861-867
ISBN: 978-989-758-555-5; ISSN: 2184-4321
Copyright
c
2022 by SCITEPRESS – Science and Technology Publications, Lda. All rights reserved
861

these lines and take the difference between the angle
for flexion and the angle for extension. Due to the
special shape of C1 and C2, a line is drawn on the
posterior margin of the anterior arch for C1 and on
the posterior margin of the vertebral body for C2, and
the angle between these lines is determined (Figure
1). In this method, a total of 24 lines are drawn on the
cervical spine images of flexion and extension, which
creates a significant burden for the physician who has
to check them. Moreover, the C1 and C2 vertebra are
particularly difficult to measure accurately because of
their special shape. In this study, we aim to support
physicians in measuring the RoM angles by imple-
menting a system that automates the measurement of
RoM angles from cervical spine X-ray images.
2 RELATED WORK
2.1 Medical Image Segmentation
Segmentation using image processing has been stud-
ied. Huaifei et al. proposed a method using image
processing to extract a rough cervical spine region by
contrast histogram and then estimate the region by us-
ing curve fitting (Huaifei et al., 2011). In addition,
Lecron et al. proposed a method to detect the corners
of each cervical spine section by using edge detec-
tion and Hough transform for segmentation (Lecron
et al., 2010). Segmentation using such image process-
ing techniques requires a large number of parameters
to be set and threshold values to be determined, which
makes the implementation more complex. Moreover,
in order to avoid the influence of the head when fo-
cusing on the histogram, it is necessary to crop only
the cervical region from the original X-ray image.
Recently, segmentation methods based on deep
learning have been proposed. Architectures used
for such segmentation include Fully Convolutional
Networks (FCN) (Long et al., 2015), U-Net (Ron-
neberger et al., 2015), and Mask R-CNN (He et al.,
2017). Arif et al. proposed an FCN-based Convolu-
tional Neural Network (CNN) called SPNet for cervi-
cal spine segmentation (Arif et al., 2018) that, com-
pared with existing methods such as U-Net, can ro-
bustly detect the cervical region even in images con-
taminated with foreign matter.Masuzawa et al. pro-
posed a method for automatic segmentation, localiza-
tion, and identification of vertebrae in arbirary 3D CT
images. They developed a network for instance seg-
mentation of cervical, thoracic, and lumbar vertebrae
from 3D CT images(Masuzawa et al., 2020). Uozumi
et al. used Mask R-CNN to extract lung regions from
chest X-ray images with high accuracy (Uozumi et al.,
2020) and found that, while U-Net is more accurate in
terms of extraction accuracy, Mask R-CNN is more
robust to the diversity caused by changes in the shad-
ing of X-ray images and changes in the position of the
lungs due to disease. Mask R-CNN has the advantage
of being able to process each cervical spine section
separately since, unlike other networks specialized for
segmentation, it performs instance segmentation. In
the present work, we extract the cervical spine region
from the cervical spine X-ray image by using Mask
R-CNN. The contribution of our research is that we
did a segmentation of the cervical spine and then mea-
sured the RoM of the cervical spine and evaluated the
accuracy of the measurement with the physician.
2.2 Computer Aided Diagnosis for
Cervical Spine
Various research is being conducted to analyze and
diagnose medical images using segmentation tech-
niques, image processing, and deep learning to as-
sist physicians in diagnosis. Choi et al. developed a
system to estimate the spinal column alignment from
moir
´
e images by training a set of moir
´
e images and
lumbar spine X-ray images using CNN and then mea-
suring the Cobb angle, which represents the degree of
the curve of the spine (Choi et al., 2017). The aver-
age error from the true value in their system was 3.8
degrees, which is equivalent to the accuracy of mea-
surement by a physician. Alomari et al. developed a
system to segment lumbar discs by using image inten-
sity and gradient vector flux and to detect disc abnor-
malities by measuring the disc height (Alomari et al.,
2011). Young et al. used deep learning and image
processing to measure the thickness of the preverte-
bral soft tissue in front of the vertebral body from cer-
vical spine X-ray images, and proposed a method to
diagnose swelling by referring to the flow of swelling
diagnosis by physicians (Young et al., 2018).
In the present study, we measure the RoM an-
gle between sections of the cervical spine by using a
system implemented with reference to the diagnostic
flow of a physician. By measuring this RoM, the fea-
tures of the cervical vertebrae are detected and used to
help the physician make a diagnosis. The computer-
based measurement is expected to have the advantage
of eliminating the variation in measurement among
physicians.
VISAPP 2022 - 17th International Conference on Computer Vision Theory and Applications
862
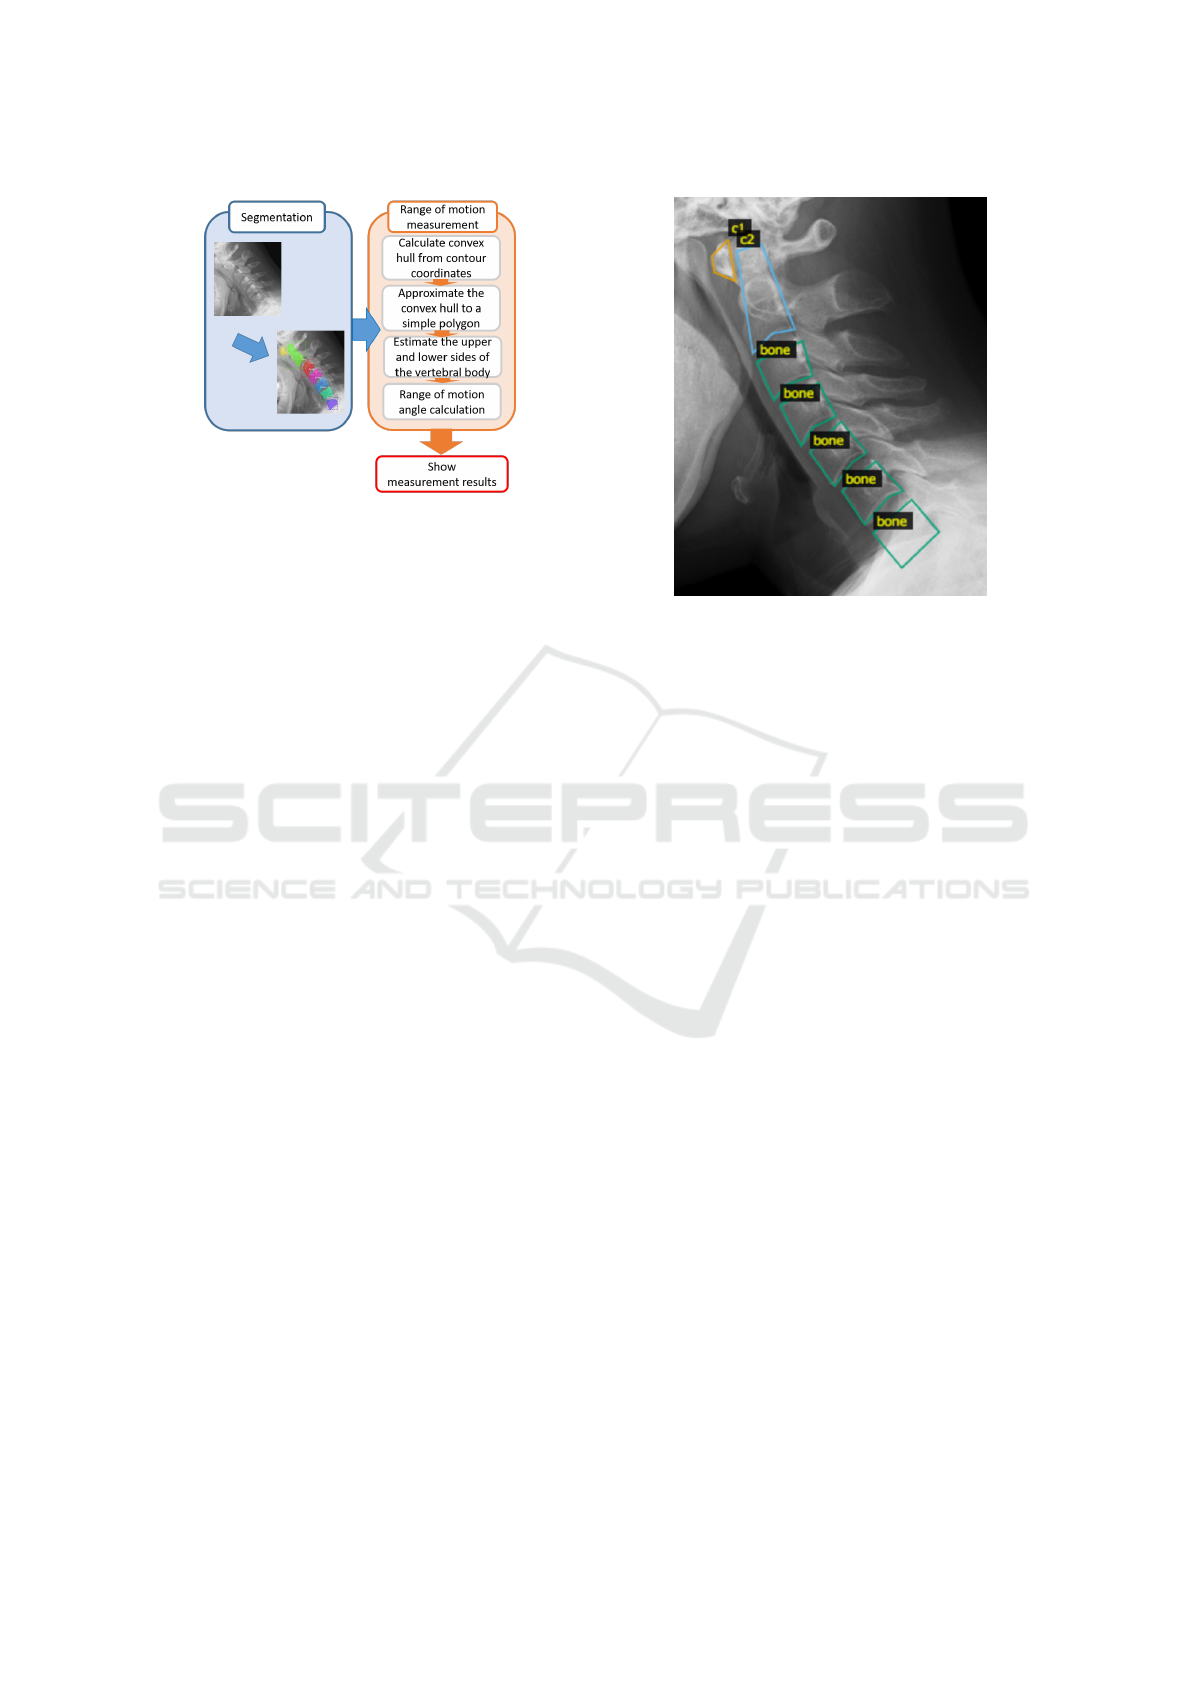
Figure 2: System flow.
3 METHOD
3.1 Overview of System
The flow of the system proposed in this study is
shown in Figure 2. First, the cervical spine region is
estimated from the cervical spine X-ray image using
Mask R-CNN. The estimated region is approximated
by a simple polygon with three or four vertices. The
edges of the polygons of cervical spine n and cervi-
cal spine n+1, which are close to the center of each
other, are the edges that lie between the cervical spine
vertebrae. The RoM angle is calculated by measuring
the angle between the cervical spine in the flexion im-
age and the extension image, and then calculating the
difference.
3.2 Estimation of Cervical Spine Region
The training data are X-ray images of the cervical
spine when it is flexed and extended. Based on the
guidance of a radiologist specializing in the cervical
spine, cervical spine mask information is created, and
the pair with the original image is used as training
data. The cervical spine regions to be masked are dif-
ferent for C3 to C7 and for C1 and C2 because of the
special shape of the latter. Specifically, the C1 region
is the anterior arch, and the C2 region includes the en-
tire vertebrae from the vertebral body to the odontoid
process. The regions are labeled as c1, c2, and bone
(Figure 3).
3.3 RoM Angle Measurement from
Estimated Cervical Region
The bounding box coordinates and area information
of the regions estimated by Mask R-CNN are stored
Figure 3: Annotation area.
in an array, but they are not arranged in the order
of C1 to C7. Therefore, it is necessary to shift the
cervical spine positions of the estimated regions in
both images so that they correspond. To prepare for
the measurement, the y-coordinates of the bounding
box should be in ascending order, and the estimated
regions should be rearranged in the order of C1 to
C7. However, it is sometimes not possible to esti-
mate some of the cervical regions in the image. In
such cases, we take the difference between the y-
coordinates of the upper left and lower right of the
rectangle of cervical spine n and cervical spine n+1,
and consider it continuous if it is less than half of the
height of the bounding box of cervical spine n. If this
condition is not met, it is judged that there is a mis-
estimated region or a cervical region that cannot be
estimated. The flow of the automatic annotation is
shown in Figure 4. First, the contour coordinates of
the region are obtained from the estimated cervical re-
gion (Figure 4(a)). The coordinates of the convex hull
are selected from the contour coordinates and then the
convex hull region is approximated as a polygon with
three or four vertices (Figure 4(b), (c)). After this, the
midpoint of each edge of the approximated polygon is
calculated. The edge where the calculated midpoints
are close to each other (between cervical spine n and
cervical spine n+1) is regarded as the edge of the cer-
vical spine used for measurement (Figure 4(d)). How-
ever, since approximate polygons below C3 are ap-
proximated to be inscribed in the convex hull region,
their edges may be far from the contour coordinates
of the estimated region. In this case, we extract the
contour coordinates near the selected edge in the ap-
proximate polygon (Figure 4(f)). Let x1 and y1 be
the coordinates of the left end of the selected edge in
Cervical Spine Range of Motion Measurement Utilizing Image Analysis
863
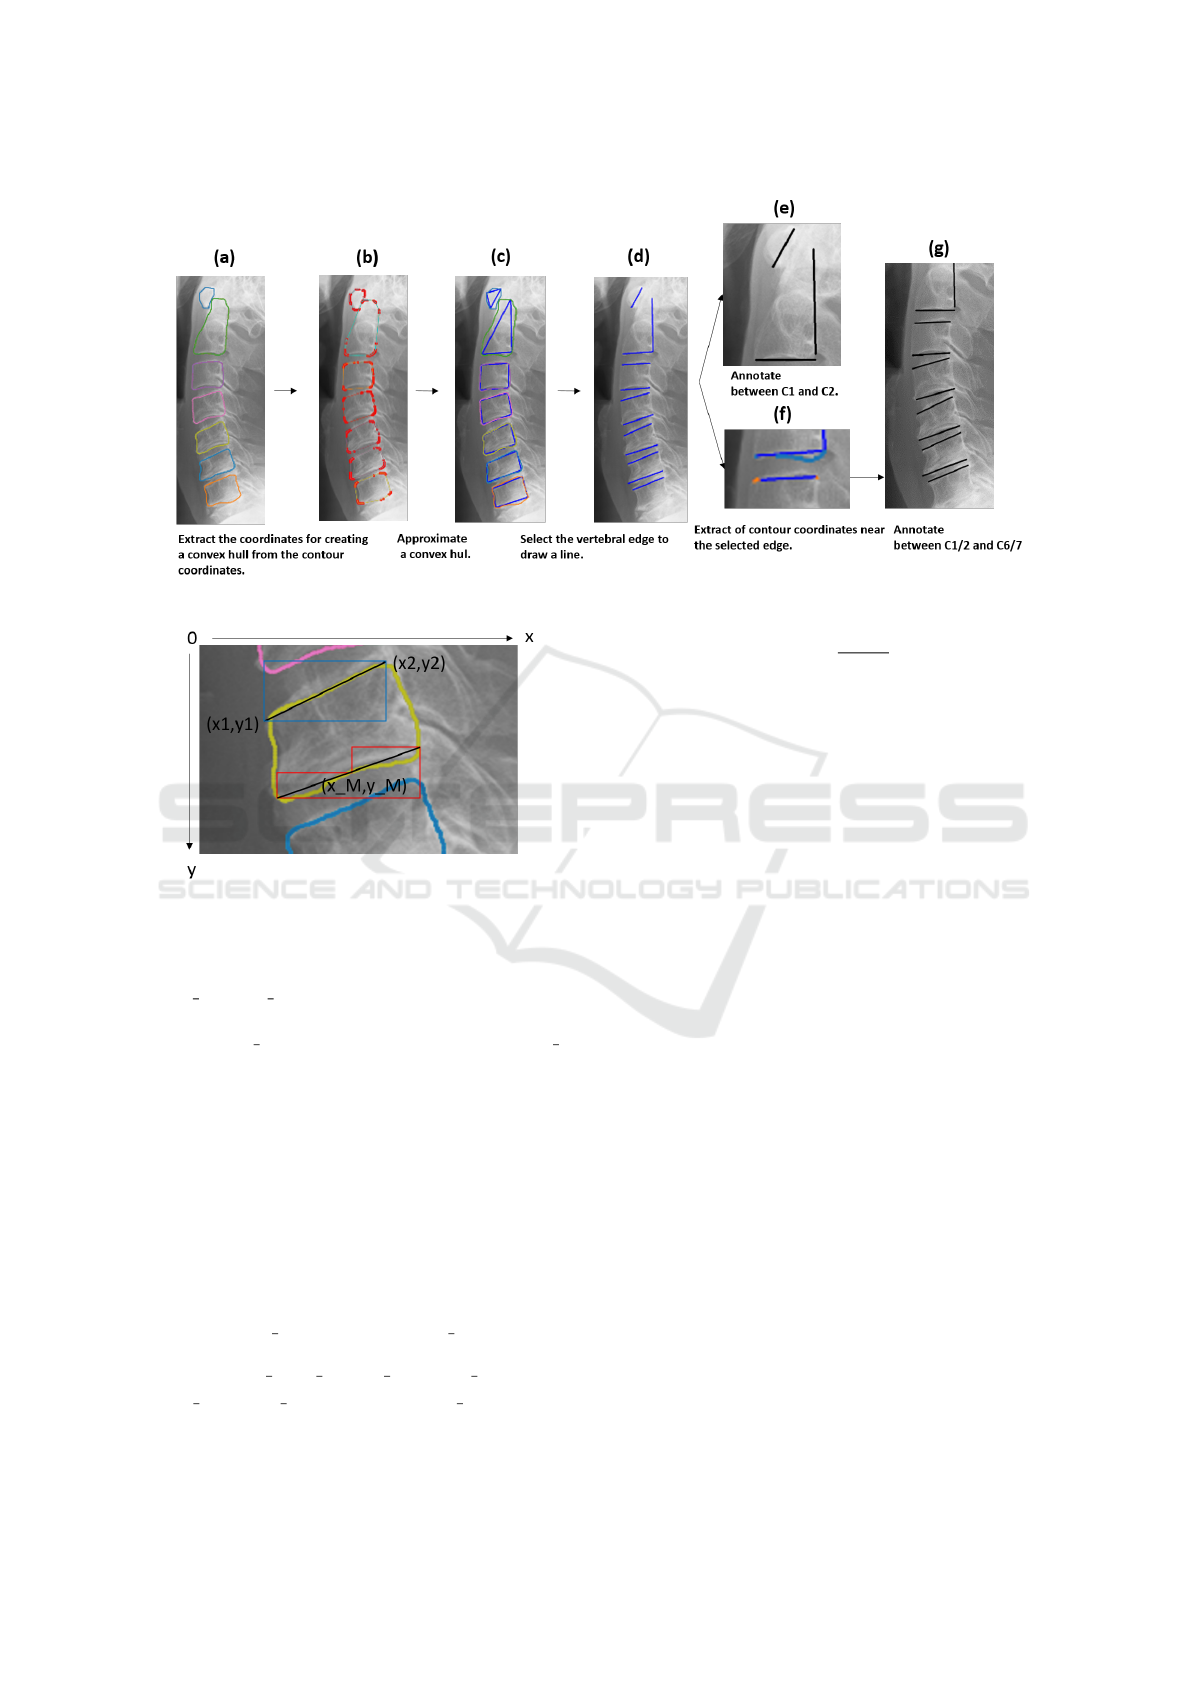
Figure 4: Flow of automatic annotation.
Figure 5: Extraction range of coordinates through which the
line passes.
the approximate polygon, x2 and y2 be the right ends,
and x M and y M be the midpoints (Figure 5). If we
denote the x-coordinate group of the contour coordi-
nates as verts x and the y-coordinate group as verts y,
the upper edge of the vertebra of interest is the contour
coordinate that satisfies the conditions of Equation 1,
and is the contour coordinate in the blue box in Figure
5. The lower edge is the contour coordinate that satis-
fies the conditions of Equation 2, which is the contour
coordinate in the red box in Figure 5. A line is drawn
on these coordinates using the least-squares method
to find the angle between them (Figure 4(g)). The an-
gle between the two lines is calculated from Tangent’s
additive theorem by using Equation 3, where a and b
are the slopes of the two lines.
(x1 ≤ verts x ≤ x2) ∩ (y2 ≤ verts y ≤ y1) (1)
(
(x1 ≤ verts x ≤ x M) ∩(y M ≤ verts y ≤ y1)
(x M ≤ verts x ≤ x2) ∩ (y2 ≤ verts y)
(2)
tanΘ =
a − b
1 + ab
(3)
4 EVALUATION
4.1 Conditions for Learning Model of
Cervical Spine Region
The dataset used in this study consisted of 968 X-ray
images of cervical spine flexion and extension in 484
individuals aged between 20 and 100 years who were
patients at the Department of Radiology, Tokyo Med-
ical and Dental University Medical Hospital. Of these
968 images, 922 (461 patients) were used as training
data, and the remaining 46 (23 patients) were used as
test data.
We used the weights learned by Microsoft COCO
as the initial weights and updated them by re-training
the entire network with the created training data. The
training parameters are listed in Table 1. The 922
training data were divided so that the ratio of train-
ing data to validation data was 8 to 2. The learning
parameters in this experiment were as follows.
4.2 Results and Discussion of Learning
Model for Cervical Region
We performed estimation on 46 images of the test
data. Out of a total of 322 cervical vertebrae in these
46 images, 313 were successfully estimated. This
means that 97% of the total test data was able to be
detected. Intersection over Union (IoU), which is the
similarity between two sets, was used to evaluate the
VISAPP 2022 - 17th International Conference on Computer Vision Theory and Applications
864

Table 1: Hyperparameters.
Training data 756 images
Validation data 166 images
Classification Three-class classification
Number of epochs 100
Image size 512 × 512 px
Batch size 1
Learning coefficient 0.001
Optimization method Stochastic gradient descent
Table 2: IoU of each cervical spine.
Position IoU
C1 0.74
C2 0.83
C3 0.88
C4 0.88
C5 0.87
C6 0.86
C7 0.86
Average 0.85
estimated cervical region. The IoU value is obtained
by dividing the common part of the correct and esti-
mated regions by the union of the two regions, where
the maximum value is represented by 1. The higher
the value, the higher the accuracy of the object detec-
tion. The IoU values for each cervical spine vertebra
are shown in Table 2. The mean IoU value for all 46
test data was 0.85.
4.3 Accuracy Comparison between
Proposed System Measurements
and Resident Measurements
The measurement accuracy of the automatic measure-
ment method was evaluated by comparing the average
error between the true value and the automatic mea-
surement value, and between the true value and the
resident’s measurement value, using the specialist’s
measurement as the true value. A specialist in this
context refers to a physician who specializes in the
diagnosis of the cervical spine, while a resident refers
to a physician who does not specialize in the diagno-
sis of the cervical spine.
The data to be measured were the same 46 im-
ages of the test data (23 patients) used to validate the
learning model in the cervical region. The true value
was measured 69 times by two specialists, 23 persons
(test data) × 3 times (number of measurements). The
frequency of measurement was limited to once a day
and was not continuous. The true value is the average
of the three measurements taken by two medical spe-
cialists. Two residents who were given guidance on
the cervical RoM angle measurement by a specialist
were asked to measure the test data under the same
conditions as the specialist. In the measurement of
the RoM angle in the test data, the number of places
where automatic measurement was possible was 133
out of 138 places for 23 persons × 6 (places where
the RoM angle was measured). The remaining five
places were not measured because the cervical region
could not be estimated: the cervical regions were not
segmented at all.
The error between the true value and the automatic
measurement value was calculated by averaging the
difference between the two for each vertebra as an ab-
solute value. The error between the true value and the
value measured by a resident was calculated by av-
eraging the difference between the true value and the
resident’s measurement between each cervical spine
for each of the three times the resident performed the
measurement. The mean error between the true value
of the RoM angle between each vertebra in the auto-
matic and resident measurements is shown in Table
3. We also calculated the standard deviations for each
measurement by the specialist and the residents, with
the results shown in Table 4. In the automatic mea-
surement, the standard deviation was 0 because the
same value was obtained even after three measure-
ments.
We compared the errors of the true value and the
automatic measurement with those of the true value
and the residents measurement. Figure 6 shows the
comparison of the average error between the resident
and automatic measurements. There was no differ-
ence in the overall mean error between the automatic
and residents measurement. However, the variance in
error was smaller for the automatic measurement. We
performed a two-sided t-test at the 5% level of sig-
nificance to see if these was statistically significant.
Variable 1 is the error value of the resident, and the
number of samples was 798: resident (2 persons) ×
number of measurements (3 times) × 133/138 cervical
intervals. Variable 2 is the error value of the automatic
measurement, and the number of samples was 798:
133/138 cervical spine × the number of measurements
of the system (6 times). There was no significant dif-
ference in the average error between the resident and
automatic measurements. We examined the signifi-
cant differences in the errors for each of C1/2–C6/7.
There is a significant difference in C2/3 and C5/6 and
the resident has a smaller error. C3/4 and C4/5 have
also significant but the automatic measurement has a
smaller error.
Cervical Spine Range of Motion Measurement Utilizing Image Analysis
865
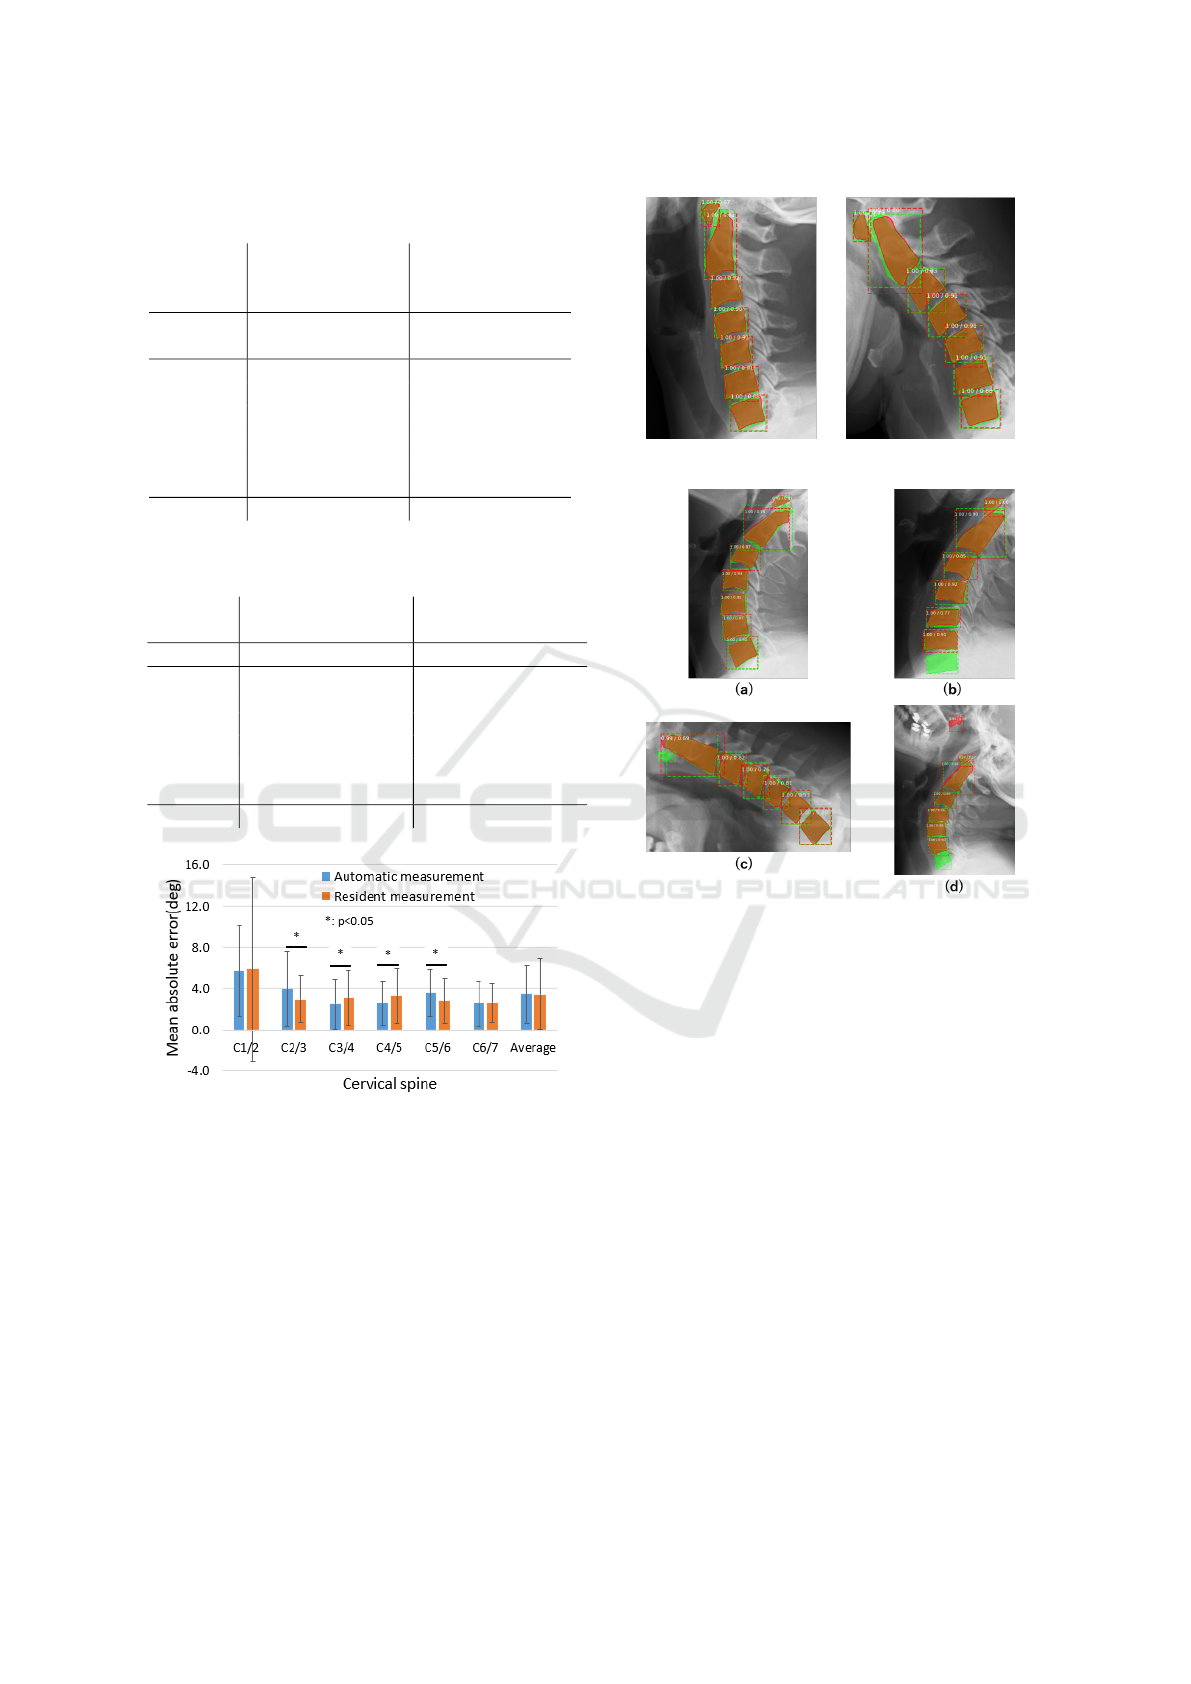
Table 3: Average error compared to the specialist measure-
ment.
Automatic
measurement
(deg)
Resident
measurement
(deg)
vertebrae
Average
error
Standard
deviation
Average
error
Standard
deviation
C1/2 5.7 4.4 5.9 8.9
C2/3 4.0 3.6 2.9 2.3
C3/4 2.5 2.4 3.1 2.7
C4/5 2.6 2.1 3.3 2.7
C5/6 3.6 2.3 2.8 2.2
C6/7 2.5 2.2 2.6 1.9
Average 3.5 2.8 3.5 3.4
Table 4: Standard deviation of specialist and resident mea-
surements.
Specialist value
(deg)
Resident value
(deg)
Vertebra Standard deviation Standard deviation
C1/2 4.4 5.2
C2/3 2.4 2.6
C3/4 2.9 2.9
C4/5 2.5 3.0
C5/6 2.7 2.7
C6/7 2.4 2.7
Average 2.9 3.2
Figure 6: Comparison of mean error between resident mea-
surements and automatic measurements.
4.4 Discussion
Figure 7 shows an example of the correct estimation
of C1 to C7, where the green color represents the cor-
rect region and the red color represents the estimated
region. The average IoU in this case was over 0.85.
Examples of incorrect estimation are shown in Figure
8. Cases (a), (c), and (d) were presumably caused by
a lack of training data, while case (b) seems to have
stemmed from a problem with the X-ray image. In the
future, we discuss whether it is possible to measure
the RoM angle of the part that could not be measured
Figure 7: Example of correct estimation.
Figure 8: Examples of incorrect estimation: (a) Large miss-
ing estimation area. (b) C6 and C7 are hidden in the pa-
tient’s chest and cannot be estimated. (c) C1 is not es-
timable. (d) Non-cervical region estimated to be cervical
spine.
by our method by learning the past RoM angle values
measured by physicians and images as a set and then
performing regression analysis.
According to the results in 4.2, the IoU values
of C1 were smaller than those of other cervical re-
gions. The IoU values of C2 also tended to be smaller
than those of C3 to C7. This indicates that the es-
timation accuracy of the cervical region of C1 and
C2 is low. Moreover, the accuracy of the proposed
system was particularly poor for C1/2 between C1/2
and C6/7. One of the factors that reduced the mea-
surement accuracy was the low estimation accuracy
of the cervical region of C1 and C2. The reason for
this low estimation accuracy is that C1 and C2 are la-
beled differently, and there is only one region in one
image, but C3 through C7 are labeled the same, so
there are four regions in one image. We therefore con-
clude that the IoU values of C1 and C2 were lower be-
VISAPP 2022 - 17th International Conference on Computer Vision Theory and Applications
866

cause these two vertebrae had less training data than
C3–C7. However, although the IoU value tends to in-
crease as the number of training images is increased,
the IoU values of C2–C7 at the current number of im-
ages tends to reach a peak. As for C1, the trend of
increasing IoU value is seen. From the above, the cur-
rent number of data sets is sufficient for C2–C7. On
the other hand, it is expected that even if the number
of training images is increased, the IoU only increases
for C1. If we can increase the amount of training data,
we should be able to improve the accuracy of the es-
timation of C1.
5 CONCLUSION
In this paper, we proposed a cervical spine RoM angle
measurement assistance system to measure the cervi-
cal RoM angle by using image analysis. Our findings
showed that Mask R-CNN estimation of the cervical
region was able to estimate 97% of the total test data,
resulting in an overall IoU of 0.85. The standard de-
viation of the measurements was 2.9 degrees among
the specialists and 3.2 degrees among the residents,
while that of the proposed system was just 0, as the
measurements did not change no matter how many
times they were taken. The reproducibility, which
is an advantage of computer vision technology, al-
lowed the physician’s measurements to overcome the
problem of inconsistent values. The mean measure-
ment error of the proposed system and residents were
same value: 3.5 degrees. In the errors for each of
C1/2–C6/7, there is a significant difference in C2/3,
C3/4, C4/5, and C5/6. However, there was no signifi-
cant difference in the overall mean error between the
automatic measurement and the resident’s measure-
ment.
In the analysis of cervical X-ray images, attention
should be paid not only to the RoM angle but also to
the normal alignment of the cervical spine. In future
work, we will increase the amount of training data
to improve the accuracy of cervical spine region esti-
mation and see if we can determine the cervical mis-
alignment to estimate the defective cervical spine re-
gion. We also plan to try other segmentation methods
to compare the accuracy of the cervical region estima-
tion and the accuracy of the RoM measurement.
ACKNOWLEDGEMENTS
This work was supported by JST AIP-PRISM, grant
number JPMJCR18Y2; and JSPS KAKENHI, grant
number JP21H03485. We appreciate Dr. Kaburaki
of Tokyo Medical and Dental University for his coop-
eration in the measurements and Assistant Professor
Ienaga for his advice on this study.
REFERENCES
Alomari, R., Chaudhary, V., and Dhillon, G. (2011). Com-
puter aided diagnosis system for lumbar spine. In
Proceedings of the 4th International Symposium on
Applied Sciences in Biomedical and Communication
Technologies, pages 1–5. ACM.
Arif, S. A., Knapp, K., and Slabaugh, G. (2018). Sp-
net:shape prediction using a fully convolutional neural
network. In International Conference on Medical Im-
age Computing and Computer-Assisted Intervention,
page 430–439.
Choi, R., Watanabe, K., Jinguji, H., Fujita, N., Ogura,
Y., Demura, S., Kotani, T., Wada, K., Miyazaki, M.,
Shigematsu, H., and Aoi, Y. (2017). Cnn-based spine
and cobb angle estimator using moire images. IIEEJ
Transactions on Image Electronics and Visual Com-
puting, 5(2):135–144.
He, K., Gkioxari, G., Dollar, P., and Girshick, R. (2017).
Mask r-cnn. In Proceedings of the IEEE International
Conference on Computer Vision, page 2961–2969.
Huaifei, H., Liu, H., Chen, L., and Hung, C. (2011). Image
segmentation of cervical vertebra in x-ray radiographs
using the curve fitting strategy. In Proceedings of the
2011 ACM Symposium on Applied Computing, page
853–858.
Lecron, F., Benjelloun, M., and Mahmoudi, S. (2010).
Points of interest detection in cervical spine radio-
graphs by polygonal approximation. In International
Conference on Image Processing Theory. IEEE.
Long, J., Shelhamer, E., and Darrell, T. (2015). Fully con-
volutional networks for semantic segmentation. In
Proceedings of the IEEE Conference on Computer Vi-
sion and Pattern Recognition, page 3431–3440. IEEE.
Masuzawa, N., Kitamura, Y., Nakamura, K., Iizuka, S., and
Simo-Serra, E. (2020). Automatic segmentation, lo-
calization, and identification of vertebrae in 3d ct im-
ages using cascaded convolutional neural networks. In
Medical Image Computing and Computer Assisted In-
tervention – MICCAI 2020, page 681–690.
Ronneberger, O., Fischer, P., and Brox, T. (2015). U-
net: Convolutional networks for biomedical image
segmentation. In International Conference on Med-
ical Image Computing and Computer-Assisted Inter-
vention, page 234–241.
Uozumi, H., Matsubara, N., Teramoto, A., Niki, A., Hon-
moto, T., Kono, T., Saito, K., and Fujita, H. (2020).
Lung region segmentation on pediatric chest x-rays
using mask r-cnn in japanese. Med Imag Tech,
38(3):126–131.
Young, H., Sewon, K., Suh, J., and Hwang, D. (2018).
Learning radiologist’s step-by-step skill for cervical
spinal injury examination: Line drawing, prevertebral
soft tissue thickness measurement, and swelling de-
tection. volume 6, pages 55492–55500.
Cervical Spine Range of Motion Measurement Utilizing Image Analysis
867
