
IoT Application for Monitoring and Storage of Temperature History
in Electric Motors
Jairovan Denis de Paiva
1a
, Carlos Roberto da Silveira Junior
2b
and
Arquimedes Lopes da Silva
2c
1
Saneago, Goiânia, Goiás, Brazil
2
Instituto Federal de Goiás, Goiânia, Goiás, Brazil
Keywords: IoT, Cloud Computing, Temperature Sensors, Temperature Measurement, Condition Monitoring, Induction
Motors.
Abstract: The three-phase induction motor is the most used type of motor. It is estimated that more than 90% of the
mechanical energy used in industry is supplied by three-phase induction motors. Therefore, an early and
unexpected failure of an electric motor is quite costly to the industry. This paper aims to present the
development of an IoT (Internet of Things) application for monitoring and storing the operating temperature
history of three-phase electric motors through a wireless sensor network. Real-time temperature values, peak
temperature values, tables and graphics of internal engine temperatures are displayed from web pages. Two
1200 HP motors were monitored. The temperatures were obtained through PT100 transducers installed in the
motor windings and the ambient temperature read by a digital sensor. The data read by the sensors is kept in
a database in the clouds, in order to generate relevant information to support the maintenance management of
these assets. Part of the application processing is performed in the clouds, such as the parameterization of the
microcontroller program and sending notifications via email, for cases of reading failure, communication
failure and high temperature alert. The results demonstrate the applicability and functionality of the
application in an industrial environment, allowing the identification of various engine behaviors over time.
1 INTRODUCTION
It is estimated that one third of maintenance costs are
wasted as a result of unnecessary or incorrectly
performed maintenance (MOBLEY, 2002, p.1).
These unnecessary maintenance often occur within
the scope of preventive maintenance, as their
management is based on time intervals defined by
statistical trends, which often do not reflect the actual
operational condition of the equipment. Predictive
maintenance arises to solve this problem, as
interventions are based on the condition of the
equipment, rather than the operating time. The
operational condition of the equipment is obtained
through regular monitoring of quantities such as
temperature, vibration, among others.
a
https://orcid.org/0000-0003-2912-9572
b
https://orcid.org/0000-0003-2891-929X
c
https://orcid.org/0000-0003-3202-1036
Detective maintenance is an evolution of
predictive maintenance, has more automation
features and uses intelligent electronic devices. It’s
based on systematic measurements of items that may
have hidden failures, where the loss of function
cannot be perceived by the operator and maintainer
(SEIXAS, 2011).
A large part of the anomalies observed in electric
motors are linked to the increase in operating
temperature, whether it's the cause, or the
consequence, of this temperature rise. Therefore,
monitoring the temperature of an engine in real time,
and maintaining a database with the temperature
history, in a structured way to generate relevant
information, provides ways to manage the
maintenance of these equipment more efficiently and
reliably. The measurement history can support studies
Denis de Paiva, J., Silveira Junior, C. and Lopes da Silva, A.
IoT Application for Monitoring and Storage of Temperature History in Electric Motors.
DOI: 10.5220/0010818300003118
In Proceedings of the 11th International Conference on Sensor Networks (SENSORNETS 2022), pages 121-128
ISBN: 978-989-758-551-7; ISSN: 2184-4380
Copyright
c
2022 by SCITEPRESS – Science and Technology Publications, Lda. All rights reserved
121

of failures and possible errors in the design,
installation or operation of equipment.
The objective of this work is to develop an IoT
application for monitoring and storing the
temperature history of electric motors, using wireless
sensors connected to the internet and services
available in the cloud, in order to generate
information to support the management of the
maintenance of these assets. To carry out this
monitoring, a system with a microcontroller will be
used, which takes readings from PT100 sensors
installed in electric motors and sends these readings
to a database in the clouds. A WEB interface is used
for interaction with the user, allowing the user to
access this data, configure system parameters, receive
notifications and use the temperature history to
generate relevant information for maintenance
management.
2 OVERVIEW
2.1 Maintenance on Electric Motors
In short, maintenance actions can be divided into
three main types: corrective, preventive and
predictive. Corrective maintenance, the most costly
type, is carried out after a failure occurs, where the
equipment stops (NBR 5462, 1994). Preventive
maintenance is a type of time-based maintenance. It
must be carried out on predetermined dates, with the
aim of reducing the probability of failures
ALMEIDA, 2013). Despite having lower costs, it also
generates costs that could be avoided (MOBLEY,
2002, p.4).
Predictive maintenance seeks to obtain the actual
operating conditions of the machine. For this, it uses
specific equipment for monitoring phenomena such
as temperature, vibration, noise, etc. (ALMEIDA,
2013). The results of these inspections determine the
ideal time for intervention in the equipment. With the
evolution of embedded systems and industrial
networks, a new term appears in the area of
maintenance, detective maintenance. It differs from
predictive maintenance, by continuous monitoring
and the use of intelligent electronic devices
(PAULINO, 2014), with increased reliability
according to the level of the implemented system, in
addition to the possibility of storing the history of
equipment variables.
2.2 Effect of Temperature Rise on
Electric Motors
Copper losses are the major heat source of the
machine and are directly proportional to the load to
which the equipment is subjected. They occur due to
the joule effect on the resistive element of the
machine winding. Core losses or iron losses are due
to eddy currents and due to the hysteresis effect
(ALMEIDA, 2013). Harmonic currents and phase
voltage imbalances also cause temperature rise.
Delayed starts, due to loads with very high
resistant torque and successive starts also increase the
temperature of the equipment, as the starting current
reaches peaks of up to eight times the rated current.
In applications driven by frequency inverters, it
should be noted that when the motor speed is reduced,
the air flow produced by the fan coupled to the motor
shaft is reduced in the same proportion, which may
result in an increase in the temperature of the
equipment.
High temperature is the main villain of the
insulating material. The life of the insulation will be
reduced by half for each 10 °C increase in
temperature (GILL, 2009, p.9). In case of sudden
temperature rises in a short period of time, a failure
may occur due to material melting, causing an
immediate failure. On the other hand, temperatures
above the limit of the insulating class, but well below
the melting point, can for a long term cause internal
chemical effects, which make the material look more
dry, brittle, with micro-cracks, which causes
premature aging and degradation of insulation. With
the aging of the insulation, there are partial
discharges, which cause the progressive deterioration
of the insulating materials, leading to a total electrical
failure (TOLIYAT et al., 2013, p.11-12).
By monitoring and maintaining the temperature
history of the windings, it is possible to determine if
the winding is at risk of thermal deterioration and
degradation of the insulating material. In addition, the
finding of an increase in temperature under the same
operating conditions (load, ambient temperature and
voltage) may be indicative of failure or degradation
of the cooling and heat dissipation system
(TOLIYAT, et al. 2013, p.13) .
2.3 Wireless and IoT Sensor Network
Advances in technology, such as large-scale
integration, micro-electromechanical systems and
wireless communications, contribute to the feasibility
of implementing distributed sensor systems. When
many sensors cooperatively monitor large physical
SENSORNETS 2022 - 11th International Conference on Sensor Networks
122
environments, they form a wireless sensor network.
A wireless sensor has, in addition to the transducer
component, processing, communication and storage
resources (DARGIE & POELLABAUER, 2010, p.7).
The wireless sensor network has the advantage of not
requiring cabling infrastructure, in addition to being
easily expandable and reconfigurable.
The wireless sensor network will be able to use
the internet infrastructure to interconnect its nodes
and use storage and processing services in the cloud.
In this context, the concept of IoT is entered. The term
has several definitions, however there is in common,
among the understanding of several authors, the idea
of being an environment of physical objects
interconnected through the internet, through small
sensors and actuators, introducing functional
solutions in everyday processes (MAGRANI, 2018,
p.20).
Large manufacturers such as WEG and ABB
provide applications for remote temperature
monitoring through wireless sensors. However, the
cost is still high for many cases. These applications
have a commercial nature, and their system and
source code are inaccessible and unalterable by users.
This is a major disadvantage, as it does not allow
integration to systems already implemented,
adaptation to user needs and the natural evolution of
these needs.
2.4 Related Works
Fabricio (2018) developed an application for
monitoring equipment on a production line, through
monitoring the consumption of electrical currents, in
order to detect operational deviations that could lead
to failures. The system uses an intermediate
concentrator node between the sensors and the
database, which is hosted on a personal computer. It
uses an IoT application to visualize the data in textual
and graphical form and send notification in the event
of operational deviations, with the history being
stored in the database to assist in the maintenance of
these equipment.
Pedotti's (2019) work presents a low-cost device,
which aims to diagnose failures through continuous
monitoring of vibration in rotating machines. The
ESP32 development board and WiFi communication
were used. Data transfer is done through the MQTT
protocol to a cloud computing platform, for the
storage and display of results.
Muta’ Ali (2021) developed an IoT application for
monitoring water quality in large areas. The system
consists of two microcontrollers, one performs
variable readings on the water and sends it to the other
through a long-range network. The second
microcontroller works as a gateway for connecting to
the internet, as it uploads the data to a cloud server.
This application uses the Google spreadsheet
application as its database. The user interface is
accessed through a WEB page. In the same line of
development, Kavitha and Vallikannu (2019)
developed a pollution control system, by monitoring
the level of gas or fuel by intelligent sensors in an
industry. This monitoring is carried out by a network
of wireless sensors, which detect gas leaks and their
location. Sensor data is also sent to the Google
spreadsheet.
3 MATERIALS AND METHODS
The project presented the following steps:
bibliographic study on the causes and effects of high
temperature in electric motors and on the use of
monitoring this temperature to help manage the
maintenance of these equipment; bibliographic study
on the use of wireless sensor networks and the use of
IoT in monitoring electrical equipment; survey of
application requirements; assembly of the electronic
circuit and development of the microcontroller and
WEB part software; tests and fixes; device
installation and data monitoring, to extract
information about the operating condition of the
equipment.
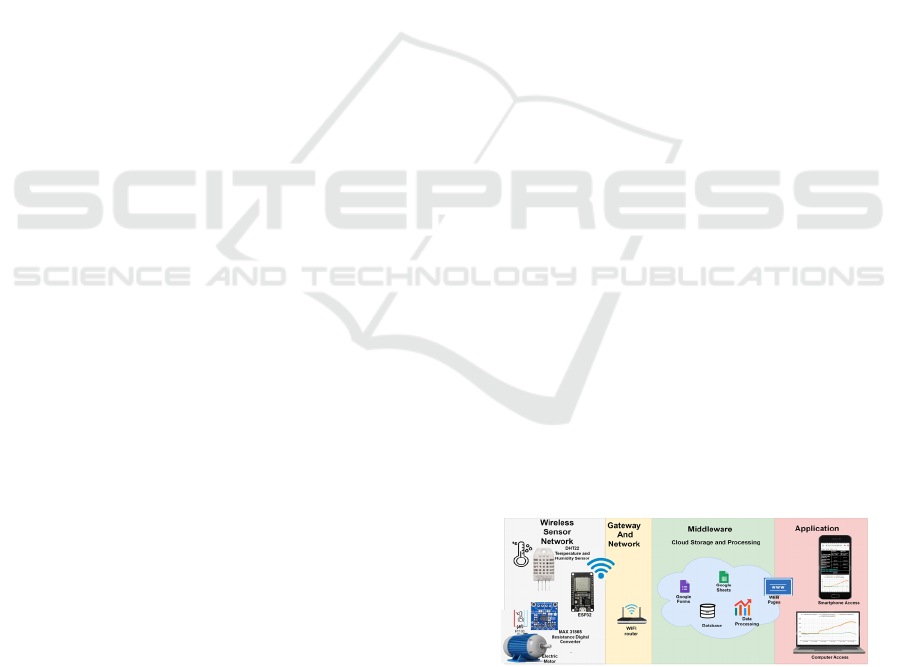
Figure 1 shows the architecture and functional
layers of the developed system. A microcontroller
performs temperature sensor readings in the engine
and the external environment, and after pre-
processing it sends this data over a wifi network to a
database hosted in a spreadsheet. This submission is
done through the forms feature, by an HTTP request.
The spreadsheet performs data processing in the
cloud and extracts relevant information, which feeds
WEB pages, which can be accessed by users.
Figure 1: System architecture and his functional layers.
The device was installed on two engines. The
monitored motors have a mechanical power of 1,200
CV, fed at medium voltage, for 2,300 V, and have
Class F insulation, which supports temperatures,
IoT Application for Monitoring and Storage of Temperature History in Electric Motors
123
without compromising their useful life, of up to 140
°C. These motors are used to drive centrifugal pumps.
In the physical device, the following were used:
ESP32 and ESP8266 development boards, the MAX
31865 resistance digital converter, the DHT22
temperature and humidity sensors, and LEDs for
signaling. To program the development board the
IDE (Integrated Development Environment) of
Arduino was used. For the development of the WEB
application, the Google Spreadsheet service and
Google Apps Scripts were used. For monitoring the
temperature of electric motors, in the way it was
conceived, the PT100 is the most suitable sensor.
Mainly due to its accuracy and greater immunity to
electrical noise.
ESP32 is a low-cost, power-consuming
development board with built-in Wi-Fi and Bluetooth
capabilities. Its use is very suitable for IoT project
solutions, due to the integration of components in a
single module (MAIER, SHARP, VAGAPOV,
2017). As a digital resistance converter, the MAX
31865 was used, optimized for thermoresistance
(PT100 and PT1000), with a resolution of 0.03125
°C, precision of 0.5 °C and an interface compatible
with SPI (serial peripheral interface) (MAXIM
INTEGRATED, 2015).
For hosting the data in the clouds, Google Sheets
was used, with storage and processing in the cloud.
For the development of the user notifications
application, Google Apps Scripts was used, a cloud
scripting language based on the JavaScript language,
which provides means for automating tasks, creating
functions, applications and integrating google
spreadsheets with other services from WEB and the
development of graphical interfaces to be used in
WEB applications (MAGUIRE, 2016, p.2-3).
4 RESULTS
For the electronic circuit, two temperature readers
were developed, one using the ESP32, which has
more features and the other using the ESP8266 which,
despite its lower performance, met the application
requirements and has a lower cost, being more
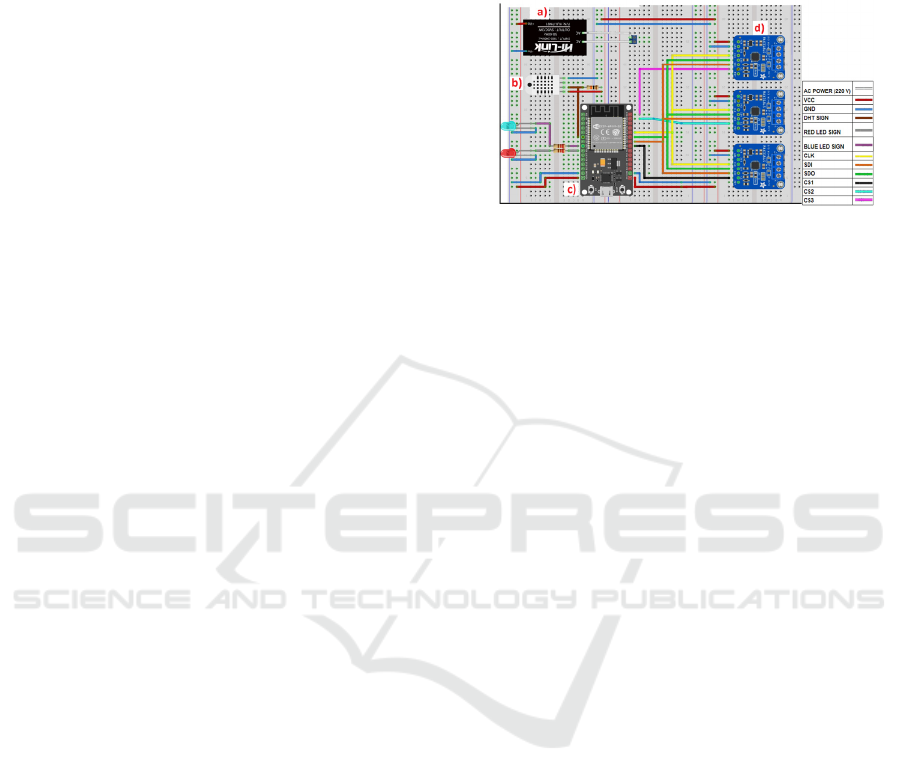
accessible for some applications. The electronic
circuit that uses the ESP32, was assembled as shown
in Figure 2, the other was assembled in a similar way,
changing only the input and output pins. The system
uses 3 resistance digital converters to read the PT100
temperature. The communication between the
microcontroller and the resistance digital converters
uses the SPI - Serial Peripheral Interface protocol,
which uses 3 shared pins for control, and one more
pin per device for device selection. SPI is a high-
speed full-duplex synchronous serial bus, with
Master/Slave control (Master/Slave) (DARGIE &
POELLABAUER, 2010, p.58).
Figure 2: Assembly of the electronic circuit. Where is
shown: (a) power supply; (b) outdoor temperature and
humidity sensor; (c) ESP32 controller; (d) MAX 31865
digital converter.
As the heating of an electric motor can be related
to the rise in the ambient temperature, and the ambient
temperature is also influenced by the engine
temperature, a digital ambient temperature and
humidity sensor, the DHT22, was used. Two LEDs
(Light Emitting Diodes) were used for signaling. The
blue LED flashes when communication is successful,
the red LED flashes when there is a failure.
There are several ways to edit the spreadsheet, by
an external system. The simplest is using Google
Forms, which is a form that can be linked to a
spreadsheet. In this way, it is possible to feed the
spreadsheet by sending responses through this form,
without the need for authentication. Another
advantage of using Forms is that it fills in the date and
time automatically when sending it, eliminating the
use of RTC (Real Time Clock) in hardware.
Clients and servers communicate through the
HTTP (Hypertext Transfer Protocol), which defines
how clients request files from servers and how they
transfer them to clients. An HTTP request message
has a header and an entity body. Among the methods
used by HTTP requests, the most common are GET
and POST. In the POST method the entity body will
contain the data typed in the fields of a form, for
example. In the GET method, these data are contained
in the requested URL itself and the entity's body is
sent empty.
To compress the data volume without losing
information, a conditional was inserted in the
program, so that the device sends temperatures only
when the temperature varies by an amount greater
than a predefined value. This reference value is a
program parameter that, along with other parameters,
can be defined by the user in the spreadsheet itself, in
an exclusive tab for configuring the parameters used
SENSORNETS 2022 - 11th International Conference on Sensor Networks
124
by the microcontroller program, and by the WEB
application.
Unlike data submission, which uses the form
feature, spreadsheet reading requires API key
activation and use of authenticators. In the simplest
form, leaving the spreadsheet as public for reading, it
is only necessary to activate the API key, a simple
process that can be performed on Google's API
management platform.
The other parameters were used to define the
number of readings of the temperature converter to
calculate the temperature average, the number of
program cycles for updating the parameters and
finally the maximum number of readings without
sending data, where the device will send the data,
even not satisfying the temperature variation
condition, in order to enable the detection of failures.
For the web application, there are the temperature
limit parameters for notification, the maximum time
without receiving data for failure notification and the
registration of emails to receive these notifications.
In this way, the user can adapt the parameter
values according to the equipment to be monitored
and its working condition, in addition to taking into
account the number of sensors used. Using a
minimum variance of 0.5°C for submission, and a
maximum number of reads without submission equal
to 50, the number of submissions reduced to an
average of one submission every five minutes. Thus,
the same spreadsheet will support temperature
storage for a period exceeding 8 years.
The user also has the possibility to allow this
parameterization to be automatic, which determines
the best value for the parameters according to the
condition in which the equipment is found. Some
equipment is off for a long time, a situation in which
its temperature will be well below its working
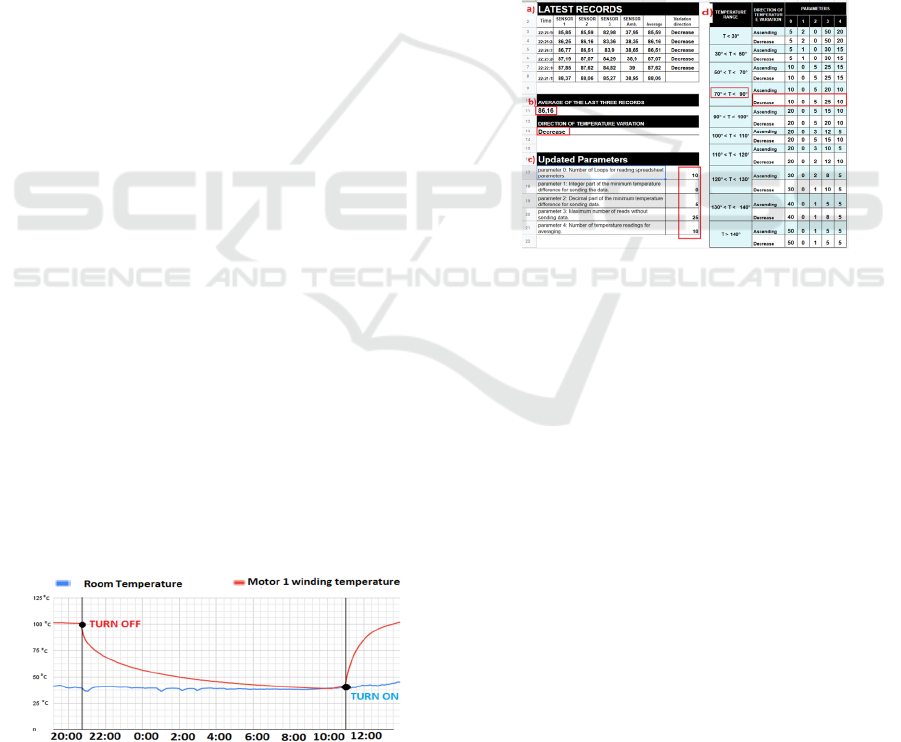
temperature, so monitoring is not relevant. The graph
in Figure 3 shows an example of a device that was
turned off for more than 12 hours. It would not be
efficient, in terms of space occupation in the
spreadsheet, to maintain the same sending rate during
this period.
Figure 3: Motor 1's temperature graph. Points that
demarcate the period in which the engine remained off is
highlighted.
This way a script runs on the server, every time
temperature data is received. It searches within a table
with predefined values, table (d) in Figure 4, for a
group of parameters more suitable for the condition
the equipment is in, according to table (a) in Figure 4.
Automatic choice of the parameter group, takes into
account the temperature range in which the
equipment is located and the direction of variation, as
explained by the red rectangle markings in table (b)
of Figure 4. The selected parameter group is inserted
in the table (c) of Figure 4 for reading the
microcontroller. During the tests, at times of greatest
temperature variation, which occurred after the
equipment was turned on, the sending rate was
approximately 1 shipment every 30 seconds. On the
other hand, at times of thermal equilibrium, which
occurred most of the time, this send rate dropped to 1
send every 12 minutes on average.
Figure 4: Spreadsheet used for automatic parameterization:
(a) table of last readings; (b) table of average and direction
of temperature variation; (c) table of selected parameters
and (d) parameter groups table.
The same script that updates the parameters,
analyzes the data received, and in cases where the
temperature exceeds predefined values by the user or
when there is a failure in the sensors, it sends
notifications via e-mail to registered users. Another
script with a time-based execution trigger, different
from the first one that has an event-based trigger, is
executed on the server every pre-defined time period.
This script monitors the past time interval of the last
record and compares it with a predefined value. If it
exceeds this limit, it notifies, via e-mail, the user of a
possible communication failure.
Finally, the interface for the visualization of data
by users was developed. All information generated by
the data is available on WEB pages. The WEB pages
are multiplatform, that is, they can be accessed by
different devices, such as computers and
smartphones. The great advantage is that the user
does not need special applications to view the
IoT Application for Monitoring and Storage of Temperature History in Electric Motors
125
information, only an internet browser, which is
available on any device with internet access.
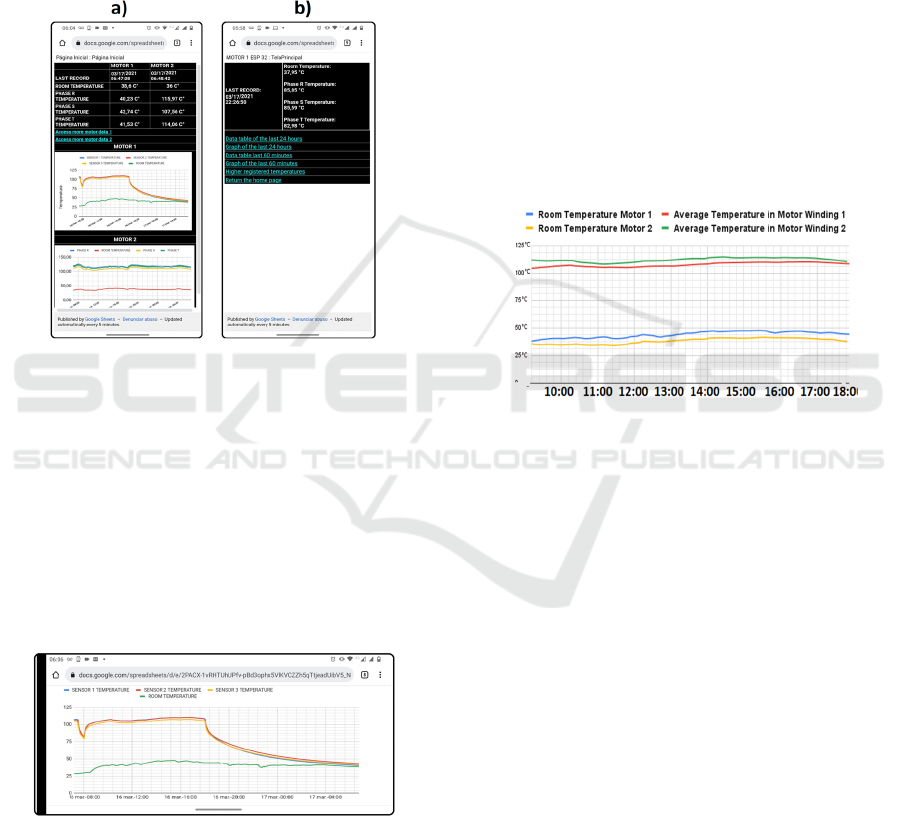
In the developed system, a kind of supervisory
was created in a spreadsheet tab, which displays the
latest readings and the graph of the last 24 hours, as
can be seen in Figure 5. Screens a and b in Figure 5
present the application's home page , where it shows
the temperatures of the last reading of each of the
monitored equipment and the temperature graph of
the last 24 hours.
Figure 5: Application screen viewed by a browser on an
Android device: (a) Application Home page, shows latest
sensor readings and graphs for the last 24 hours and (b)
exclusive page to access Motor 1's data.
On screen (b), there is the Engine 1 detail page,
which has hyperlinks to access more detailed
information about the operation of this engine, such
as tables and graphs of the last 24 hours, or the last 60
minutes and tables with peak temperature values
reached in each sensor of the equipment. Figure 6
shows a temperature graph within the engine 1 detail
pages.
Figure 6: Graphs for the last 24 hours.
During monitoring the equipment, Motor 1 had an
average winding temperature of 104°C and motor 2
of 111.6°C. Regarding the peak values, the highest
temperature recorded in engine 1 was 112.27°C and
in engine 2, 125.9°C. As the monitored equipment has
insulation class F, which withstand up to 140°
degrees, it is concluded that they are working with
adequate temperatures, and with a certain clearance
to the class limit. This indicates that the loads are well
dimensioned and that the heat dissipation process is
taking place efficiently.
The ambient temperature sensor has been
installed, in a suitable plastic frame, on the sensor
connection box. The assembly was in exactly the
same location as the two engines. The ambient
temperature sensor was very close to the equipment
frame, in order to reflect the external temperature of
the motor when measuring the ambient temperature.
When comparing the average temperatures of the
three PT100s with the ambient temperature of the two
engines simultaneously, it was observed, as shown in
Figure 7, that Engine 1, which worked at a
temperature below Engine 2, generated more heat to
the environment, as the ambient temperature around
it was higher than that of Engine 2.
Figure 7: Comparison between ambient temperature and
internal temperature of both engines simultaneously.
This indicates that the heat transfer from Motor 1
is more efficient than from Motor 2. The heat
generated inside the motor must be dissipated to the
environment through the surface of the equipment.
Cooling is aided by the fan mounted on the motor
shaft. To reduce the internal temperature of an engine,
there must be a good heat transfer from the engine's
interior to the external surface (GONÇÁLEZ, 2007).
Therefore, Motor 1, by transferring more heat to the
environment, further reduces the internal
temperature.
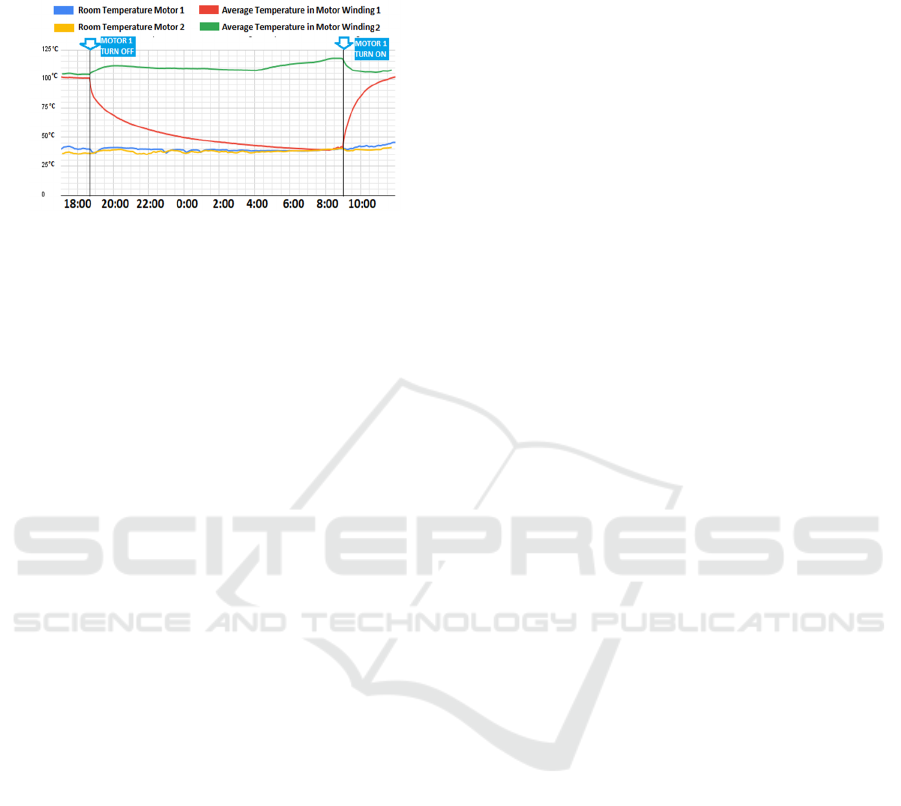
When analyzing the effect of the operating state
of one engine on the temperature of the other, it was
found, as shown in the graph in Figure 8, that when
turning Motor 1 off, indicated by the left arrow in
Figure 8, Motor 2 raises its internal temperature. On
the other hand, when Motor 1 is turned on again,
indicated by the arrow on the right in Figure 8, Motor
2 reduces its internal temperature again. This
temperature variation in the motor is due to the load
variation. According to (ELETROBRÁS, 2005, p.
137), a pump associated with another in parallel will
always provide a lower flow rate than when it works
SENSORNETS 2022 - 11th International Conference on Sensor Networks
126
in isolation. Therefore, the parallelism of the pumps
reduces the flow in the pump, which implies a
reduction in the power demanded from the motor.
Figure 8: Temperature variation in one engine due to the
state of the other engine.
5 CONCLUSIONS
Electric motors are fundamental to most industrial
processes. Keeping this equipment in operating
condition is essential to ensure the effectiveness and
efficiency of these processes. Continuous monitoring
combined with good maintenance management of
these equipment can guarantee both reliability and
cost reduction, by determining the most appropriate
time to carry out interventions on these machines.
Advances in wireless sensor networks make this
continuous monitoring possible. These solutions have
a lot of computing resources, and can autonomously
perform complex operations, such as sending data to
a database hosted on an internet server, used as a
means to connect these sensors. The internet can also
be used for remote monitoring, data storage and data
processing by a multitude of existing web
applications. With advances in IoT technology and
with the expected arrival of the 5G internet, the
internet tends to become an increasingly powerful
tool.
Bringing together the simplicity of the
methodology used, the accuracy of the data generated
and the quality of the information displayed to the
user were only possible due to the use of applications
already consolidated on the internet, which provide,
through the use of APIs, a simple way to integrate.
them to simple projects, in order to maximize the
results, at very low cost, or often, as in the case of this
project, free of charge. The results achieved met all
the requirements raised at the beginning of the
project.
The data generated showed that the two monitored
devices were operating at an adequate temperature,
and with a gap to the limit of their insulation class,
which shows that the loads are well dimensioned and
that heat dissipation is efficient. However, it was
possible to observe, through the graphic analysis, that
the heat dissipation of Motor 1 was more efficient,
due to its lower internal temperature and higher
external temperature.
The results achieved open the way for future
projects, where this monitoring can extend to other
variables, in addition to temperature, such as current
and vibration, allowing for the correlation between
the quantities and increasing the diagnostic power. It
will also allow for long-term monitoring, enabling
analysis of how temperature behaves as parts, such as
bearings, begin to degrade. The generated data can
also be used by data science projects to create
predictive models to be used in predictive and
detective maintenance.
REFERENCES
ABNT NBR 5462. Reliability and maintainability -
Terminology. 1994.
Almeida, M. L. S. Temperature Evaluation of the Three-
Phase Induction Motor Submitted to Voltage
Unbalance. Master’s dissertation. University of
Brasilia. Universidade de Brasília, Brasília, 2013.
Dargie, W.; Poellabauer, C. Fundamentals of wireless
sensor networks, theory and practice. John Wiley &
Sons, 2010.
Eletrobrás. Energy Efficiency in Pumping Systems. Rio de
Janeiro: Eletrobrás, 2005
Fabrício, M. A. Monitoring of Industrial Electrical
Equipment Using IoT. Master's Thesis, PUC,
Campinas, 2018.
Gill, P. Electrical Power Equipment Maintenance and
Testing, 2º Ed. Nova York: Taylor & Francis Group,
LLC, 2009.
Gonçález, F. G.. Study of the Three-Phase Induction Motor
and Development of an Effective Protection Device for
Motors Operating in Abnormal Conditions: Locked
Rotor and Lack of Phase. Master's Thesis, Federal
University of Santa Catarina, Florianópolis, 2007.
Kavitha, B.C; Vallikannu, R. IoT Based Intelligent Industry
Monitoring System. 6th International Conference on
Signal Processing and Integrated Networks, 2019.
Magrani, E. The Internet of Things. Rio de Janeiro: FGV,
2018.
Maguire, M. Google Sheet Programming With Google
Apps Script, 2016.
Maier, A.; Sharp, A.; Vagapov, Y. Comparative Analysis
and Practical Implementation of the ESP32
Microcontroller Module for the Internet of Things.
2017 .
Maxim Integrated, Max31865 RTD-To-Digital Converter.
2015. Disponível em: https://datasheets.maximintegrated.
com/en/ds/MAX31865.pdf Acesso em 01/03/2021.
Mobley R. K. An Introduction to Predictive Maintenance.
2 ed. USA: ed.Elsevier Science, 2002.
IoT Application for Monitoring and Storage of Temperature History in Electric Motors
127

Abdul Muta’Ali, A. N.;Sazali, N.; Ghani, A. A. C.; Walter,
J. Water Monitoring System Design for Data Collection
at Specific Intervals Via Cloud Application. IOP
Conference Series: Materials Science and Engineering,
2021.
Paulino, M. E. C. Maintenance of Transformers, Chapter II
- Maintenance Considerations. The Electric Sector,
2014. Disponible: http://www.osetoreletrico.com.br
/wp-content/uploads/2014/03/ed-97_Fasciculo_Cap-II-
Manutencao-de-transformadores.pdf. Access:
27/02/2021
Pedotti, L. A. S. Low-cost IoT Device for Troubleshooting
Rotating Machines. Doctoral Thesis, State College of
Campinas, Campinas, 2019.
Toliyat, H. A; et al. Electric Machines, Modeling,
Condition Monitoring, And Fault Diagnosis. Nova
York: Taylor & Francis Group, LLC, 2013.
Seixas, E. S. Determination of the Optimal Interval for
Maintenance: Preventive, Predictive and Detective.
International Symposium on Reliability, 2011.
SENSORNETS 2022 - 11th International Conference on Sensor Networks
128
