
Feature Extraction using Downsampling for Person Re-identification
with Low-resolution Images
Masashi Nishiyama
a
, Takuya Endo and Yoshio Iwai
b
Graduate School of Engineering, Tottori University, Tottori, Japan
Keywords:
Person Re-identification, Low-resolution Images, Low-frequency Components, Downsampling.
Abstract:
We investigate whether a downsampling process of high-resolution pedestrian images can improve person re-
identification accuracy. Generally, deep-learning and machine-learning techniques are used to extract features
that are unaffected by image resolution. However, it requires a large number of pairs of high- and low-
resolution images acquired from the same person. Here, we consider a situation in which these resolution
pairs cannot be collected. We extract features from low-resolution pedestrian images using only a simple
downsampling process that requires no training resolution pairs. We collected image resolution datasets by
changing the focal length of the camera lens and the distance from the person to the camera. We confirmed that
the person re-identification accuracy of the downsampling process was superior to that of the upsampling. We
also confirmed that the low-frequency components corresponding to the output of the downsampling process
contain many discriminative features.
1 INTRODUCTION
There is a need for a person re-identification sys-
tem that covers wide areas using surveillance cam-
eras installed at various locations to track people.
This system is expected to search for the routes of
lost children and suspicious persons to make society
safe and secure. The key task in designing a per-
son re-identification system is to determine how to
extract the features that represent the personal char-
acteristics from pedestrian images. To do this, var-
ious existing methods (Zhong et al., 2017; Zheng
et al., 2015) have been proposed. When extracting
features, existing methods perform better if they ac-
quire high-resolution (HR) pedestrian images con-
taining many personal characteristics. In general, HR
images increase the probability of successful identi-
fication. However, the resolution of pedestrian im-
ages obtained from surveillance cameras is not always
high; it varies dynamically depending on the camera
settings, such as the camera lens and camera position.
When pedestrian images are acquired at low resolu-
tion, it becomes difficult to stably extract features that
correctly represent the characteristics of the individu-
als. This causes the person re-identification accuracy
to decrease.
a
https://orcid.org/0000-0002-5964-3209
b
https://orcid.org/0000-0003-2248-4563
To overcome the problem caused by low-
resolution (LR) pedestrian images, existing meth-
ods (Jing et al., 2015; Wang et al., 2016; Zheng
et al., 2018; Jiao et al., 2018) take into account res-
olution variation at the feature extraction process for
person re-identification. These existing methods use
a learning-based approach in which pairs of HR and
LR images of the same person are used as train-
ing samples for deep-learning and machine-learning
techniques. They promise to improve person re-
identification accuracy by extracting features that are
less affected by the resolution variation. However,
the learning-based approach frequently requires the
preparation of a large number of HR and LR image
pairs, and their collection is very labor-intensive.
Our challenge is to determine whether the accu-
racy of person re-identification can be improved when
there are no HR and LR training image pairs of the
same individual. Instead of a learning-based approach
that requires a large number of training samples, we
exploit a resampling approach. Our approach has the
advantage that it can be applied in cases where train-
ing samples consisting of pairs of HR and LR images
cannot be collected. There are two types of resam-
pling processes: upsampling to match the size of the
HR target images and downsampling to match the size
of the LR query images. We experimentally demon-
strated which process is more suitable for improv-
Nishiyama, M., Endo, T. and Iwai, Y.
Feature Extraction using Downsampling for Person Re-identification with Low-resolution Images.
DOI: 10.5220/0010815500003124
In Proceedings of the 17th International Joint Conference on Computer Vision, Imaging and Computer Graphics Theory and Applications (VISIGRAPP 2022) - Volume 5: VISAPP, pages
351-358
ISBN: 978-989-758-555-5; ISSN: 2184-4321
Copyright
c
2022 by SCITEPRESS – Science and Technology Publications, Lda. All rights reserved
351

ing person re-identification accuracy. We confirmed
that the downsampling process obtained significantly
higher person re-identification accuracy than the up-
sampling process. We also confirmed that the low-
frequency components corresponding to the output of
the downsampling process contain informative fea-
tures on the publicly available CUHK01 dataset.
2 RELATED WORK
We first review a survey paper (Wang et al., 2014) fo-
cusing on image resolution in the field of face recog-
nition, where the purpose is relevant to our paper. The
survey paper states that two approaches exist to deal
with face recognition problems caused by low resolu-
tion. In the first approach (Shi and Jain, 2019), a fea-
ture space that is less affected by resolution variation
is designed, and the recognition process is performed
in that feature space. In the second approach (Zou and
Yuen, 2011), LR images are converted to HR images,
and the recognition process is performed in an HR
feature space. In especial, some researchers (Agh-
dam et al., 2019; Hennings-Yeomans et al., 2008) dis-
cussed the suitable resolutions for face recognition.
However, these related studies did not treat the case
of person re-identification. Recently, several existing
methods employing the first and second approaches
have also been proposed for person re-identification.
Using the first approach, the existing meth-
ods (Jing et al., 2015; Wang et al., 2016) have been
proposed to design a feature space that is less sensitive
to resolution variation for person re-identification.
They exploit learning-based methods to design fea-
ture spaces that are not easily affected by resolution
variations using deep-learning or machine-learning
techniques with pairs of HR and LR images of the
same person. Using the second approach for per-
son re-identification, the existing methods (Zheng
et al., 2018; Jiao et al., 2018) have been proposed.
To convert LR images to HR images, they exploit
super-resolution techniques, which incorporate deep-
learning models trained from the same person’s reso-
lution image pairs.
In both approaches, if we prepare a large num-
ber of training samples of resolution image pairs,
we can expect to increase the accuracy of the per-
son re-identification substantially. However, collect-
ing a large number of training samples of resolution
image pairs is very laborious and costly. In this pa-
per, we aim to improve the accuracy using a resam-
pling approach in which only preprocessing is applied
to pedestrian images instead of a learning-based ap-
proach in which training samples are required.
3 EFFECT OF IMAGE
DOWNSAMPLING
3.1 Image Resampling Methods
The resolution of pedestrian images in person re-
identification systems varies in both the query sam-
ples and target samples. To simplify the problem
setup, we assume that HR pedestrian images are given
to target samples and LR pedestrian images are given
to query samples. Under this assumption, we eval-
uate whether the pedestrians in the query and target
samples are identical or not. We compare person
re-identification accuracy using the following two re-
sampling processes:
• C
d
: We perform downsampling on the HR target
images to match the size of the LR query images.
Then, we identify the original LR query images
using the downsampled HR target images.
• C
u
: We perform upsampling on the LR query im-
ages to match the size of the HR target images.
Then, we identify the upsampled LR query im-
ages using the original HR target images.
We use bilinear interpolation for C
d
and a super-
resolution convolutional neural network (SR-
CNN) (Dong et al., 2015) for C
u
.
3.2 Factors Reducing the Resolution of
Pedestrian Images
To evaluate the person re-identification accuracy us-
ing the resampling process, it is necessary to collect
a dataset of pedestrian images consisting of query
and target samples. To determine a dataset collection
strategy, we considered the factors that cause a de-
crease in resolution in various camera settings. Typ-
ical factors are represented by the parameter changes
in the camera lens and camera positions. Each factor
is described in detail below.
We consider the influence of the camera lens on
the resolution. The performance of camera sensors
has improved remarkably in recent decades, and the
majority of camera sensors have a large number of
pixels. Thus, images acquired from cameras usually
have high resolution. However, a single surveillance
camera covers a wide field of view, and the resolution
of an image of an individual pedestrian is often low.
Furthermore, the resolution of the pedestrian image
decreases when the focal length of the camera lens
is small, even if the number of pixels of the camera
sensor is large. For example, the resolution becomes
low when a wide-angle lens with a short focal length
is attached.
VISAPP 2022 - 17th International Conference on Computer Vision Theory and Applications
352
Next, we consider the influence of the camera po-
sition on resolution. The position of a camera varies
depending on the purpose of the surveillance systems.
For example, to monitor a specific point, such as the
door to a train, the cameras are placed close to pas-
sengers who are entering the train. To monitor a large
space, such as an airport lobby, the cameras are placed
so that they have a wide view that is far away from
people. Assuming that the camera lenses are identi-
cal, the resolution is high when the distance between
the camera and the person is small. In contrast, the
resolution is low when this distance is large.
In the following, we describe two sets for evalu-
ating person re-identification accuracy: one in which
the focal length of the camera lens changes and an-
other in which the distance between the person and
camera changes.
3.3 Data Collection of LR Pedestrian
Images
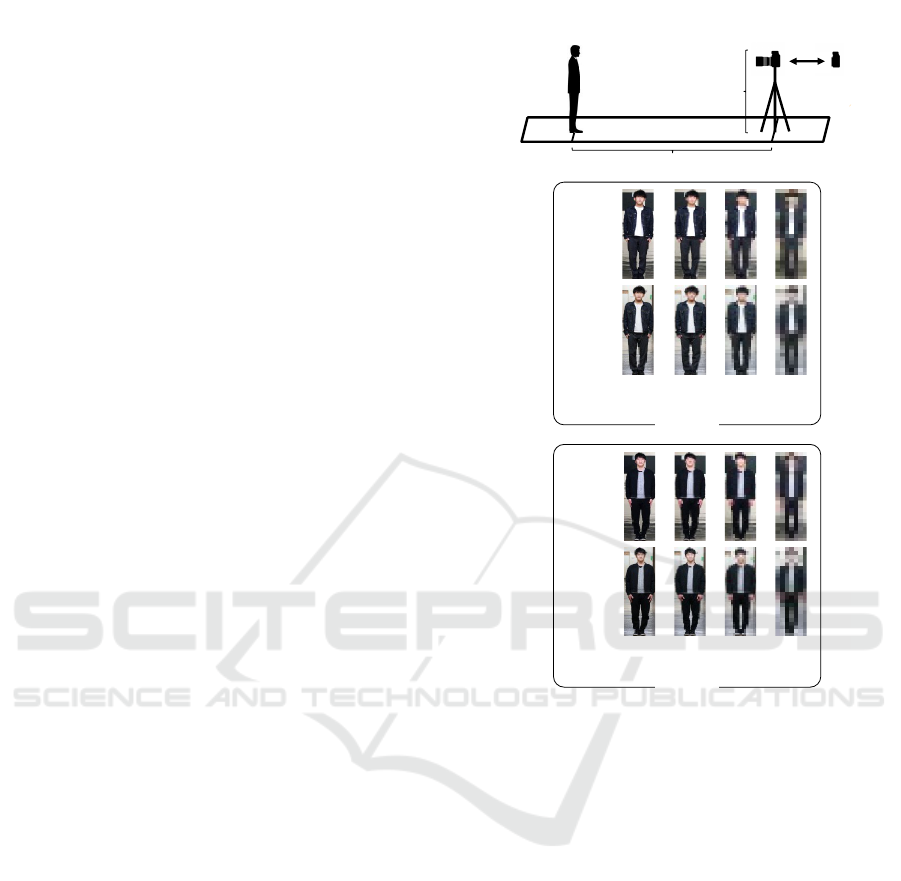
3.3.1 Focal Length Change Dataset
Figure 1 shows the camera setting used when the
focal length of the camera lens was changed. We
set the focal length to 135 mm, 70 mm, 35 mm,
and 18 mm and acquired query pedestrian images for
each setting. The average sizes of the pedestrian im-
ages were (58.3, 186.3), (31.3, 100.5), (15.4, 49.5),
and (7.2, 24.2) pixels, respectively. We used a fo-
cal length of 135 mm, to acquire the target pedes-
trian images at a different time. The camera (Sony
α6300 with E 18-135mm F3.5-5.6 OSS) was placed
at a height of 167.3 cm above the floor. The distance
from the person to the camera was fixed at 15 m. The
images were acquired at five different indoor loca-
tions unaffected by ambient light. Twenty subjects
(17 men and three women) participated.
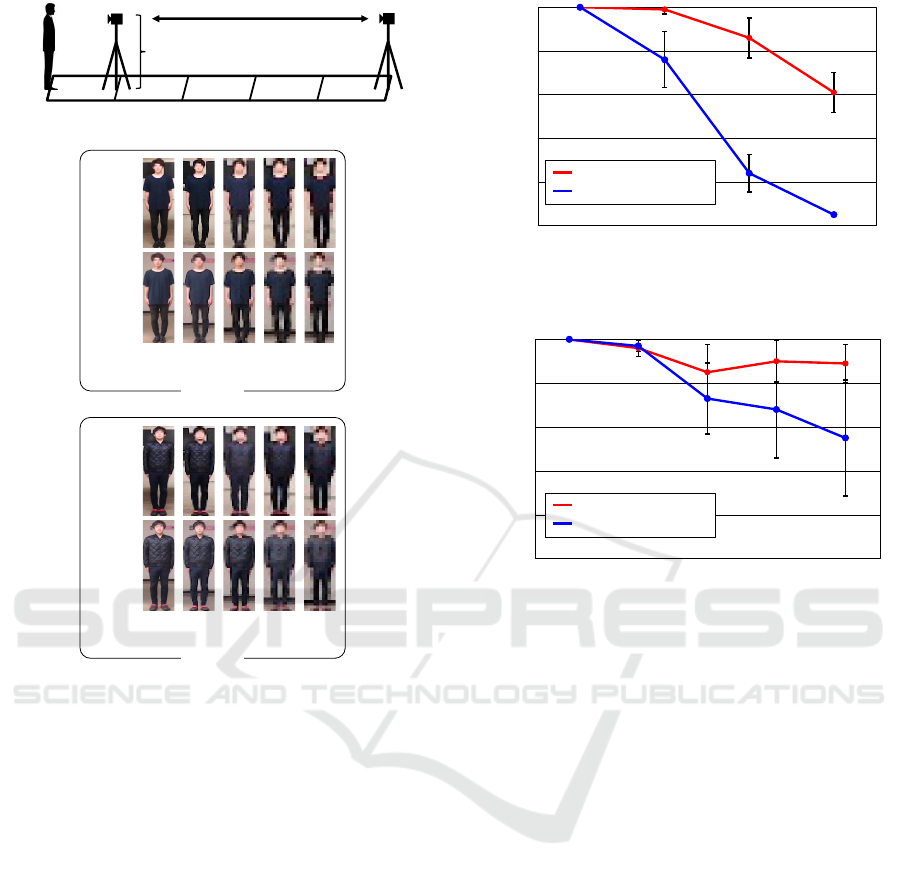
3.3.2 Distance Change Dataset
Figure 2 shows the camera setting used when the dis-
tance from the camera to the person was changed.
We set the distance to 5 m, 10 m, 15 m, 20 m, and
25 m and again acquired the query pedestrian images
for each setting. The average sizes of the pedestrian
images were (59.2, 192.9), (29.2, 94.7), (19.6, 62.4),
(14.3, 46.7), and (11.7, 37.1) pixels, respectively. We
used a distance of 5 m to acquire the target pedestrian
images at a different time. The camera (Logicool HD
Pro Webcam C920r) was placed at a height of 167.3
cm above the floor. To keep the lighting on the per-
son constant, we fixed the person’s standing position
and moved the camera position. The images were ac-
167.3 cm
135 mm – 18 mm
15 m
135 mm 70 mm 18 mm35 mm
Location
1
Location
2
135 mm 70 mm 18 mm35 mm
Focal length:
Height:
Distance:
Location
1
Location
2
Person 1
Person 2
Focal length
Focal length
Figure 1: Camera setting when the focal length of the cam-
era lens is changed.
quired at five different indoor locations. Twenty sub-
jects (17 men and three women) participated.
3.4 Accuracy of Person
Re-identification
We performed the downsampling C
d
and upsampling
C
u
described in Section 3.1 to pedestrian images
as preprocessing before feature extraction. We ex-
tracted features using co-occurrence attributes pro-
posed by (Nishiyama et al., 2016). Co-occurrence
attributes are represented by combinations of phys-
ical and adhered human characteristics (e.g., a man
wearing a suit, a 20-something woman, or a woman
with long hair who is wearing a skirt). To increase the
accuracy, we applied the large margin nearest neigh-
bor (LMNN) (Weinberger and Saul, 2009), which is
a kind of metric learning technique. We used the
CUHK01 dataset (Li et al., 2012) as training sam-
ples only for the metric learning. We applied the
Feature Extraction using Downsampling for Person Re-identification with Low-resolution Images
353
167.3 cm
5 m 10 m 25 m20 m15 m0 m
5 m 10 m 25 m20 m15 m
Location
1
Location
2
5 m 10 m 25 m20 m15 m
Height:
Distance:
Person 1
Person 2
Location
1
Location
2
Distance
Distance
Figure 2: Camera setting when the camera–person distance
is changed.
nearest neighbor approach using Euclidean distance
to compute distances between the query and target
features. We used the first matching rate (Rank-1),
which measures a correct hit between the person in
the query sample and one of the target samples. We
computed the average and the standard deviation of
first matching rate from the five locations included in
each dataset.
We evaluated the person re-identification accuracy
on the dataset with varying camera lens focal lengths.
Figure 3 shows the average and the standard devia-
tion of first matching rate of person re-identification
when C
d
and C
u
were applied in the focal length
dataset. We see that C
d
, which downsamples to the
size of the LR query samples, improves the person
re-identification accuracy better than C
u
, which up-
samples to the size of the HR target samples.
Next, we evaluated the person re-identification ac-
curacy on the dataset with varying distances from the
person to the camera. The experimental conditions
were the same as those in the above evaluation ex-
cept for the dataset. Figure 4 shows the average and
135
70
35
18
Focal length of the camera lens (mm)
60
100
80
40
0
20
Accuracy (%)
C
𝑑
(Downsampling)
C
𝑢
(Upsampling)
Figure 3: Accuracy of person re-identification when chang-
ing the focal length of the camera lens.
60
100
80
40
0
20
10 15 20 255
Distance from the camera to the person (m)
Accuracy (%)
C
𝑑
(Downsampling)
C
𝑢
(Upsampling)
Figure 4: Accuracy of person re-identification when chang-
ing the camera–person distance.
the standard deviation of first matching rate of person
re-identification when C
d
and C
u
were applied in the
distance change dataset. Similar to the above results,
we see that downsampling C
d
obtains better accuracy
than C
u
.
We believe that downsampling C
d
is more suit-
able as a preprocessing technique for person re-
identification than upsampling C
u
in both the datasets,
where the resolution is reduced by the focal length of
the camera lens and the distance from the camera to
the person.
4 ANALYSIS OF
DOWNSAMPLING ON PERSON
RE-IDENTIFICATION
4.1 Overview
The downsampling process improves the person re-
identification accuracy more than the upsampling pro-
cess, as described in Section 3.4. Here, we use
spatial frequency analysis to further investigate why
the downsampling process increases the accuracy.
VISAPP 2022 - 17th International Conference on Computer Vision Theory and Applications
354
𝒇
!
"
𝒇
#
"
𝒈
!
"↑
𝒈
#
"↑
SRCNN
Original
images
𝒇
"
𝒈
"↑
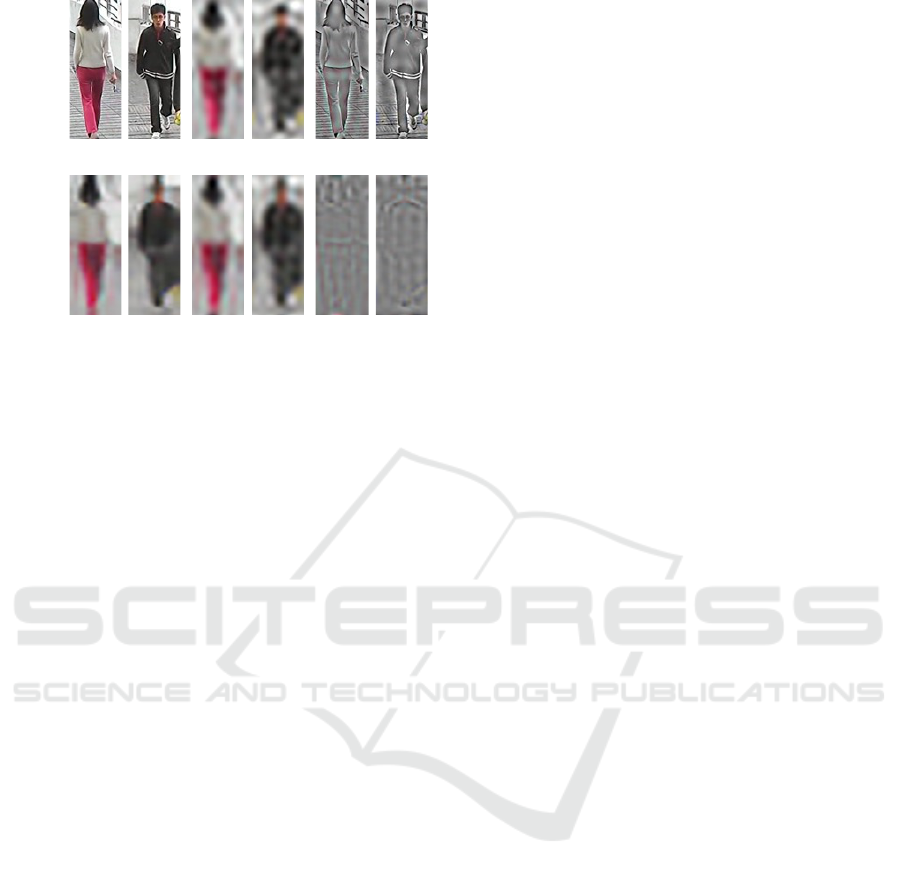
Figure 5: Visualization of pedestrian images consisting
of high-frequency and low-frequency components on the
CUHK01 dataset.
We assume that an HR image can be separated into
low-frequency components and high-frequency com-
ponents. In particular, we consider that the low-
frequency components of an HR image correspond
to an LR image. In this experiment, we investigate
how person re-identification accuracy varies when us-
ing the following three images:
F
a
: Images containing all frequency components.
F
l
: Images containing low-frequency components.
F
h
: Images containing high-frequency components.
We use pseudo HR images upsampled from LR im-
ages with the SRCNN as the query samples. The
target samples are the original HR images. We con-
sider that F
a
corresponds to C
u
with upsampling in
Section 3.1, and F
l
corresponds to C
d
with downsam-
pling.
4.2 Experimental Conditions
We performed image degradation simulations using
a model where HR pedestrian images were used to
create various LR images. This model synthesized the
LR query samples g
g
g
q
using the following equation:
g
g
g
q
= BH f
f
f
q
+ n
n
n (1)
where B is the downsampling process, H is the blur
process, f
f
f
q
is the original HR query samples, and n
n
n is
noise. We assumed that B and H are shift-invariant.
Specifically, B represents bilinear interpolation, H
Gaussian blur, and n
n
n white Gaussian noise.
We used the CUHK01 dataset (Li et al., 2012),
consisting of 971 pedestrians. We assigned pedes-
trian images acquired at different times to the query
and target. We evaluated 971 query samples and 971
target samples. The size of all pedestrian images was
normalized to (60, 160) pixels. To generate the LR
query samples g
g
g
q
using Eq. (1), we set the image sizes
to (30, 80), (24, 64), (18, 48), (12, 32), and (6, 16)
pixels. We also generated upsampled LR query sam-
ples g
g
g
q↑
with a size of (60, 160) pixels from g
g
g
q
us-
ing the SRCNN. The size of the target samples was
(60, 160) pixels.
We separated g
g
g
q↑
into high-frequency and low-
frequency components in the frequency domain using
a discrete Fourier transform. Then, each component
was transformed into an image in the spatial domain
using an inverse discrete Fourier transform. We set
the boundary between the low-frequency and high-
frequency components to match the resolution of each
pedestrian image. We created images g
g
g
q↑
h
containing
only high-frequency components computed from g
g
g
q↑
and images g
g
g
q↑
l
containing only low-frequency com-
ponents. We also created images f
f
f
q
h
containing only
high-frequency components of the original HR im-
age f
f
f
q
and images f
f
f
q
l
containing only low-frequency
components.
Figure 5 shows a visualization of the high-
frequency and low-frequency component images. We
used a size of f
f
f
q
and g
g
g
q↑
with (60, 160) pixels. Image
g
g
g
q↑
was upsampled from g
g
g
q
with (6, 16) pixels. We
mapped the range of pixel values from [−128, 128] to
[0, 255] to visualize high-frequency components be-
cause the high-frequency components can take posi-
tive or negative values. When we focus on the high-
frequency components, we see that the edges of the
face and the pattern of the clothing occur in the high-
frequency components f
f
f
q
h
of the original images. In
contrast, some weak edges occur around the pedes-
trian’s contour in the high-frequency images g
g
g
q↑
h
up-
sampled using the SRCNN. We also see that the ap-
pearances of the pedestrians are similar in the low-
frequency image f
f
f
q
l
computed from the original im-
age and the low-frequency image g
g
g
q↑
l
computed from
g
g
g
q↑
upsampled using the SRCNN.
4.3 Accuracy of Person
Re-identification on the CUHK01
Dataset
To perform person re-identification, we used the fol-
lowing methods:
• CA: LMNN with the co-occurrence attributes de-
scribed in (Nishiyama et al., 2016) (We explained
the CA method in Section 3.4).
• SL: CNN with softmax cross entropy loss with
label smoothing regularizer described in (Szegedy
Feature Extraction using Downsampling for Person Re-identification with Low-resolution Images
355
et al., 2016; Szegedy et al., 2016).
• TL: CNN with triplet loss described in (Hermans
et al., 2017).
• OS: Omni-Scale Network (OSNet) described
in (Zhou et al., 2019).
We used 486 randomly selected pedestrians for train-
ing the LMNN metric matrix of the CA method from
the CUHK01 dataset. The remaining 485 pedestrians
in this dataset were used for the query and target sam-
ples of the CA method. We used the same pedestrian
images employed in the CA method for the query and
target samples of the the SL, TL, and OS methods.
The backbone network of the SL and TL methods was
ResNet50 (He et al., 2016). We used the Torchreid
implementation (Zhou and Xiang, 2019) with train-
ing samples of the Market-1501 dataset (Zheng et al.,
2015) for the SL, TL, and OS methods.
Table 1 shows the person re-identification accu-
racy using the CA, SL, TL, and OS methods on the
CUHK01 dataset. We see that F
l
with low-frequency
component images g
g
g
q↑
l
is superior to F
a
with g
g
g
q↑
and
F
h
with g
g
g
q↑
h
for all the methods. In the case of F
h
with
only high-frequency component images, no accuracy
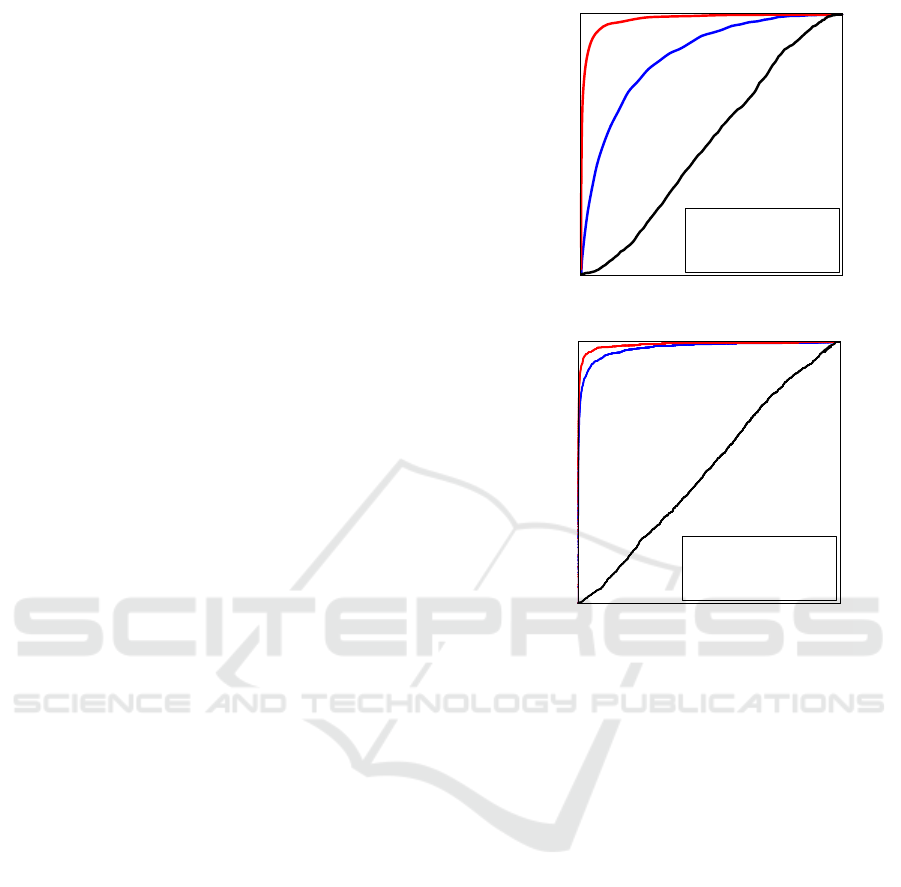
could be obtained at all. Figure 6 shows the receiver
operating characteristic (ROC) curves when using the
F
a
, F
l
, and F
h
conditions with the CA and OS meth-
ods. We used g
g
g
q↑
upsampled from g
g
g
q
with (18, 48)
pixels. We see that F
l
is superior to F
a
and F
h
accord-
ing to the ROC curves for both the CA and OS meth-
ods. We believe that the low-frequency components
corresponding to the output of the downsampling pro-
cess yields promising results regardless of the design
of the person re-identification method.
Furthermore, we also checked the performance of
the downsampling C
d
with bilinear interpolation and
upsampling C
u
with SRCNN, as described in Sec-
tion 3.1. We used g
g
g
q
in C
d
and g
g
g
q↑
in C
u
. In the
case of the CA method, the accuracy of C
d
were
76.2% with (30, 80) pixels, 75.1% with (24, 64) pix-
els, 74.5% with (18, 48) pixels, 70.4% with (12, 32)
pixels, and 56.6% with (6, 16) pixels. Those of C
u
were 70.9%, 70.4%, 11.9%, 2.6%, and 0.5%, re-
spectively. Next, in the case of the OS method,
the accuracy of C
d
were 93.5% with (30, 80) pix-
els, 89.7% with (24, 64) pixels, 72.6% with (18, 48)
pixels, 34.0% with (12, 32) pixels, and 25.7% with
(6, 16) pixels. Those of C
u
were 78.7%, 76.8%,
69.7%, 52.3%, and 19.0%, respectively. We con-
firmed that downsampling C
d
obtains significantly
better accuracy than upsampling C
u
on the CUHK01
dataset. We believe the effectiveness of downsam-
pling appears in this experiment as well as in the re-
sults in Section 3.4.
True positive rate
False positive rate
1
0
0
1
━ F
!
(AUC = 0.978)
━ F
"
(AUC = 0.991)
━ F
#
(AUC = 0.513)
(b) OS
True positive rate
1
False positive rate
0
1
━
F
!
(AUC = 0.843)
━
F
"
(AUC = 0.982)
━
"F
#
(AUC = 0.507)
(a) CA
0
True positive rate
False positive rate
1
0
0
1
━ F
!
(AUC = 0.978)
━ F
"
(AUC = 0.991)
━ F
#
(AUC = 0.513)
(b) OS
True positive rate
1
False positive rate
0
1
━
F
!
(AUC = 0.843)
━
F
"
(AUC = 0.982)
━
"F
#
(AUC = 0.507)
(a) CA
0
Figure 6: ROC curves when using the F
a
, F
l
, and F
h
condi-
tions on the CUHK01 dataset. We checked the area under
the curve (AUC).
4.4 Evaluation of Different
Super-resolution Techniques
We evaluated the person re-identification accu-
racy using existing super-resolution techniques SR-
CNN (Dong et al., 2015), ESRGAN (Wang et al.,
2018), and USRNet (Zhang et al., 2020) as upsam-
pling processes. We also evaluated it using basic bi-
linear and bicubic interpolation techniques. The ex-
perimental conditions are the same as those described
in Section 4.3 except for the upsampling techniques.
To perform person re-identification, we used the OS
method. Table 2 shows the person re-identification
accuracy when using the bilinear, bicubic, SRCNN,
ESRGAN, and USRNet techniques. We see that
F
l
obtained a higher accuracy than F
a
and F
h
re-
gardless of which image interpolation technique was
used. We believe that informative features for person
re-identification are contained in the low-frequency
components. Since F
l
provides the same effect as
C
d
, we again confirmed the downsampling process
obtains better accuracy than the upsampling process,
VISAPP 2022 - 17th International Conference on Computer Vision Theory and Applications
356

Table 1: Comparison of the accuracy of the F
a
, F
l
, and F
h
methods when using the person re-identification methods CA, SL,
TL, and OS on the CUHK01 dataset.
Image size Feature Accuracy (%)
of g
g
g
q
F
a
with g
g
g
q↑
F
l
with g
g
g
q↑
l
F
h
with g
g
g
q↑
h
(30, 80)
CA 70.9 ± 1.7 73.3 ± 0.4 0.2 ± 0.0
SL 62.8 ± 1.0 65.2 ± 0.7 0.2 ± 0.0
TL 49.6 ± 1.9 52.3 ± 1.4 0.3± 0.1
OS 78.8 ± 1.0 88.2 ± 0.4 0.2 ± 0.1
(24, 64)
CA 70.4 ± 1.2 73.7 ± 0.3 0.2 ± 0.0
SL 61.4 ± 0.7 64.3 ± 1.9 0.1 ± 0.1
TL 48.0 ± 2.6 54.1 ± 1.6 0.2 ± 0.0
OS 77.4 ± 1.5 87.7 ± 0.3 0.2 ± 0.0
(18, 48)
CA 11.9 ± 1.2 74.0 ± 0.6 0.2 ± 0.0
SL 53.7 ± 0.5 56.3 ± 0.9 0.4 ± 0.1
TL 44.1 ± 1.9 57.1 ± 0.8 0.2 ± 0.0
OS 71.3 ± 2.1 83.3 ± 0.6 0.3 ± 0.0
(12, 32)
CA 2.6 ± 0.4 74.0 ± 0.7 0.2 ± 0.0
SL 41.0 ± 0.7 50.9 ± 1.9 0.2 ± 0.0
TL 37.2 ± 1.5 60.3 ± 1.0 0.2 ± 0.0
OS 53.1 ± 0.5 70.8 ± 0.9 0.2 ± 0.0
(6, 16)
CA 0.6 ± 0.2 71.1 ± 0.6 0.2 ± 0.0
SL 17.5 ± 0.4 52.6 ± 1.3 0.4 ± 0.2
TL 26.8 ± 1.1 64.1 ± 0.8 0.3 ± 0.1
OS 19.3 ± 0.7 60.6 ± 1.5 0.3 ± 0.1
Table 2: Comparison of the accuracy of the F
a
, F
l
, and F
h
conditions using super-resolution techniques (SRCNN, ESRGAN,
and USRNet) and basic interpolation techniques (Bilinear and Bicubic) on the CUHK01 dataset.
Image size Interpolation Accuracy (%)
of g
g
g
q
a
technique F
a
with g
g
g
q↑
a
F
l
with g
g
g
q↑
l
F
h
with g
g
g
q↑
h
(30, 80)
Bilinear 76.8 ± 1.6 86.0 ± 0.9 0.2 ± 0.0
Bicubic 75.8 ± 1.6 85.6 ± 1.5 0.3 ± 0.1
SRCNN 78.8 ± 1.0 88.2 ± 0.4 0.2 ± 0.1
ESRGAN 78.1 ± 1.2 88.5 ± 0.6 0.4± 0.0
USRNet 77.5 ± 1.5 86.8 ± 1.3 0.3 ± 0.1
(24, 64)
Bilinear 70.4 ± 2.3 80.5 ± 0.8 0.2 ± 0.0
Bicubic 69.8 ± 2.6 82.4 ± 0.4 0.3 ± 0.1
SRCNN 77.4 ± 1.5 87.7 ± 0.3 0.2 ± 0.0
ESRGAN 75.9 ± 0.8 88.0 ± 0.3 0.1 ± 0.1
USRNet 73.7 ± 2.3 84.1 ± 0.0 0.3 ± 0.0
(18, 48)
Bilinear 53.2 ± 2.5 61.7 ± 1.2 0.2 ± 0.0
Bicubic 55.8 ± 1.6 69.1 ± 1.1 0.2 ± 0.0
SRCNN 71.3 ± 2.1 83.3 ± 0.6 0.3 ± 0.0
ESRGAN 69.3 ± 0.4 85.9 ± 0.7 0.5 ± 0.1
USRNet 59.4 ± 1.1 71.9 ± 0.1 0.2 ± 0.0
(12, 32)
Bilinear 29.4 ± 1.6 33.1 ± 1.5 0.2 ± 0.0
Bicubic 31.0 ± 1.6 42.3 ± 1.7 0.2 ± 0.0
SRCNN 53.1 ± 0.5 70.8 ± 0.9 0.2 ± 0.0
ESRGAN 62.7 ± 1.1 81.1± 0.2 1.3 ± 0.2
USRNet 32.5 ± 0.2 45.5 ± 1.0 0.2 ± 0.0
(6, 16)
Bilinear 7.6 ± 0.1 18.2 ± 0.5 0.2 ± 0.0
Bicubic 8.1 ± 1.2 27.8 ± 0.3 0.2 ± 0.0
SRCNN 19.3 ± 0.7 60.6 ± 1.5 0.3 ± 0.1
ESRGAN 36.8 ± 1.8 57.6 ± 1.2 1.3 ± 0.2
USRNet 7.8 ± 0.7 30.8 ± 1.4 0.3 ± 0.1
even when using super-resolution techniques and ba-
sic interpolation techniques.
5 CONCLUSIONS
We investigated whether the downsampling process,
which does not require training samples of HR and
LR image pairs, obtains better person re-identification
accuracy than upsampling. We collected datasets in
two camera settings to evaluate the influence of res-
olution variations by changing the focal length of the
camera lens and the distance from the camera to the
person. The experimental results show that down-
sampling to match the size of LR images contributes
significantly to obtaining high person re-identification
Feature Extraction using Downsampling for Person Re-identification with Low-resolution Images
357

accuracy, in contrast to upsampling to match the
size of HR images. We also compared the accuracy
when using high-frequency and low-frequency com-
ponents extracted from the upsampled LR images in
simulation experiments. We confirmed that the low-
frequency components, which correspond to down-
sampled images, are likely to contain many informa-
tive features.
In future work, we intend to develop a re-
sampling method for further increasing person re-
identification accuracy and expand the evaluation
on various datasets containing person appearances
changes. We also need to analyze the relevance of
our findings to the image generation process, such as
optical systems in real environments.
REFERENCES
Aghdam, O. A., Bozorgtabar, B., Ekenel, H. K., and Thi-
ran, J. (2019). Exploring factors for improving low
resolution face recognition. In Proceedings of the
IEEE/CVF Conference on Computer Vision and Pat-
tern Recognition Workshops, pages 2363–2370.
Dong, C., Loy, C. C., He, K., and Tang, X. (2015). Image
super-resolution using deep convolutional networks.
IEEE Transactions on Pattern Analysis and Machine
Intelligence, 38(2):295–307.
He, K., Zhang, X., Ren, S., and Sun, J. (2016). Deep resid-
ual learning for image recognition. In Proceedings of
the IEEE Conference on Computer Vision and Pattern
Recognition, pages 770–778.
Hennings-Yeomans, P. H., Baker, S., and Kumar, B. V. K. V.
(2008). Simultaneous super-resolution and feature ex-
traction for recognition of low-resolution faces. In
2008 IEEE Conference on Computer Vision and Pat-
tern Recognition, pages 1–8.
Hermans, A., Beyer, L., and Leibe, B. (2017). In defense
of the triplet loss for person re-identification. CoRR,
abs/1703.07737.
Jiao, J., Zheng, W. S., Wu, A., Zhu, X., and Gong, S. (2018).
Deep low-resolution person re-identification. In Pro-
ceedings of the Thirty-second Association for the Ad-
vancement of Artificial Intelligence Conference on Ar-
tificial Intelligence.
Jing, X. Y., Zhu, X., Wu, F., You, X., Liu, Q., Yue, D.,
Hu, R., and Xu, B. (2015). Super-resolution person
re-identification with semi-coupled low-rank discrim-
inant dictionary learning. In Proceedings of the IEEE
Conference on Computer Vision and Pattern Recogni-
tion, pages 695–704.
Li, W., Zhao, R., and Wang, X. (2012). Human re-
identification with transferred metric learning. In Pro-
ceedings of the Asian Conference on Computer Vision,
pages 31–44.
Nishiyama, M., Nakano, S., Yotsumoto, T., Yoshimura,
H., Iwai, Y., and Sugahara, K. (2016). Person re-
identification using co-occurrence attributes of physi-
cal and adhered human characteristics. In Proceedings
of the International Conference on Pattern Recogni-
tion, pages 2085–2090.
Shi, Y. and Jain, A. K. (2019). Probabilistic face embed-
dings. In Proceedings of the IEEE International Con-
ference on Computer Vision, pages 6902–6911.
Szegedy, C., Vanhoucke, V., Ioffe, S., Shlens, J., and Wo-
jna, Z. (2016). Rethinking the inception architecture
for computer vision. In Proceedings of the IEEE Con-
ference on Computer Vision and Pattern Recognition,
pages 2818–2826.
Szegedy, C., Vanhoucke, V., Ioffe, S., Shlens, J., and Wo-
jna, Z. (2016). Rethinking the inception architecture
for computer vision. In Proceedings of the IEEE Con-
ference on Computer Vision and Pattern Recognition,
pages 2818–2826.
Wang, X., Yu, K., Wu, S., Gu, J., Liu, Y., Dong, C., Qiao,
Y., and Loy, C. C. (2018). Esrgan: Enhanced super-
resolution generative adversarial networks. In Pro-
ceedings of the European Conference on Computer
Vision Workshops, pages 63–79.
Wang, Z., Hu, R., Yu, Y., Jiang, J., Liang, C., and Wang,
J. (2016). Scale-adaptive low-resolution person re-
identification via learning a discriminating surface. In
Proceedings of the International Joint Conferences on
Artificial Intelligence, volume 2, page 6.
Wang, Z., Miao, Z., Wu, Q. M. J., Wan, Y., and Tang, Z.
(2014). Low-resolution face recognition: a review.
The Visual Computer, 30(4):359–386.
Weinberger, K. Q. and Saul, L. K. (2009). Distance met-
ric learning for large margin nearest neighbor clas-
sification. Journal of Machine Learning Research,
10(Feb):207–244.
Zhang, K., Gool, L. V., and Timofte, R. (2020). Deep un-
folding network for image super-resolution. In Pro-
ceedings of the IEEE Conference on Computer Vision
and Pattern Recognition, pages 3217–3226.
Zheng, L., Shen, L., Tian, L., Wang, S., Wang, J., and Tian,
Q. (2015). Scalable person re-identification: A bench-
mark. In Proceedings of the IEEE International Con-
ference on Computer Vision, pages 1116–1124.
Zheng, W., Mang, Y., Fan, Y., Xiang, B., and Shin’ichi,
S. (2018). Cascaded sr-gan for scale-adaptive low
resolution person re-identification. In Proceedings of
the International Joint Conference on Artificial Intel-
ligence, pages 3891–3897.
Zhong, Z., Zheng, L., Cao, D., and Li, S. (2017). Re-
ranking person re-identification with k-reciprocal en-
coding. In Proceedings of the IEEE Conference
on Computer Vision and Pattern Recognition, pages
3652–3661.
Zhou, K. and Xiang, T. (2019). Torchreid: A library
for deep learning person re-identification in pytorch.
CoRR, abs/1910.10093.
Zhou, K., Yang, Y., Cavallaro, A., and Xiang, T.
(2019). Omni-scale feature learning for person re-
identification. In Proceedings of the IEEE/CVF In-
ternational Conference on Computer Vision, pages
3701–3711.
Zou, W. W. W. and Yuen, P. C. (2011). Very low resolu-
tion face recognition problem. IEEE Transactions on
Image Processing, 21(1):327–340.
VISAPP 2022 - 17th International Conference on Computer Vision Theory and Applications
358
