
Visual Analysis of Deep Learning Methods for Industrial Vacuum
Metalized Film Product
Thiago Moura da Rocha Bastos
1 a
, Luiz Stragevitch
2 b
and Cleber Zanchettin
1 c
1
Center of Informatics, Universidade Federal de Pernambuco,
Av. Prof. Moraes Rego, Cidade Universit
´
aria, Recife - PE, Brazil
2
Department of Chemical Engineering, Universidade Federal de Pernambuco,
Av. Prof. Moraes Rego, Cidade Universit
´
aria, Recife - PE, Brazil
Keywords:
Visualization, Clustering Analysis, Feature Extraction, Quality Analysis.
Abstract:
Extract information to support decisions in a complex environment as the industrial is not an easy task. In-
formation technologies and cyber-physical systems have provided technical possibilities to extract, store, and
process many data. In parallel, the recent advances in artificial intelligence permit the prediction and evalu-
ation of features and information. Industry 4.0 can benefit from these approaches, allowing the visualization
of process, feature prediction, and model interpretation. We evaluate the use of Machine Learning (ML) to
support monitoring and quality prediction of an industrial vacuum metalization process. Therefore, we pro-
posed a semantic segmentation approach to fault identification using images composed of optical density (OD)
values from the vacuum metalized film process. Besides that, a deep neural network model is applied to prod-
uct classification using the segmented OD profile. The semantic segmentation allowed film regions analysis
and coating quality associations through their class and format. The proposed classifier presented 86.67% of
accuracy. The use of visualization and ML approaches permits systematical real-time process monitoring that
reduces time and material waste. Consequently, it is a promising approach for Industry 4.0 on monitoring and
maintenance support.
1 INTRODUCTION
The consistent growth of available data on manu-
facturing industries and the necessity for production
and monitoring improvements promoted a fast de-
velopment of complex systems and sensor technolo-
gies, as data-driven fault detection, diagnosis, and
soft-sensors (Fan and Wang, 2014). These tools al-
low to obtain data information from production lines,
environmental variables, machine parameters (Wuest
et al., 2016), and possibilities the use of Machine
Learning (ML) algorithms to extract knowledge and
make predictions (Fan and Wang, 2014). Further-
more, the applications of ML algorithms can support
surpass current difficulties on vacuum metalization
process as elevated lead-time for quality analysis and
limited inspection of the manufactured products.
Otherwise, large amounts of information in ML
models make process comprehension an arduous task.
a
https://orcid.org/0000-0001-8360-9396
b
https://orcid.org/0000-0002-8803-5106
c
https://orcid.org/0000-0001-6421-9747
Recent visual applications have tried to solve this is-
sue by combining information technology and human
intelligence to obtain insights from the data and sup-
port decisions under critical scenarios. Some exam-
ples for production planning (Wu et al., 2018), simu-
lation (Dutta et al., 2018), production monitoring (Xu
et al., 2017) and testing (Pajer et al., 2017) used the
association between ML and visualization tools to im-
prove industrial activities. So, we explored visualiza-
tion techniques for algorithm and product variables
interpretation to facilitate the use and comprehension
of analysts and process engineers.
Attempting to explore ML potential and construct
understandable models for a vacuum metalization
process, this work proposes applying ML visual tools
for interpretability and product classification through
physical-properties images, reducing laboratory in-
spection and promoting production-time analysis.
The framework initiates with film density col-
lected by 26 sensors. These values are processed and
further targeted with quality classification from labo-
ratory analysis. Then, we used the density film pro-
380
Bastos, T., Stragevitch, L. and Zanchettin, C.
Visual Analysis of Deep Learning Methods for Industrial Vacuum Metalized Film Product.
DOI: 10.5220/0010815400003124
In Proceedings of the 17th International Joint Conference on Computer Vision, Imaging and Computer Graphics Theory and Applications (VISIGRAPP 2022) - Volume 4: VISAPP, pages
380-386
ISBN: 978-989-758-555-5; ISSN: 2184-4321
Copyright
c
2022 by SCITEPRESS – Science and Technology Publications, Lda. All rights reserved

file for semantic segmentation, and after, both objects
segmented and not segmented are used to train and
validate a deep learning classifier. Besides the accu-
racy metric, we evaluate the output layers to observe
sparsity and information taken from the ML model
(Fig. 1). Consequently, this work presents the follow-
ing contributions:
• Use systematic visual information through ML al-
gorithms instead of small film samples of products
information from laboratory analysis.
• Predict product classification, reducing the
standby time that the physical tests require.
• Indicate inferior quality products for film inspec-
tion in production time.
• Visualize coating quality in production time, sup-
porting process monitoring and maintenance for
the industrial vacuum metallization process.
Figure 1: Illustration of the computational pipeline for in-
dustrial vacuum metallized film, the equipment light sen-
sors measure the optical density (OD) values to represent
features. a) We applied a semantic segmentation model to
the OD object profile. b) Profile regions are associated by
color to observe patterns and possible faults. c) We used a
deep Neural Network (NN) in both profiles, the segmented
and the not segmented one, to predict the film classification
(as approved or disapproved). d) We evaluate the NN out-
put layers to interpret the model prediction and information
sparsity.
2 RELATED WORK
2.1 Physical Information for Industrial
Process Monitoring
This work uses industrial machine data of a vacuum
metallization process. In this process, a film substrate,
or any oriented polymer as polypropylene (PP) and
polyethylene terephthalate (PET), is loaded in the ma-
chine in the form of a roll. It unwinds and is coated
by the aluminum evaporated on the substrate surface.
This coating process occurs through a transversely
disposed system composed of a ceramic boat heated
by resistances and an aluminum wire fed with a wire
conductor. During the coating process, the product
optical density - OD is measured for automated con-
trol actions. An in-depth description of the process
can be viewed in (Bishop, 2007; Perry and Lentz,
2009) and a process illustration in Fig. 2.
Figure 2: Vacuum Metallization process illustration. Where
the polymer film is fed and metallized through vacuum
metal deposition.
The coating quality can appear as a higher OD at
a constant deposition rate, in the same way, that an
improved surface provides a more continuous coating
at a lower coating density. The OD of the coating
usually represents the opacity of a thin metal coating
expressed as a logarithm to base ten (1) (Bishop and
Mount, 2016).
Opacity =
Incident light
Transmitted light
Transmittance (T ) =
Transmitted light
Incident light
Opacity =
1
T
OpticalDensity = log
10
Opacity = log
10
1
T
(1)
The coating opacity expresses the light, water va-
por, and gas barrier effects obtained by metal coat-
ing. For example, a package of potato chips with an
opaque thin metal coating with OD of 1.7 achieve 49
days of shelf life, instead of the three days necessary
to turn the chips rancid by light (I.F., 1993). Thus, it
demonstrates the utility of the coating and its moni-
toring by film OD.
2.1.1 Visual Information for Fault Identification
The coating process by vacuum metallization occurs
through boats heated by resistance, separated (0.1
m), and disposed transversely to the web orientation.
Then, the wire metal is fed on resistance-heated boats
by conductors and evaporated to be deposited on the
web (Bishop, 2011). Following the metal deposition,
we obtained OD values in a similar position and ori-
entation, which propitiates a positional and individual
evaluation of each evaporation local system rate, and
the coating quality describes OD values or fault iden-
tification, as pinholes, debris, and scratches (Bishop,
Visual Analysis of Deep Learning Methods for Industrial Vacuum Metalized Film Product
381

Figure 3: Deep Neural Network used to film class prediction obtained through sequential models from Keras API. We can ob-
serve two convolutional and max-pooling layers in the model that extract information, followed by the dropout regularization
to avoid over-fitting and, at last, a softmax activation function for final classification.
2011). So, it is intuitive to explore the potential ap-
plication of visual tools based on ML algorithms and
OD film profiles to locate and identify these defects
in the web profile.
2.1.2 Semantic Segmentation
Researches have shown a considerable potential of se-
mantic segmentation applications on detecting and lo-
calizing objects in images. Borovec et al. (Borovec
et al., 2017) proposed semantic segmentation to detect
and localize Drosophila egg chambers in microscopy
images. Lei et al. (Lei et al., 2020) applied deep learn-
ing and image processing to detect multiple objects on
images. Recent applications of deep Learning models
showed the capacity to detect and count plants and
extract patterns and compression of images (Akbari
et al., 2020). Thus, these applications demonstrate
the potential employment of semantic segmentation
algorithms for fault identification on film profile im-
ages and his description using the similar local and
global context of the OD values.
2.2 Product Quality Prediction and
Interpretation
The use of a data-driven system with statistical pro-
cess monitoring (SPM) and ML models has been
figured out as a significant research area over the
last two decades (Qin, 2012). The data-driven qual-
ity improvement provided by ML algorithms can
handle qualitative and quantitative variables in the
same framework and model batch processes and op-
timize operation profiles through multivariate analy-
sis (Kano and Nakagawa, 2008). ML algorithms’ ad-
vantages have pushed researchers on industrial qual-
ity monitoring processes, mainly using deep Learning
and ensembles algorithms.
2.2.1 Deep Neural Networks
Qin et al. point out as factual, kernel, or kernel-
ization methods to explore nonlinear latent relations,
as through neural networks (NN), besides, to retain
linear computational cost, turning these models also
been intensely studied for process monitoring (Qin
et al., 2020; Alcala and Qin, 2010).
Also, existing deep learning platforms provide
frameworks to construct distributed and parallel com-
puting on the graphing processing unit. This strategy
solves data struggling as speed restriction, typically
observed in modeling large-scale massive datasets as
industrial monitoring and quality prediction. For this
work, we used a convolutional neural network model
provided by Keras (Chollet et al., 2015) a Tensorflow
high-level application programming interface (Wong-
suphasawat et al., 2018).
We could determine the NN structure through ex-
perimentation with different multi-layer perceptrons
configurations, varying layers, neurons, and adjust-
ing dropout regularization. The Fig.3 shows the se-
quential NN model used to predict each film product’s
correspondent class analyzed using the Keras API’s
with inputs of 65x22 images of OD values, where
the rows represent length positions and the columns
represent the OD sensors. To extract image informa-
tion and make the final product classification, we use
two convolutional, max-pooling 2x2, and ReLU acti-
vation function layers with 3 and 8 neurons, respec-
tively. The sequence uses a dropout of 0.5 to reduce
the overfitting and a flattening with a dense layer of 1
neuron with a softmax activation function for the final
film classification.
2.2.2 Model Interpretation
Even though most image analysis methods need to
transform multivariate processes in raw forms that
cause performance and spatial information loss, im-
age data collection and processing advances have pro-
moted miscellaneous industrial process applications
research. Recent applications have demonstrated the
capacity to solve multilayered problems propitiating
a computational cost reduction and simplification on
features description and distribution (Liu et al., 2017).
VISAPP 2022 - 17th International Conference on Computer Vision Theory and Applications
382
Once semantic segmentation provides regions
contour and meaning, and the film quality depends
directly on the uniformity and the presence of dep-
recated areas, we can analyze if the use of OD pro-
file combined with the clustering mask and regions
contour can improve the classification analysis. Aca-
demic studies had explored pixel values as a resource
of fitness, sensitivity, and information (Bach et al.,
2015; Shrikumar et al., 2017). So this work also pro-
poses comparing NN layers outputs information when
using different training images, the original OD film
profile and the OD film profile with cluster mapping
and contour made by the semantic segmentation.
3 METHOD DESCRIPTION
In this work, we evaluate the vacuum metalization
process (Materials, 2016) of an international film
manufacturing from the TOPMET 2450 machine, us-
ing data from 26 light detectors (B1 - B26) for opti-
cal density (OD) measures, equally disposed on trans-
verse orientation to the web, more details in (Perry
and Lentz, 2009). It was collected OD values with
an interval of 2 min between each OD capture. Due
to the size product variability, the width varies be-
tween 2,5 - 4,5 m and length up to 87 km, it was used
padding to short objects up to 45 km and a crop for
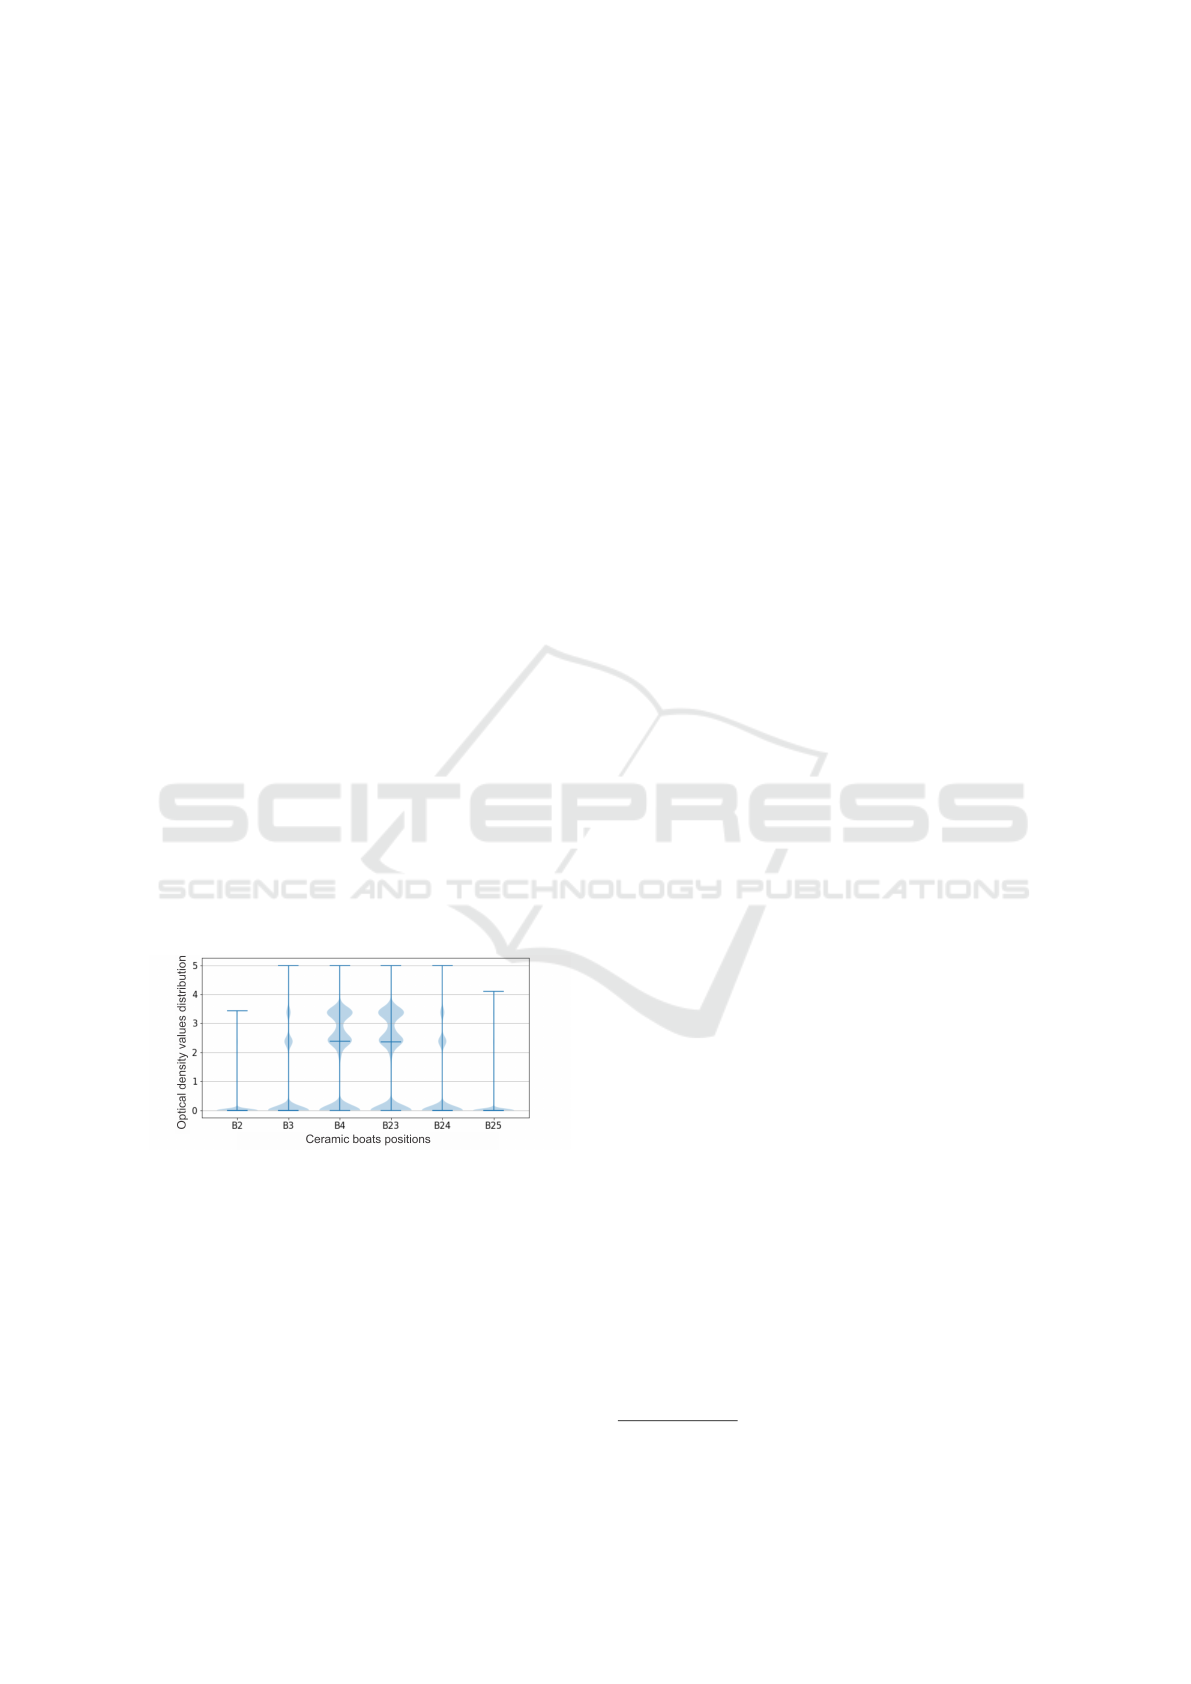
over this length. The width used was from B3 to B24
sensors positions due to the proportion of objects with
valid OD values upper than 75%, as shown in the Fig-
ure 4.
Figure 4: Optical density data set description for local coat-
ing systems with his values description according to the
position of the sensors. The optical density distribution
demonstrate that some positions presents a lack of valid val-
ues that should not be considered.
Over the 32.240 rows of data, we extracted 142
objects with the respective classification as approved
or not. For clustering, we used all of the 142 objects.
Otherwise, for class prediction, in the NN training,
we used an oversampling on the disapproved class,
turning 21 to 77 objects because of the class imbal-
ance. The lack of objects for this project was the dif-
ficulty of obtaining objects target class through infor-
mation crossing using experimental results obtained
in the laboratory and registered on the enterprise sys-
tem.
Initially, we process the data using TensorFlow
and an image segmentation algorithm to observe OD
distribution and area aggregation profile. After that,
we applied a deep NN to classify the film as approved
or disapproved. The code is available on GitHub
1
.
4 EXPERIMENTAL STUDY
4.1 Class Prediction and Interpretation
The performance analysis provides the best sequential
model presenting 86.67% of accuracy on the test and
an average loss of 0.46 with an inference time of 4 ms,
demonstrating, initially, the NN models’ applicability
for multilayered problems. Furthermore, the reduced
number of objects compared with the features used to
train and test the algorithm can impact the model per-
formance, needing more tests and evaluation to vali-
date the results.
4.2 Film Region Semantic Segmentation
for Cluster Analysis
The clustering analysis used image processing
through spatial regularization on super-pixels to make
segmented regions more compact. The pipeline used
comprises (i) computation of super-pixels; (ii) ex-
traction of descriptors; (iii) soft classification, using
the Gaussian Mixture Model for unsupervised learn-
ing; (iv) final segmentation using Graph Cut (Borovec
et al., 2017).
This work experiment used a super-pixel size of 1
and regularization of 0.1, with the number of classes
equal to four. These parameters were obtained by ex-
perimentation, observing the best OD profile division
and comprehension. Fig. 6 shows approved and dis-
approved examples, where the yellow and red regions
are interpreted as deprecated areas.
Fig. 6a is an approved object and presents a sig-
nificant region of class 1 (blue light), differently from
Fig. 6b, which shows a substantial part of class 2
(yellow) with class 3 (red) areas distributed inside this
class. The class 3 region format of points and edges in
different vertical positions indicates possible fault re-
gions associated with pinholes and local coating sys-
tem imbalance.
1
https://github.com/tmrb/Master-project-codes
Visual Analysis of Deep Learning Methods for Industrial Vacuum Metalized Film Product
383
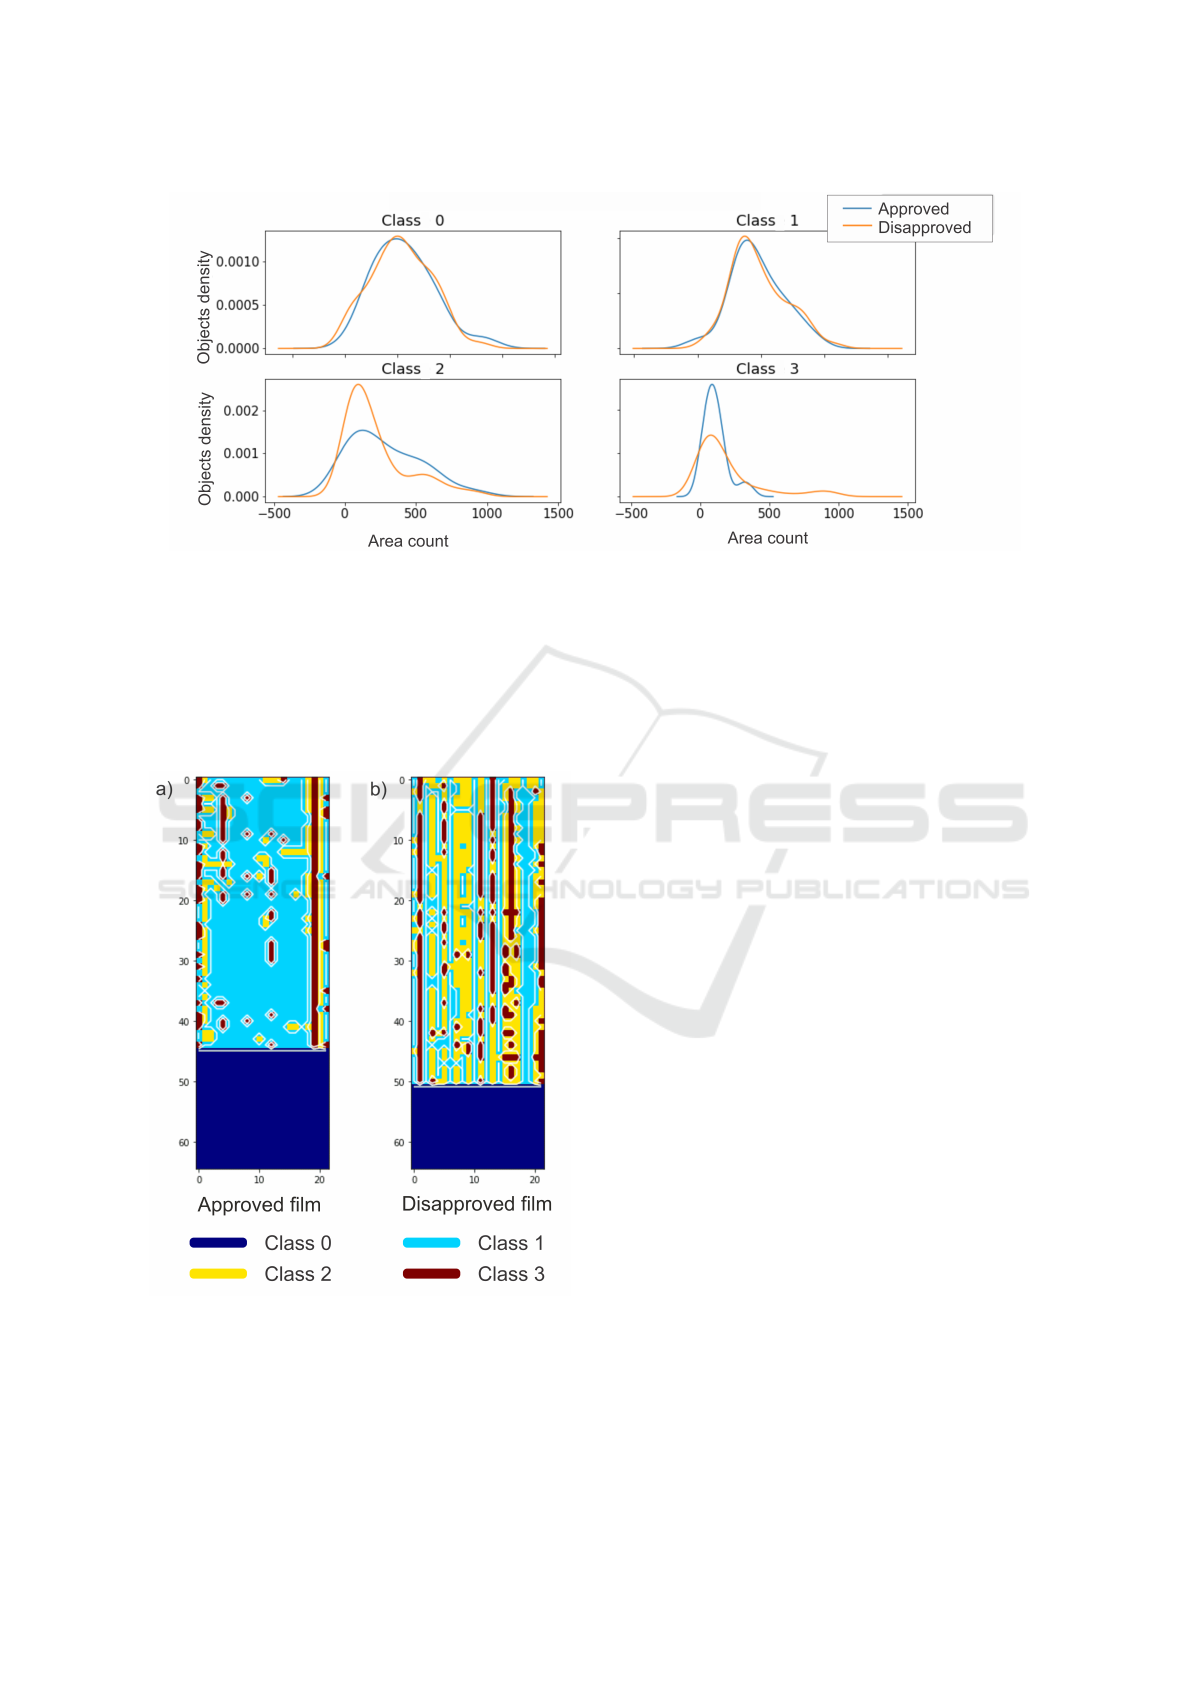
Figure 5: After addressing a class for each OD value of a product, we sum the number of OD classes by-product, representing
area count. Dividing the objects according to his final classification, we could compare the area count occurrence in the
objects approved and disapproved to observe possible influences in the product’s final quality. The blue line represents the
area counting for approved objects and the orange line for disapproved objects.
This visualization provides insightful observa-
tions. For the disapproved film, the local coating
system on 2, 11, 13, 16, 22 positions present red as
the significant class indicating potential local system
Figure 6: Film profile semantic segmentation for fault iden-
tification. Each region color represents a class obtained by
clustering. The marine blue is class 0 and represents the
padding area, the blue light class 1, yellow class 2, and red
as class 3. a) It is an approved film object. b) A disapproved
film object.
problems or imbalances in one of the process vari-
ables: wire feed, wire aligning, or boat temperature.
For the approved film, the predominant blue re-
gion indicates a good coating and uniformity. On the
other hand, the spaced red points showed small areas
with a soft covering associated with pinholes region,
which can be caused mainly by smalls dirt or debris
in the film profile that could be avoided by vacuum
and venting variables adjustments.
Looking for objects analysis through class appear-
ance, Fig. 5 count the class pixels area for each ob-
ject. Observing that, class 3 demonstrated many high
area counts for major disapproved objects, reinforcing
the clustering analysis and the association of class 3
as undesired OD regions that contribute to object dis-
approval. For the further classes, no substantial class
counting differences were obtained between approved
and disapproved products.
4.3 Class Prediction with Semantic
Segmented Images
Another interesting evaluation is in the layer’s out-
puts, where we can observe the layer weights map-
ping and infer if the semantic segmentation could im-
prove the classification process. Fig. 7 demonstrate
the three first layers outputs, first, using the original
OD values profile as the object input (Fig. 7a), and
second using the images obtained through the seman-
tic segmentation application (Fig. 7b). The three ini-
tial layers correspond to the convolutional layers with
three neurons, max-pooling (2x2), and another con-
volutional with eight neurons.
VISAPP 2022 - 17th International Conference on Computer Vision Theory and Applications
384
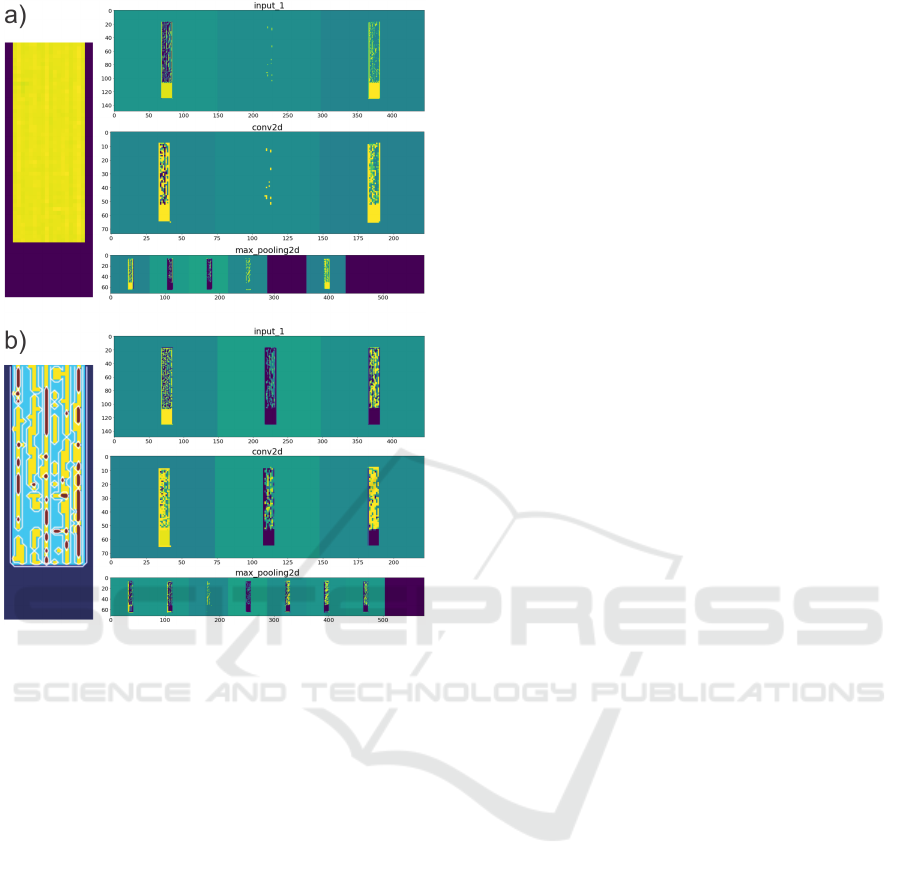
Figure 7: The three initial layers output analysis of using
different types of images as input to train/test algorithm. a)
Optical Density (OD) profile values of metalized film used
as objects and the respective initial layers outputs. b) OD
profile films after semantic segmentation with four OD re-
gions classes representation used as input to train/test algo-
rithm and his respective initial layers outputs.
It was possible to observe an improvement in
layers output distribution attributed to semantic seg-
mented images as the inputs. Fig. 7a demonstrates
three empty outputs for the 5th, 7th, and 8th neuron,
while Fig. 7b present only the 8th output empty of
information. Besides that, the object contour and re-
gions mapped by the layer’s output values are more
continuous and distinguishable for inputs obtained by
the semantic segmentation, demonstrating improve-
ments in the edges capture.
In terms of performance as accuracy and loss, we
did not observe relevant differences. These metrics
presented the same median values of 86.67% for ac-
curacy and 0.46 for loss, owing to the lack of objects
used to train/test/validate the algorithms. However,
the output distribution reveals essential contributions
of the previous image segmentation, with improved
pixel-wise analysis and model sensitivity. In addition,
the pixel importance was better propagated through
the layers and represented in the final layers,
demonstrating sensitivity enhancement to the model.
As the original OD profile does not present any
difference in pixel relevance, a more distributed layer
weights profile is expected, as closer to Fig. 7b.
Moreover, the weights highlighted over the algo-
rithms’ layers trained with segmented inputs demon-
strate a better sparsity of information. The refining of
the importance of the features mapping reveals spe-
cific details in the shadow layers. Also, sparsity is
a crucial feature and represents efficiency improve-
ments by reducing resource use, like storage, com-
munication, and computation requirements.
5 CONCLUSIONS
This work demonstrated that deep learning methods,
like neural networks and semantic segmentation, can
be applied to fault identification, not only for images
but also for physical measures spatially distributed,
propitiating semantic analysis, quality monitoring,
and better quality prediction of the product. The use
of semantic segmentation associated with image con-
struction through physical measures represents a nov-
elty for industrial applications and academic explo-
ration, contributing to many other applications be-
sides the Vacuum metalization process. The use of
more objects and tests can propitiate further applica-
tions of the deep learning model applied, using as in-
dicators for feature control, fault detection, and qual-
ity monitoring. Moreover, these algorithms can im-
prove coating in real-time, demonstrating deprecate
region identification, promoting feature manipulation,
and guiding operator analysis.
ACKNOWLEDGEMENTS
The authors would like to thanks the Conselho Na-
cional de Desenvolvimento Cient
´
ıfico e Tecnol
´
ogico
- CNPq and Laborat
´
orio de Combust
´
ıveis - LAC/
UFPE for the industrial partnership incentive and sup-
port.
REFERENCES
Akbari, M., Liang, J., Han, J., and Tu, C. (2020).
Learned multi-resolution variable-rate image com-
pression with octave-based residual blocks. arXiv
preprint arXiv:2012.15463.
Alcala, C. F. and Qin, S. J. (2010). Reconstruction-based
contribution for process monitoring with kernel prin-
Visual Analysis of Deep Learning Methods for Industrial Vacuum Metalized Film Product
385

cipal component analysis. Industrial & Engineering
Chemistry Research, 49(17):7849–7857.
Bach, S., Binder, A., Montavon, G., Klauschen, F., M
¨
uller,
K.-R., and Samek, W. (2015). On pixel-wise explana-
tions for non-linear classifier decisions by layer-wise
relevance propagation. PLOS ONE, 10(7):1–46.
Bishop, C. (2011). Vacuum Deposition onto Webs, Films
and Foils. Elsevier Science.
Bishop, C. A. (2007). Vacuum deposition onto webs, films,
and foils. Second Edition, 91(2).
Bishop, C. A. and Mount, E. M. (2016). 15 - vacuum metal-
lizing for flexible packaging. In Wagner, J. R., editor,
Multilayer Flexible Packaging (Second Edition), Plas-
tics Design Library, pages 235 – 255. William Andrew
Publishing, 2nd ed. edition.
Borovec, J., Kybic, J., and Nava, R. (2017). Detection
and localization of drosophila egg chambers in mi-
croscopy images. In Wang, Q., Shi, Y., Suk, H.-I.,
and Suzuki, K., editors, Machine Learning in Medical
Imaging, pages 19–26, Cham. Springer International
Publishing.
Chollet, F. et al. (2015). Keras.
Dutta, S., Shen, H., and Chen, J. (2018). In situ predic-
tion driven feature analysis in jet engine simulations.
In 2018 IEEE Pacific Visualization Symposium (Paci-
ficVis), pages 66–75.
Fan, J. and Wang, Y. (2014). Fault detection and diagnosis
of non-linear non-gaussian dynamic processes using
kernel dynamic independent component analysis. In-
formation Sciences, 259:369–379.
I.F., G. (1993). Vacuum coating applications for snack food
packaging. 36th Ann. Tech. Conf. Proc. Society of Vac-
uum Coaters, pages 254—-258.
Kano, M. and Nakagawa, Y. (2008). Data-based pro-
cess monitoring, process control, and quality im-
provement: Recent developments and applications in
steel industry. Computers & Chemical Engineering,
32(1):12 – 24. Process Systems Engineering: Contri-
butions on the State-of-the-Art.
Lei, Y., Yao, X., Chen, W., Zhang, J., Mehnen, J., and Yang,
E. (2020). Multiple object detection of workpieces
based on fusion of deep learning and image process-
ing*. In 2020 International Joint Conference on Neu-
ral Networks (IJCNN), pages 1–7.
Liu, Y., Fan, Y., and Chen, J. (2017). Flame images for
oxygen content prediction of combustion systems us-
ing dbn. Energy & Fuels, 31(8):8776–8783.
Materials, A. (2016). Roll-to-roll web coating technology.
WEB Coating Products, 10.
Pajer, S., Streit, M., Torsney-Weir, T., Spechtenhauser, F.,
M
¨
oller, T., and Piringer, H. (2017). Weightlifter: Vi-
sual weight space exploration for multi-criteria deci-
sion making. IEEE Transactions on Visualization and
Computer Graphics, 23(1):611–620.
Perry, M. and Lentz, R. (2009). Susceptors in microwave
packaging. Development of Packaging and Products
for Use in Microwave Ovens, pages 207–236.
Qin, S. J. (2012). Survey on data-driven industrial process
monitoring and diagnosis. Annual Reviews in Control,
36(2):220 – 234.
Qin, S. J., Dong, Y., Zhu, Q., Wang, J., and Liu, Q. (2020).
Bridging systems theory and data science: A unifying
review of dynamic latent variable analytics and pro-
cess monitoring. Annual Reviews in Control, 50:29 –
48.
Shrikumar, A., Greenside, P., and Kundaje, A. (2017).
Learning important features through propagating ac-
tivation differences. In Precup, D. and Teh, Y. W.,
editors, Proceedings of the 34th International Con-
ference on Machine Learning, volume 70 of Pro-
ceedings of Machine Learning Research, pages 3145–
3153, International Convention Centre, Sydney, Aus-
tralia. PMLR.
Wongsuphasawat, K., Smilkov, D., Wexler, J., Wilson, J.,
Man
´
e, D., Fritz, D., Krishnan, D., Vi
´
egas, F. B.,
and Wattenberg, M. (2018). Visualizing dataflow
graphs of deep learning models in tensorflow. IEEE
Transactions on Visualization and Computer Graph-
ics, 24(1):1–12.
Wu, W., Zheng, Y., Chen, K., Wang, X., and Cao, N.
(2018). A visual analytics approach for equipment
condition monitoring in smart factories of process in-
dustry. In 2018 IEEE Pacific Visualization Symposium
(PacificVis), pages 140–149.
Wuest, T., Weimer, D., Irgens, C., and Thoben, K.-D.
(2016). Machine learning in manufacturing: advan-
tages, challenges, and applications. Production and
Manufacturing Research: An Open Access Journal,
4(1):3.
Xu, P., Mei, H., Ren, L., and Chen, W. (2017). Vidx: Visual
diagnostics of assembly line performance in smart fac-
tories. IEEE Transactions on Visualization and Com-
puter Graphics, 23(1):291–300.
VISAPP 2022 - 17th International Conference on Computer Vision Theory and Applications
386
