
Improving Power and Energy Efficiency of Linearly Equalized Baseband
Cable Transmission Links
Christoph Lange
1
and Andreas Ahrens
2
1
Hochschule f¨ur Technik und Wirtschaft Berlin, University of Applied Sciences, 10313 Berlin, Germany
2
Hochschule Wismar, University of Applied Sciences: Technology, Business and Design, 23966 Wismar, Germany
Keywords:
Transmission System, Telecommunication Network, Power, Energy, Baseband, Cable, Equalization.
Abstract:
Telecommunication networks have been identified to exhibit a substantial electrical power and energy demand.
Therefore it is important to utilize power and energy efficient systems as building blocks for such networks. In
wired access networks copper cables are used for highspeed data transmission. Important technical indicators
for power and energy efficiency of transmission systems are transmit power and energy per bit. In this work
it is investigated how transmit power and energy per bit in linearly equalized multilevel baseband cable trans-
mission systems can be minimized by exploiting degrees of freedom in the transmission link design for given
throughput and transmission quality. First, the constellation size is a degree of freedom: Its optimization leads
to minimum values of transmit power and energy per bit depending on the interplay between throughput and
band limitation of the cable. Second, the partitioning of the equalization to transmitter and receiver is a degree
of freedom: Here, a uniform distribution of the linear equalizing function is found to be optimum in terms of
minimum transmit power or energy per bit at a given transmission performance and quality. The results show
that the optimization of constellation size and equalization partitioning leads to significant transmit power and
energy-per-bit savings compared to conventional baseband cable transmission systems.
1 INTRODUCTION
Telecommunication networks exhibit a significant
electrical power and energy demand (Lambert et al.,
2012). Since communication services are indispens-
able and the intensity of their usage is rising, exist-
ing telecommunication networks are continuously ex-
tended in terms of coverage and performance capa-
bilty and network sections or even whole new net-
works have to be installed. Hence it is important
to employ power and energy efficient transmission
and networking systems to limit the networks’ over-
all power and energy demand. Because of the impor-
tance of the sustainability of telecommunication net-
works a vast number of research and development ac-
tivities has been initiated and conducted in the past
few decades to understand and to limit – or even to
reduce – the power and energy demand of communi-
cation networks and transmission systems, e.g. (Pick-
avet et al., 2008; Agrell and Karlsson, 2009; Kilper
et al., 2011; Bolla et al., 2011; Tsiropoulou et al.,
2012; Kilper et al., 2012) – and many more.
In fixed access networks still twisted-pair copper
cables dating back to the analogue telephone network
era are widely utilized for broadband data transmis-
sion to apartment buildings and individual homes –
at least as long as optical fiber access is not available
extensively and at a reasonable retail price. Wired ac-
cess networks typically consist of a large multitude of
access lines and therefore the transmission over those
copper cables has a significant share in the overall
telecommunication networks’ power and energy con-
sumption (Lange et al., 2011).
For that reason insights are of interest on how
to design copper cable transmission systems power
and energy efficiently. It is important to identify de-
grees of freedom that are accessible for optimization
in the design or adaptation process of the transmis-
sion system in a way that the power and energy de-
mand becomes a minimum for given boundary condi-
tions concerning, e.g., bit rate and bit error probabil-
ity. Transmit power and energy per transmitted bit are
important technical indicators for the energy of trans-
mission systems: Therefore they are used as mea-
sures for the power and energy efficiency through-
out this paper. When considering whole telecom-
munication networks, this transmission energy us-
age represents a lower bound to the overall energy
or energy per bit—as at least the traffic has to be
transferred between network nodes, but other network
Lange, C. and Ahrens, A.
Improving Power and Energy Efficiency of Linearly Equalized Baseband Cable Transmission Links.
DOI: 10.5220/0010800300003118
In Proceedings of the 11th International Conference on Sensor Networks (SENSORNETS 2022), pages 15-25
ISBN: 978-989-758-551-7; ISSN: 2184-4380
Copyright
c
2022 by SCITEPRESS – Science and Technology Publications, Lda. All rights reserved
15

functions such as switching, buffering, network con-
trol and routing have to be performed, too, and ex-
hibit additional energy demand (per transferred bit)
(Kilper et al., 2010). The analysis in this paper fo-
cusses on the transmission problem, the impact of the
mentioned other network functions and their compu-
tational complexity on the energy efficiency is left for
future work.
In order to obtain general insights on the trans-
mission problem stated above primarily by means of
clear and concise analytical calculations throughout
this work baseband transmission systems operating
over copper cable channels are investigated. Further-
more, baseband transmission may regain practical in-
terest for application in copper-based access networks
as there are hints that the prevalently utilized multi-
carrier systems could be not as cost-efficient as other
modulationformats when it comes to hardwareimple-
mentation (McCune, 2013). Here, the simpler imple-
mentations of baseband transmission systems could
facilitate an improved cost efficiency.
Often, sensor data are backhauled via existing
communication networks and thus copper cables of
the telecommunication access networks are parts of
overall sensor networks. Therefore the power and
energy efficiency of those copper transmission links
is important for the overall energy efficiency and
sustainability of sensor networks. Furthermore, the
energy-optimized baseband systems can be used also
directly for linking wired sensors—as particulary the
energy efficiency in distributed sensor networks with
lots of remote sensors is of overwhelming importance
for their energy efficient and sustainable operation.
Usually, the desired throughput – the bit rate – of
a link is given as a performance requirement. Further-
more, a certain transmission quality is required for the
link to operate reliably – translating into a fixed bit er-
ror probability. Beyond that, the channel and distur-
bance characteristics are typically given.
In transmission systems the number of transmis-
sion levels – the constellation size – is a first degree
of freedom subject to optimization: In (Lange and
Ahrens, 2021) the behaviour of an AWGN (additive
white Gaussian noise) baseband transmission system
in terms of transmit power and energy per transmitted
bit has been studied with respect to the constellation
size of a multilevel transmission together with a base-
band cable transmission system with linear equaliza-
tion in the receiver.
Therefore, as a starting point, in this paper the
transmit power and the energy per transmitted bit will
be calculated for linearly equalized baseband cable
transmission systems as functions of the constellation
size: An optimization of the constellation size is pos-
sible and necessary with respect to minimum trans-
mit power or energy per bit, respectively. A second
degree of freedom in linearly equalized transmission
systems is related to the part of the equalization that
is performed at the transmitter side and the part that
is implemented at the receiver side. This partitioning
leads to an optimum segmentation of the equalization
to transmitter and receiver – and hence to a minimum
transmit power or energy per transmitted bit, respec-
tively: The transmit power or energy per bit can be
further reduced.
The novelty of the paper is based on the identifica-
tion of degrees of freedom when designing or adapt-
ing a baseband transmission scheme operating via a
linearly equalized copper cable transmission channel
with regard to minimum power and energy demand.
Both, the constellation size and the partitioning of
the linear equalization to transmitter and receiver are
identified as such degrees of freedom. They are op-
timized with respect to minimum transmit power or
energy per bit, respectively. The results show that
by optimal choice of those two parameters significant
improvements in power and energy efficiency can be
achieved.
The remaining part of this paper is organized as
follows: In section 2 the transmit power and the en-
ergy per bit for a conventional multilevel baseband
cable transmission with complete receiver-side linear
equalization are calculated for given bit rate and bit
error probability. Results are presented as functions
of the constellation size. In section 3 the transmission
model for the cable transmission is generalized by
partioning the linear equalization to transmitter and
receiver: Transmit power and energy per bit are de-
rived for this modified setup and results are presented
– also including achievable savings when using the
degrees of freedom for optimization. Section 4 sum-
marizes major findings, provides concluding remarks
and gives an outlook on potential future work.
2 ENERGY EFFICIENCY OF
CABLE TRANSMISSION WITH
LINEAR EQUALIZATION IN
THE RECEIVER
2.1 Cable Transmission Model
The binary digital data source emits a sequence of
bits for transmission over the copper cable channel.
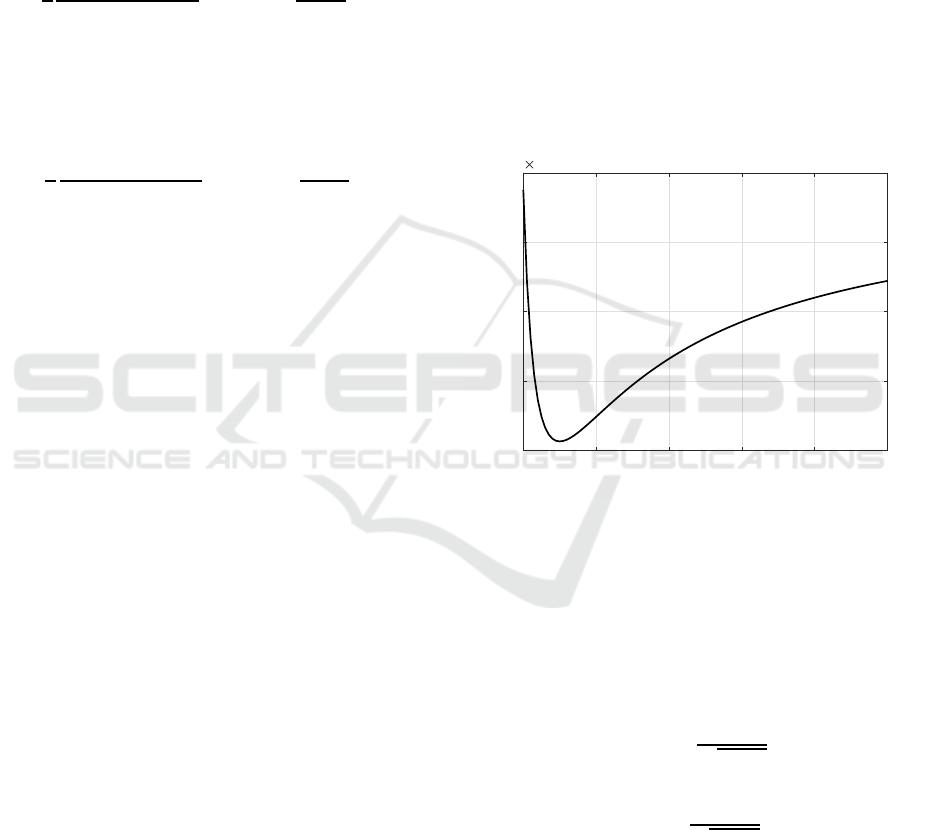
According to the transmission model shown in Fig-
ure 2 binary data with a bit rate f
B
are converted
by a multilevel coder in the transmitter to symbols
SENSORNETS 2022 - 11th International Conference on Sensor Networks
16

with s amplitude levels—and hence a symbol rate of
f
T
= f
B
/ld(s).
1
After filtering with the transmit fil-
ter transfer function G
s
( f) an s-ary pulse amplitude
modulated signal is transmitted over the copper cable
channel.
The copper cable channel is modelled by the trans-
fer function
G
k
( f) = e
−ℓ
q
j
f
f
0
, (1)
where ℓ denotes the cable length (in km) and
f
0
represents the characteristic cable frequency (in
MHz· km
2
). The characteristic cable frequency f
0
is a
cable-specific constant that depends, e.g., on the wire
diameter and on the insulation material. The trans-
fer function (1) can be derived via transmission line
theory for the RC range – leading to a strong low-
pass behaviour of the channel. Inevitable noise distur-
bances are modelled by additive white Gaussian noise
(AWGN) of power spectral density Ψ
0
.
Figure 1 shows the amplitude frequency resonse
of an exemplary twisted-pair copper cable with a wire
diameter of 0,6mm for two cable lengths: The low-
pass characteristic of the cable transmission channel
is clearly recognizable. Furthermore it becomes obvi-
ous, that a longer cable (ℓ = 2km) shows a stronger
low-pass band limitation than a shorter cable (ℓ =
0,5km).
10
0
10
2
10
4
10
6
-60
-50
-40
-30
-20
-10
0
f (in Hz) →
20 lg|G
k
(f)| (in dB) →
ℓ = 0,5 km
ℓ = 2 km
Figure 1: Cable transfer function of a twisted-pair copper
cable with a wire diameter of 0,6mm (f
0
= 0,178MHz ·
km
2
) for two cable lengths.
The transmission channel in causes signal distor-
tion leading to intersymbol interference (ISI) which
may lead to bit errors. Therefore equalizers are uti-
lized: The equalizer’s main task is to eliminate – or
at least to minimize – the distorting impact of the
1
The notation ld(x) describes the dyadic logarithm:
ld(x) = log
2
(x).
channel on the wanted signal. In one way or an-
other for this purpose the equalizer has to establish
a form of the inverse of the channel’s transfer func-
tion in the signal path. The transmission model de-
picted in Figure 2 contains a conventional baseband
cable transmission link where the cable’s impact is
completely linearly equalized by the inverse of the ca-
ble transfer function (1/G
k
( f)) at the receiver side.
Although there are a lot of equalization techniques
established using digital signal processing methods –
e.g. (Proakis and Salehi, 2008; Anderson, 2005) – an
equalizer like described above is presumed in order
to obtain analytical results and insights – which is a
main aim of this contribution.
After filtering with the receive filter transfer func-
tion G
e
( f) in the receiver and subsequent symbol rate
sampling the detector decides on the received signal
amplitude. The multilevel decoder maps the detected
symbols to the received bits and the sink is provided
with a binary data sequence.
The transmit and receive filters G
s
( f) and G
e
( f)
are square-root raised cosine filters (Proakis and
Salehi, 2008) with roll-off factor r, respectively: Then
the receive signal at the detector input is ISI-free as
over the cascade of transmit and receive filter the first
Nyquist criterion is met (Proakis and Salehi, 2008)
and the cable transfer function is completely equal-
ized.
Source
Multilevel Transmit
Receiver
Detector
Sink
Receive
Transmitter
AWGN
Multilevel
Coder
Decoder
Channel
Filter
Filter
Sampler
Cable
lizer
Equa-
G
s
(f) G
k
(f)
Ψ
0
1
G
k
(f)
G
e
(f)
Figure 2: Model of the conventional cable transmission sys-
tem.
For assessing the transmission quality, the signal-
to-noise ratio
ρ =
(Half Vertical Eye Opening)
2
Noise Power
=
U
2
A
U
2
R
(2)
at the detector input is used. The half-level transmit
amplitude is denoted as U
s
, i.e. the distance between
neighbouring signal amplitude levels is 2U
s
. As the
first Nyquist criterion is met, from transmit filter input
to receive filter output the half vertical eye opening
Improving Power and Energy Efficiency of Linearly Equalized Baseband Cable Transmission Links
17

equals the half-level transmit signal amplitude: U
A
=
U
s
.
With square-root raised cosine receive filter and
linear equalization of the channel transfer function by
its inverse in the receiver the noise power at the detec-
tor input results in
U
2
R
= Ψ
0
∞
Z
−∞
G
e
( f)
G
k
( f)
2
df . (3)
Assuming Gray coding (Proakis and Salehi, 2008) the
bit error probability of the s-ary baseband transmis-
sion with (2) finally yields
2
P
b
=
s− 1
sld(s)
1− erf
r
ρ
2
. (4)
2.2 Transmit Power and Energy per Bit
Calculation
In order to assess the power and energy efficiency of
the cable baseband transmission system the transmit
power P
s
and the energy E
b
per bit are calculated con-
sidering the boundary conditions bit rate f
B
and bit
error probability P
b
.
The average transmit power for an equally dis-
tributed s-ary random baseband signal, a redundancy-
free source and a square-root raised cosine transmit
filter is given as
3
P
s
=
U
2
s
3
s
2
− 1
. (5)
Since the half vertical eye opening in the ISI-free
overall channel yields U
A
= U
s
the signal-to-noise ra-
tio becomes
ρ =
U
2
s
U
2
R
. (6)
Solving (6) for U
2
s
and inserting the result in (5) leads
to the transmit power
P
s
=
U
2
R
· ρ
3
s
2
− 1
. (7)
In order to obtain a relationship of the transmit power
P
s
on the bit rate f
B
and the bit error probability P
b
equation (4) is solved for the signal-to-noise ratio ρ:
ρ = 2
erf
−1
1−
sld(s)
s− 1
P
b
2
. (8)
2
The function erf(x) denotes the Gaussian error function
(Proakis and Salehi, 2008).
3
In this paper a system-theoretic power with the dimen-
sion of (voltage)
2
(with the unit V
2
) is used. At a real,
constant resistance R this is translated into a power in unit
W by dividing the system-theoretic power by R.
Finally, by combining (7) and (8) the transmit power
P
s
for given bit rate f
B
and fixed bit error probability
P
b
results in:
P
s
=
s
2
− 1
3
·U
2
R
· 2
erf
−1
1−
sld(s)
s− 1
P
b
2
. (9)
The transmit power (9) depends on the given bit er-
ror probability P
b
and the constellation size s – which
is a degree of freedom and thus subject to optimiza-
tion targeting minimum transmit power P
s
. The noise
power U
2
R
is calculated by numerically solving (3): It
depends via the symbol rate f
T
on the given bit rate
f
B
and furthermore on the cable parameters ( f
0
and ℓ)
and the noise disturbance (Ψ
0
).
The energy per transmitted bit
E
b
=
P
s
f
B
(10)
is an important energy efficiency indicator in digi-
tal information transmission (Tucker, 2011a; Tucker,
2011b) and with (9) it results in
E
b
=
s
2
− 1
3
·
U
2
R
f
B
· 2
erf
−1
1−
sld(s)
s− 1
P
b
2
.
(11)
Furthermore, the energy per bit E
b
exhibits not only
an important energy efficiency indicator for transmis-
sion systems and communciation networks, but it con-
stitutes also – together with the noise power spec-
tral density Ψ
0
– an important figure of merit as ra-
tio E
b
/Ψ
0
when assessing digital communication sys-
tems (Sklar, 2001).
2.3 Transmit Power and Energy per Bit
Results
Numerical transmit power and energy-per-bit results
are presented using a twisted-pair copper cable with
a wire diameter of 0,6mm (characteristic cable fre-
quency f
0
= 0,178MHz · km
2
) as an exemplary but
typical representative of a transmission line in copper-
based access networks. The numerical assumptions
for the bit error probability P
b
and the noise power
spectral density Ψ
0
are based on relevant values for
baseband transmission systems. The roll-off factors
of the square-root raised cosine transmit and receive
filters are chosen to be r = 0,5. As the constellation
size s is a degree of freedom the results are depicted
as a function of s or, more precisely, of the number
of bits per symbol ld(s)—to obtain a logarithmically
scaled horizontal axis.
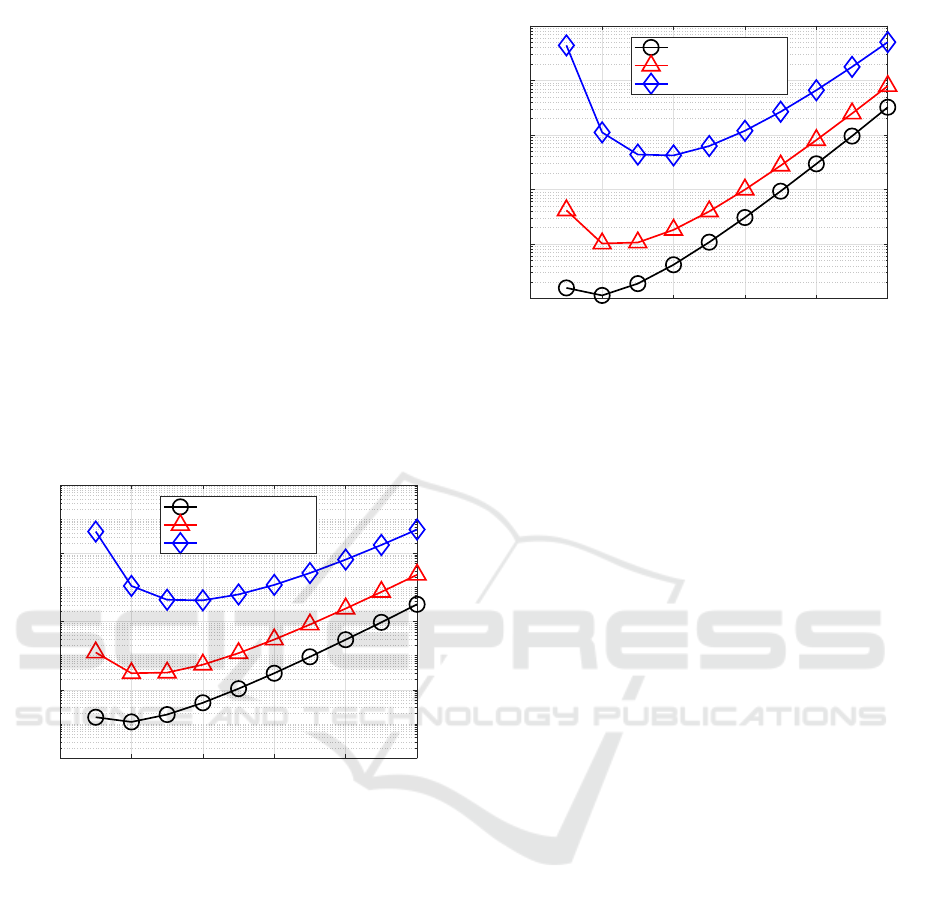
First, in Figure 3 the transmit power P
s
is depicted
as a function of the constellation size s for different bit
rates f
B
for a copper cable of length ℓ = 2km. This
SENSORNETS 2022 - 11th International Conference on Sensor Networks
18
length is on average representative for a cable that
runs from a traditional telephone network exchange as
access node to an individual home or multi-dwelling
building in a fiber to the exchange (FTTEx) access
network architecture (Lange et al., 2008).
The transmit power P
s
shows a minimum at an op-
timum constellation size s
opt
that depends on the bit
rate f
B
. When starting from s
opt
, with rising constel-
lation size s the impact of higher-order constellation
sizes known from the AWGN transmission (Lange
and Ahrens, 2021) is effective: The higher number of
transmission levels and their greater density require
higher transmit power for fixed transmission quality.
Towards smaller constellation sizes s another mecha-
nism takes effect: The noise power is enhanced since
the signal bandwidth – and hence the receive filter
bandwidth – is increased requiring a higher transmit
power when targeting a constant transmission quality,
i. e., a fixed bit error probability.
0 2 4 6 8 10
10
-4
10
-2
10
0
10
2
10
4
ld(s) →
P
s
(inV
2
) →
f
B
= 1 MHz
f
B
= 3 MHz
f
B
= 10 MHz
Figure 3: Transmit power P
s
as a function of the con-
stellation size s for several fixed bit rates f
B
(parameters:
ℓ = 2km, P
b
= 1,5· 10
−9
and Ψ
0
= 10
−12
V
2
/Hz).
In Figure 4 the energy per transmitted bit E
b
is
shown as a function of the constellation size s as-
suming the same preconditions as in Figure 3. The
curves of the energies per bit E
b
show a very simi-
lar behaviour with respect to the constellation size s
as the transmit power P
s
. This is because of the fact
that each of the transmit power curves is divided (i. e.,
scaled) by a constant – but for each curve different –
bit rate f
B
. Therefore, for the optimization of the con-
stellation size s it makes no differences whether it is
optimized with regard to minimum transmit power or
energy per bit.
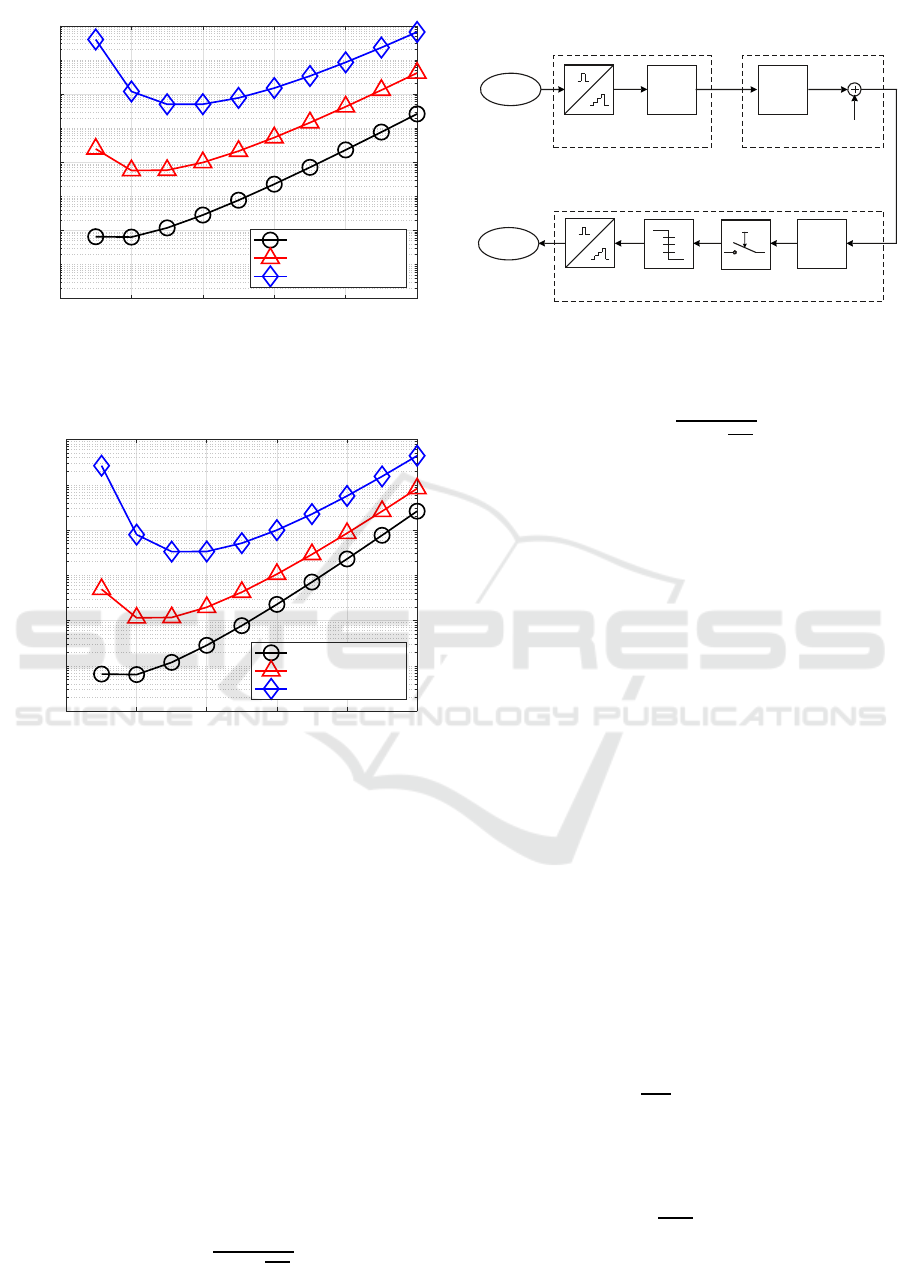
Second, in Figure 5 the transmit power P
s
is dis-
played as a function of the constellation size s for dif-
ferent bit rates f
B
for a copper cable length ℓ = 0,5km
– which is exemplarily representative for a copper ca-
ble that connects an access multiplexer residing in
0 2 4 6 8 10
10
-9
10
-8
10
-7
10
-6
10
-5
10
-4
ld(s) →
E
b
(inV
2
/Hz) →
f
B
= 1 MHz
f
B
= 3 MHz
f
B
= 10 MHz
Figure 4: Energy per transmitted bit E
b
as a function of the
constellation size s for several fixed bit rates f
B
(parameters:
ℓ = 2km, P
b
= 1,5· 10
−9
and Ψ
0
= 10
−12
V
2
/Hz).
a street cabinet to an individual home or apartment
building in a fiber to the curb (FTTC) (Shumate,
2008) access network architecture (also denoted as
fiber to the cabinet (FTTCab) (Lange et al., 2008)). In
such an access network architecture the access multi-
plexers are connected backwards to further stages of
the telecommunication network by optical fibers. Fig-
ure 6 shows the corresponding energy per bit E
b
as a
function of the constellation size s. Again, the curves
of the energies per bit E
b
exhibit a very similar be-
haviour with respect to the constellation size s as the
transmit power P
s
curves – since both are connected
by the scaling factor bit rate f
B
, which is fixed for
each individual curve.
The principle behaviour of the transmit power and
energy-per-bit trajectories is very similar to those in
the case with the longer cable (ℓ = 2km). The main
difference are the higher bit rates that are possible at
comparable transmission performance and quality on
shorter cables – since the lowpass effect of the cable
is by far weaker as with longer cables.
3 ENERGY EFFICIENCY OF
CABLE TRANSMISSION WITH
DISTRIBUTED LINEAR
EQUALIZATION
3.1 Generalized Cable Transmission
Model
The linear equalization frees the wanted signal com-
pletely from distortions induced by the cable transfer
function. In linear systems the sequence of the signal
processing is not relevant to the overall equalization
Improving Power and Energy Efficiency of Linearly Equalized Baseband Cable Transmission Links
19
0 2 4 6 8 10
10
-4
10
-2
10
0
10
2
10
4
ld(s) →
P
s
(inV
2
) →
f
B
= 10MHz
f
B
= 50MHz
f
B
= 150 MHz
Figure 5: Transmit power P
s
as a function of the con-
stellation size s for several fixed bit rates f
B
(parameters:
ℓ = 0,5km, P
b
= 1,5· 10
−9
and Ψ
0
= 10
−12
V
2
/Hz).
0 2 4 6 8 10
10
-10
10
-8
10
-6
10
-4
ld(s) →
E
b
(inV
2
/Hz) →
f
B
= 10MHz
f
B
= 50MHz
f
B
= 150 MHz
Figure 6: Energy per transmitted bit E
b
as a function of the
constellation size s for several fixed bit rates f
B
(parameters:
ℓ = 0,5km, P
b
= 1,5· 10
−9
and Ψ
0
= 10
−12
V
2
/Hz).
result. Therefore it is possible to shift the equalization
or parts of it in the transmission system’s block dia-
gram. Thus, the equalizer transfer function 1/G
k
( f)
is divided into two components: A part of the equal-
ization is performed in the transmitter and the remain-
ing part in the receiver. Thence, the partitioning of the
equalizer transfer function to transmitter and receiver
is another degree of freedom – which is subject to op-
timization, too.
In Figure 7 the generalized transmission model is
shown. All components for multilevel coding and de-
coding, transmit and receive filtering (in the narrower
sense, i. e., concernungG
e
( f)) as well as for sampling
and detection remain as depicted in Figure 7. The
only change concerns the generalized transmit and re-
ceive filters that now exhibit the transfer functions
H
s
( f) =
G
s
( f)
G
k
( f)
m
m+1
(12)
Source
Multilevel Transmit
Receiver
Detector
Sink
Receive
Transmitter
AWGN
Multilevel
Coder
Decoder
Channel
Filter
Filter
Sampler
Cable
H
s
(f)
G
k
(f)
Ψ
0
H
e
(f)
Figure 7: Model of the cable transmission system with
equalization partitioned to transmitter and receiver.
and
H
e
( f) =
G
e
( f)
G
k
( f)
1
m+1
, (13)
respectively. The cable transfer functions’ (G
k
( f))
impact on the transmit signal is – now as before in
section 2 – completely and linearly equalized by its
inverse 1/G
k
( f) – but segmented to transmitter and
receiver. Transmit filter G
s
( f) and receivefilter G
e
( f)
are complemented by equalization components. The
parameter m describes the degree of partitioning of
the equalization to transmitter and receiver. The over-
all system from transmit filter input to receive fil-
ter output stays ISI-free for arbitrary m as the first
Nyquist criterion is met independently of m. The
model contains the special cases:
• m = 0: Complete equalization in the receiver.
• m → ∞: Complete equalization in the transmitter.
• m = 1: Uniform distribution of the equalization to
transmitter and receiver.
Therewith, this transmission model represents a gen-
eralization of the conventional transmission model
discussed and investigated in section 2.
3.2 Transmit Power and Energy per Bit
Calculation
With the power spectral density of the transmit signal
Ψ
s
( f) =
U
2
s
3f
T
s
2
− 1
|H
s
( f)|
2
(14)
the transmit power in this generalized case can be cal-
culated as
P
s
=
∞
Z
−∞
Ψ
s
( f) d f =
2U
2
s
3f
T
s
2
− 1
∞
Z
0
|H
s
( f)|
2
df.
(15)
SENSORNETS 2022 - 11th International Conference on Sensor Networks
20
The noise power at the detector input is obtained as
U
2
R
= Ψ
0
∞
Z
−∞
|H
e
( f)|
2
df = 2Ψ
0
∞
Z
0
|H
e
( f)|
2
df .
(16)
With (2) for Nyquist-1 transmission (U
s
= U
A
) the
relationship U
2
s
= ρ ·U
2
R
holds and the result for the
transmit power with (15), (16) and (8) finally yields
P
s
=
8
3
s
2
− 1
Ψ
0
· ld(s)
f
B
erf
−1
1−
sld(s)
s− 1
P
b
2
· ...
... ·
∞
Z
0
|H
s
( f)|
2
df ·
∞
Z
0
|H
e
( f)|
2
df . (17)
With (17) the energy per bit E
b
= P
s
/ f
B
results in
E
b
=
8
3
s
2
− 1
Ψ
0
· ld(s)
f
2
B
erf
−1
1−
sld(s)
s− 1
P
b
2
· ...
... ·
∞
Z
0
|H
s
( f)|
2
df ·
∞
Z
0
|H
e
( f)|
2
df . (18)
The bit rate f
B
is directly contained in (17) and
(18) and furthermore also – via the symbol rate f
T
that determines the bandwidths of the filters H
s
( f)
and H
e
( f) (Lange and Ahrens, 2021) – in both of the
integrals. Moreover,the transmission quality (P
b
), the
disturbance (Ψ
0
) and the cable characterstics (f
0
, ℓ)
determine the required transmit power or energy per
bit, respectively.
Since a part of the equalization is performed in the
transmitter (pre-equalization) a frequency-dependent
amplification of the signal at the transmitter occurs. In
some circumstances a high transmit signal amplitude
can arise. In such cases transmit components (e.g.
amplifiers) with higher dynamic range are required
than in case of complete linear equalization in the re-
ceiver. This prerequisite is assumed to be fulfilled for
the investigations in this paper.
3.3 Transmit Power and Energy per Bit
Results
In this section, firstly the parameter m is optimized
numerically with respect to minimum transmit power
and energy per bit, respectively. Second, results with
optimum equalization partitioning between transmit-
ter and receiver, i. e. optimized m, are compared to the
transmit power and energy-per-bit results obtained in
the first part of the paper for complete linear equaliza-
tion in the receiver. The numerical evaluations rely on
the exemplary values for signal, disturbance and cable
parameters utilized above – unless otherwise stated.
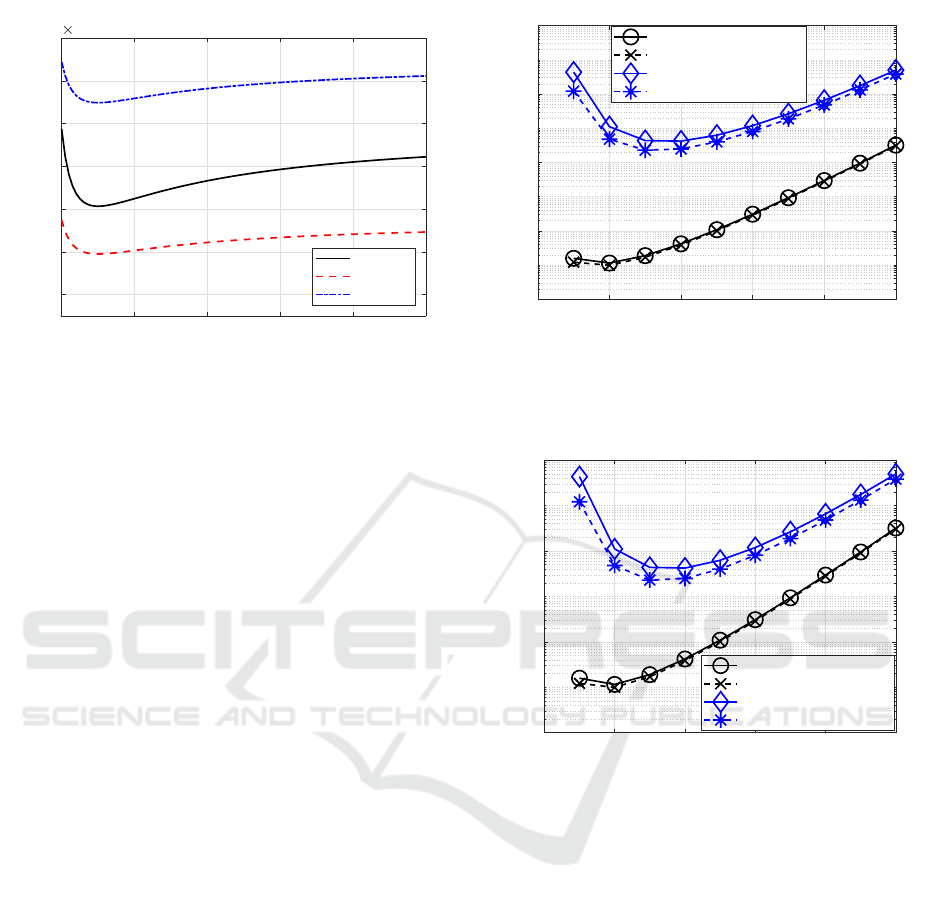
3.3.1 Equalization Distribution Optimization
In Figure 8 the transmit power(17) is shown as a func-
tion of the equalization parameter m that describes the
degree of distribution of the linear equation to trans-
mitter and receiver according to (12) and (13) for a
fixed constellation size s. For m = 0 the equaliza-
tion is completely performed in the receiver (like de-
scribed in section 2) and for m → ∞ it resides en-
tirely in the transmitter. Both extreme cases result
in the same transmit power from a transmission en-
gineering point of view – neglecting potential practi-
cal realization issues (e. g. concerning the linear dy-
namic range in the transmitter). This transmit power
P
s
(m = 0) = P
s
(m → ∞) is also to be found in Fig-
ure 3 for f
B
= 1MHz and ld(s) = 1. It is recogniz-
0 2 4 6 8 10
1.2
1.3
1.4
1.5
1.6
10
-3
m →
P
s
(inV
2
) →
Figure 8: Transmit power P
s
as a function of the equal-
ization parameter m for an exemplary bit rate f
B
= 1MHz
(parameters: ℓ = 2km, s = 2, P
b
= 1,5 · 10
−9
and Ψ
0
=
10
−12
V
2
/Hz).
able, that the transmit power P
s
becomes minimal for
m = m
opt
= 1, i.e. for a uniform distribution of the
linear equalization of the cable impact to transmitter
and receiver: The optimum generalized transmit and
receive filter transfer functions result in
H
sopt
( f) =
G
s
( f)
p
G
k
( f)
(19)
and
H
eopt
( f) =
G
e
( f)
p
G
k
( f)
. (20)
In Figure 9 the transmit power P
s
is depicted as a
function of the equalization parameter m for different
constellation sizes s at a fixed bit rate f
B
: It is recog-
nizable that the minimum transmit power occurs for
m
opt
= 1 for all constellation sizes s. This result is
also – vice versa – valid for different bit rates f
B
and
fixed constellation sizes s. Based on these results it is
Improving Power and Energy Efficiency of Linearly Equalized Baseband Cable Transmission Links
21
0 2 4 6 8 10
0.8
1
1.2
1.4
1.6
1.8
2
10
-3
m →
P
s
(inV
2
) →
s = 2
s = 4
s = 8
Figure 9: Transmit power P
s
as a function of the equal-
ization parameter m for an exemplary bit rate f
B
= 1MHz
for different constellation sizes s (parameters: ℓ = 2km,
P
b
= 1,5· 10
−9
and Ψ
0
= 10
−12
V
2
/Hz)
concluded, that the optimum equalization parameter
m
opt
= 1 is independent of the constellation size s and
of the bit rate f
B
.
The energies per bit E
b
= P
s
/ f
B
can be shown
in comparable diagrams and show a very similar be-
haviour, since they are scaled versions of the transmit
power P
s
– divided by a in each case constant bit rate
f
B
. Particularly, also the optimization with respect to
a minimum energy per bit E
b
then leads to the opti-
mum equalization parameter m
opt
= 1.
In conclusion of this optimization, the optimum
equalization parameter m
opt
= 1 is generally valid for
all bit rates f
B
and constellation sizes s—which is im-
mediately obvious from Figure 8 and Figure 9. The
energies per bit E
b
= P
s
/ f
B
can be shown in compa-
rable diagrams with a very similar behaviour, since
they are scaled versions of the transmit power P
s
–
divided the bit rate f
B
.
3.3.2 Results for Optimized Equalization
Partitioning
The optimization of the equalization parameter m re-
sulted in m
opt
= 1, i. e. a uniform distribution of the
linear cable equlization to transmitter and receiver.
Therefore, the transmit power P
s
and energy per bit E
b
are compared as a function of the constellation size s
again – for m = 0 (conventional transmission system
with complete linear equalization in the receiver, as
in section 2) and for m = m
opt
= 1 (system with opti-
mized linear equalization).
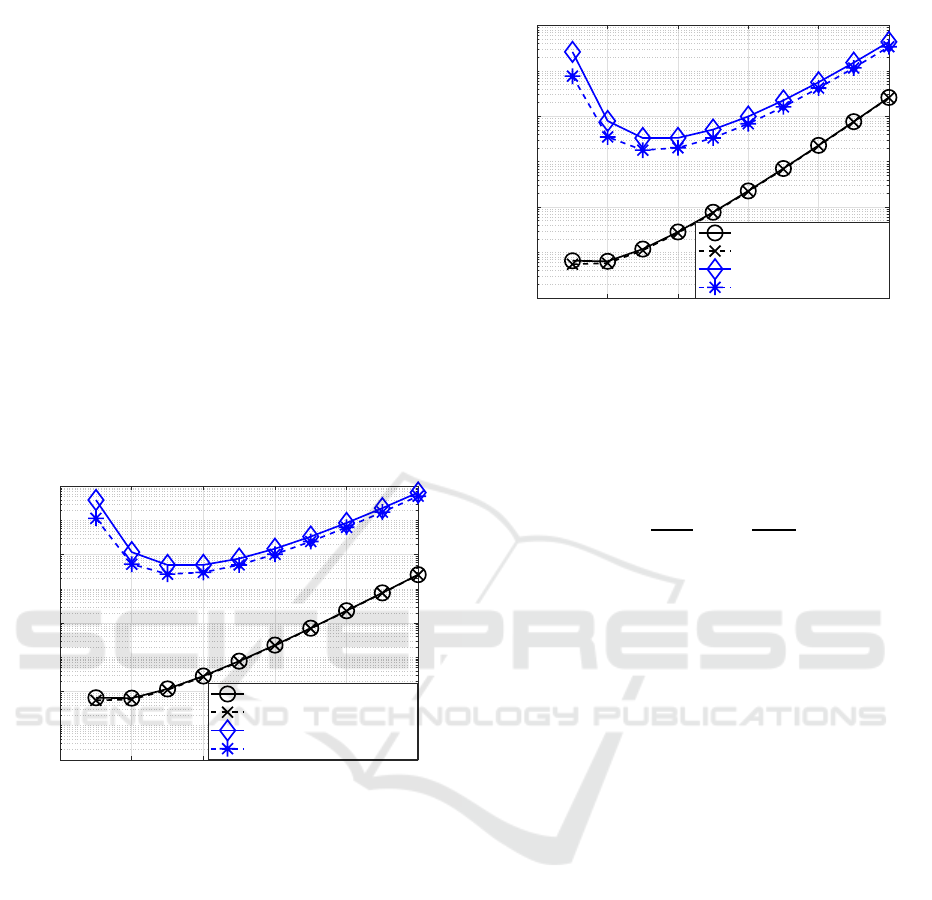
In Figure 10 the transmit power P
s
and in Fig-
ure 11 the energy per bit E
b
are shown as functions
of the constellation size s for two bit rates for both
equalization strategies, respectively.
0 2 4 6 8 10
10
-4
10
-2
10
0
10
2
10
4
ld(s) →
P
s
(inV
2
) →
f
B
= 1 MHz,m = 0
f
B
= 1 MHz,m = 1
f
B
= 10 MHz,m = 0
f
B
= 10 MHz,m = 1
Figure 10: Transmit power P
s
as a function of the con-
stellation size s for two fixed bit rates f
B
for m = 0 and
m = 1 (parameters: ℓ = 2km, P
b
= 1,5 · 10
−9
and Ψ
0
=
10
−12
V
2
/Hz).
0 2 4 6 8 10
10
-10
10
-8
10
-6
10
-4
ld(s) →
E
b
(inV
2
/Hz) →
f
B
= 1MHz,m = 0
f
B
= 1MHz,m = 1
f
B
= 10 MHz,m = 0
f
B
= 10 MHz,m = 1
Figure 11: Energy per transmitted bit E
b
as a function of
the constellation size s for two fixed bit rates f
B
for m = 0
and m = 1 (parameters: ℓ = 2km, P
b
= 1,5· 10
−9
and Ψ
0
=
10
−12
V
2
/Hz).
The results show, that there is a significant gain
in terms of transmit power and energy per bit in par-
ticular at small constellation sizes, respectively. To-
wards larger constellation sizes the gain achievable
by optimizing the equalization distribution becomes
smaller. This behaviour originates from the fact that
at smaller constellation sizes there is a higher symbol
rate and thus a higher signal and filter bandwidth and
the equalization has a greater impact than at larger
constellation sizes, since the frequency range that has
to be amplified by the equalizer to obtain an ISI-free
signal is broader than at higher constellation sizes.
Therefore the optimization of the equalization results
in comparatively high improvements.
The curves of the energies per bit E
b
and of the
transmit powers P
s
show again a very similar be-
haviour with respect to the constellation size s, since
SENSORNETS 2022 - 11th International Conference on Sensor Networks
22
each of the transmit power curves is divided (i. e.,
scaled) by a constant – but for each curve different
– bit rate f
B
to obtain the energy-per-bit functions.
The optimization of the equalization distribution
to transmitter and receiver can lead to a significant de-
crease of the transmit power P
s
or energy per bit E
b
,
respectively, since the optimum constellation sizes lie
in tendency at lower values of s for practically rele-
vant systems – and here the optimization of m shows
large effects.
In Figure 12 and Figure 13 the transmit power P
s
and the energy per bit E
b
are shown as functions of
the constellation size s for two exemplary bit rates
for both equalization strategies, respectively – now
for the shorter cable length of ℓ = 0,5km typical for
FTTC access networks. The insights in principle re-
semble those obtained and discussed before for the
cable of length ℓ = 2km – at correspondingly higher
bit rates f
B
on the shorter cable.
0 2 4 6 8 10
10
-4
10
-2
10
0
10
2
10
4
ld(s) →
P
s
(inV
2
) →
f
B
= 10 MHz, m = 0
f
B
= 10 MHz, m = 1
f
B
= 150 MHz, m = 0
f
B
= 150 MHz, m = 1
Figure 12: Transmit power P
s
as a function of the con-
stellation size s for two fixed bit rates f
B
for m = 0 and
m = 1 (parameters: ℓ = 0,5km, P
b
= 1,5· 10
−9
and Ψ
0
=
10
−12
V
2
/Hz).
3.3.3 Transmit Power and Energy per Bit
Savings
The diagrams in Figures 10–13 show the results for
transmit power and energy per bit in a logarithmic
scale: Although improvements are recognizable it is
hard to estimate the magnitude of the transmit power
or energy per bit savings, respectively.
In order to make those savings visible, a relative
saving in terms of transmit power or energy per bit is
defined. Thereby, as a reference system the transmis-
sion system with two signalling levels and complete
linear equalization in the receiver is utilized—as this
is a conventional system with a simple and convenient
implementation.
0 2 4 6 8 10
10
-10
10
-8
10
-6
10
-4
ld(s) →
E
b
(inV
2
/Hz) →
f
B
= 10 MHz, m = 0
f
B
= 10 MHz, m = 1
f
B
= 150 MHz,m = 0
f
B
= 150 MHz,m = 1
Figure 13: Energy per transmitted bit E
b
as a function of
the constellation size s for two fixed bit rates f
B
for m = 0
and m = 1 (parameters: ℓ = 0,5km, P
b
= 1,5 · 10
−9
and
Ψ
0
= 10
−12
V
2
/Hz).
The relative transmit power or energy-per-bit sav-
ings are defined as
ε(s) = 1−
P
s
(s)
P
s2
= 1 −
E
b
(s)
E
b2
. (21)
The transmit power P
s2
and the energy E
b2
describe
the respective transmit power or energy-per-bit val-
ues obtained for the reference system (with s = 2 and
m = 0). For the transmit power and energy per bit
functions the notation P
s
(s) and E
b
(s) is used, respec-
tively, to emphasize their dependency on the variable
constellation size s as compared to the values P
s2
and
E
b2
for a single constellation size (s = 2). It is worth
noting that it is irrelevant whether the savings are cal-
culated by using the transmit power or the energy per
bit according to (21)—as both are linked by the fixed
bit rate f
B
.
The parameter ε(s) shows the achievable savings
very clearly. In Figure 14 and Figure 15 numerical
results are presented for the two cases of the cable
lengths (ℓ = 2km and ℓ = 0,5km): The power or
energy-per-bit savings ε(s) are depcited as functions
of the constellation size s. Only positive values of
ε(s) are shown in Figure 14 and Figure 15 as real sav-
ings in terms of transmit power or energy per bit are
depicted. According to (21) also negative results for
ε(s) can occur, especially for large constellation sizes:
Then the transmit power or energy per bit required at
those respective constellation size is higher than that
of the reference system – such results are not shown
in the Figures 14 and 15.
In Figure 14 it becomes obvious for the longer ca-
ble (ℓ = 2km) that at the lower bit rate of f
B
= 1MHz
approximately 25% savings can be achieved by (only)
using the optimum constellation size s
opt
= 4. When
staying at a (simple) system with s = 2 savings of
Improving Power and Energy Efficiency of Linearly Equalized Baseband Cable Transmission Links
23
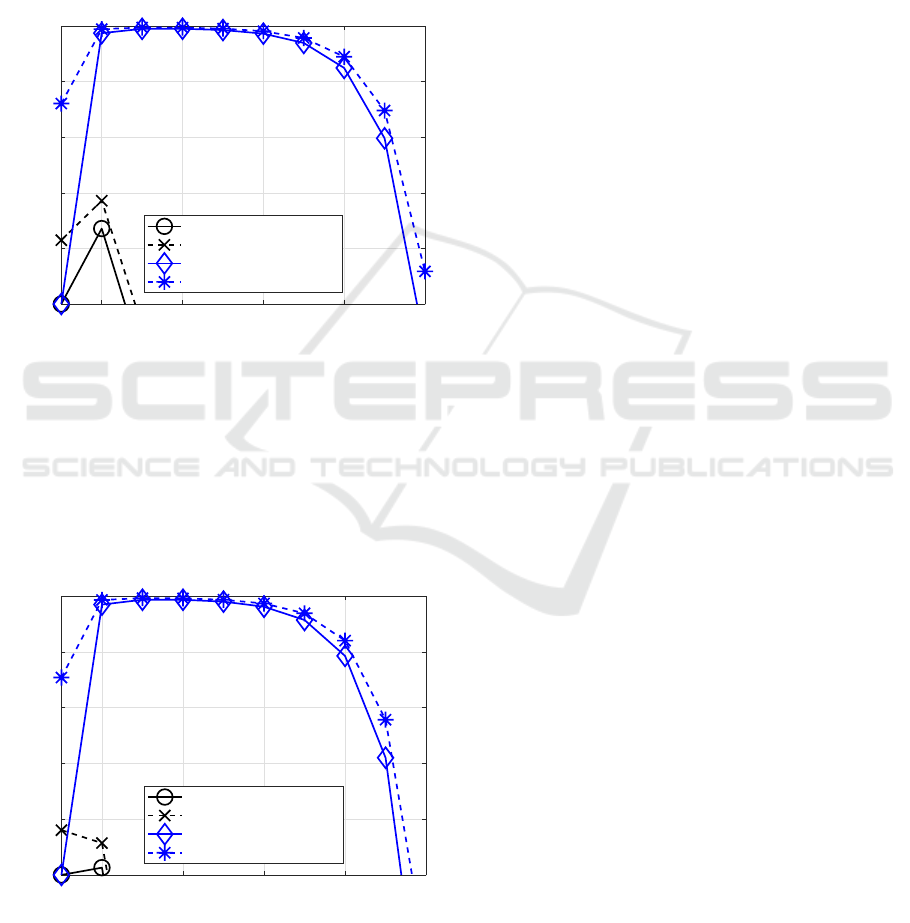
22% are registered if the equalization is uniformly
distributed to transmitter and receiver (m
opt
= 1).
When combining both and the system operates at op-
timum constellation size (s
opt
= 4) and optimal parti-
tioning of the equalization (m
opt
= 1) overall approx-
imately 38% can be saved in terms of transmit power
or energy per bit, respectively. At higher bit rates
the achievable savings are much more significant, e. g.
> 90% at a bit rate of f
B
= 10MHz for the given pre-
conditions.
2 4 6 8 10
0
0.2
0.4
0.6
0.8
1
ld(s) →
ε(s) →
f
B
= 1 MHz,m = 0
f
B
= 1 MHz,m = 1
f
B
= 10 MHz,m = 0
f
B
= 10 MHz,m = 1
Figure 14: Relative power or energy-per-bit savings ε(s),
respectively, as a function of the constellation size s for two
fixed bit rates f
B
for m = 0 and m = 1 (parameters: ℓ = 2km,
P
b
= 1,5· 10
−9
and Ψ
0
= 10
−12
V
2
/Hz).
In Figure 15 the achievable savings for the shorter
cable (ℓ = 0,5km) are depicted: In tendency the re-
sults allow for comparable insights as discussed for
the cable length of ℓ = 2km—now again at higher bit
rates.
2 4 6 8 10
0
0.2
0.4
0.6
0.8
1
ld(s) →
ε(s) →
f
B
= 10 MHz, m = 0
f
B
= 10 MHz, m = 1
f
B
= 150 MHz,m = 0
f
B
= 150 MHz,m = 1
Figure 15: Relative power or energy-per-bit savings ε(s),
respectively, as a function of the constellation size s for two
fixed bit rates f
B
for m = 0 and m = 1 (parameters: ℓ =
0,5km, P
b
= 1,5· 10
−9
and Ψ
0
= 10
−12
V
2
/Hz).
When considering the conventional two-level
transmission (s = 2) with complete linear equaliza-
tion in the receiver (m = 0) as reference, the savings
of optimized transmission – with s
opt
and m
opt
– can
be moderate in a range of 15. . .40% at the lower bit
rates and they can become as high as > 80% for the
higher bit rates at the different cable lengths.
The achievable relative savings in terms of trans-
mit power and energy per bit depend on the concrete
values of the given parameters, in particular cable
length ℓ (and characteristic cable frequenz f
0
) and bit
rate f
B
, i. e., on the interrelationship of signal band-
width and low-pass characteristic of the cable. The
achievable improvements by using optimum constel-
lation sizes and optimal partitioning of the equaliza-
tion to transmitter and receiver in terms of transmit
power and energy per bit are especially high in cases
when the transmission system operates at high bit
rates in relation to the band limitation induced by the
cable’s low pass characteristic.
In real communication networks a vast multitude
of transmission links – in particular in access net-
works – is established and operated: The optimiza-
tion of those transmission systems with regard to de-
grees of freedom in design and adaptation processes
provides substantial overall power and energy saving
potential.
4 CONCLUSION
Powerand energyefficiencyof baseband transmission
in linearly equalized copper cable channels have been
studied. In a first part, the investigations have focused
on the dependency of the transmit power P
s
and the
energy per bit E
b
on the constellation size s—which
represents a degree of freedom in the design of trans-
mission systems. The bit rate f
B
and the transmission
quality (P
b
) as well as the channel characteristics of
cable (ℓ, f
0
)) and noise (Ψ
0
) have been considered
preconditions.
The transmit power P
s
and the energy per bit E
b
depend on the constellation size s. There is an opti-
mum constellation size s
opt
where the transmit power
or energy per bit show a minimum. The optimum con-
stellation size s
opt
depends on the interrelationship be-
tween signal bandwidth and cable low-pass character-
istic, i.e., the interdependency between f
B
, ℓ (and f
0
)
is important.
In a second part, the partitioning of the linear
equalization has been identified to be another degree
of freedom in transmission engineering of cable trans-
mission systems: The related optimization showed
that a uniform distribution of the equalization to trans-
SENSORNETS 2022 - 11th International Conference on Sensor Networks
24

mitter and receiver results in a minimum transmit
power P
s
or energy per bit E
b
, respectively, with re-
spect to the equalization parameter m.
Overall significant transmit power or energy-per-
bit savings can be achieved as compared to conven-
tional two-level systems with complete linear equal-
ization at the receiver side. When assuming already
optimized constellation sizes the optimization of the
equalization enables a further lowered power and en-
ergy demand.
The optimization of the constellation size and
the equalization in wired transmission systems is an
important pre-requisite for energy-efficient transmis-
sion. It can help to operate communication networks
sustainably since such networks usually consist of a
large multitude of various kinds of transmission links.
Furthermore it may allow for energy-efficient load-
adaptive transmission by adapting the transmission
capabilities to temporally fluctuating traffic demands.
For future work it is very interesting to analyze
the computational complexity that is necessary to per-
form the optimization and to control the settings for
the transmission system considered in this contribu-
tion: Besides the transmit power – and the energy per
bit resulting thereof – that is needed for the pure trans-
mission additional power and energy is necessary to
control the system and its individual elements and
blocks to operate at optimum constellation size and
optimized partitioning of the equalization.
ACKNOWLEDGEMENTS
The authors thank the anonymous reviewers for help-
ful hints and suggestions that lead to improvements of
the paper.
REFERENCES
Agrell, E. and Karlsson, M. (2009). Power-Efficient Mod-
ulation Formats in Coherent Transmission Systems.
Journal on Lightwave Technology, 27(22):5115–
5126.
Anderson, J. B. (2005). Digital Transmission Engineering.
IEEE Press; John Wiley & Sons, Piscataway, NJ, 2nd
edition.
Bolla, R., Bruschi, R., Davoli, F., and Cucchietti, F. (2011).
Energy Efficiency in the Future Internet: A Survey
of Existing Approaches and Trends in Energy-Aware
Fixed Network Infrastructures. IEEE Communica-
tions Surveys & Tutorials, 13(2):223–244.
Kilper, D., Guan, K., Hinton, K., and Ayre, R. (2012).
Energy Challenges in Current and Future Optical
Transmission Networks. Proceedings of the IEEE,
100(5):1168–1187.
Kilper, D. C., Atkinson, G., Korotky, S. K., Goyal, S., Vet-
ter, P., Suvakovic, D., and Blume, O. (2011). Power
Trends in Communication Networks. IEEE Journal of
Selected Topics in Quantum Electronics, 17(2):275–
284.
Kilper, D. C., Neilson, D., Stiliadis, D., Suvakovic, D., and
Goyal, S. (2010). Fundamental Limits on Energy Use
in Optical Networks. In 36th European Conference
and Exhibition on Optical Communication, pages 1–
6.
Lambert, S., Van Heddeghem, W., Vereecken, W., Lan-
noo, B., Colle, D., and Pickavet, M. (2012). World-
wide Electricity Consumption of Communication
Networks. Optics Express, 20(26):B513–B524.
Lange, C. and Ahrens, A. (2021). Power and Energy Effi-
ciency Optimization of Baseband Transmission Links.
In Signal Processing Symposium (SPSympo), pages
147–152, Lodz (Poland).
Lange, C., Kosiankowski, D., Weidmann, R., and Glad-
isch, A. (2011). Energy Consumption of Telecom-
munication Networks and Related Improvement Op-
tions. IEEE Journal of Selected Topics in Quantum
Electronics, 17(2):285–295.
Lange, C., Preuschaft, J., Braune, M., and Gieschen, N.
(2008). Migration from Current DSL-Based Architec-
tures to Future-Proof Pure Optical Access Networks.
In 13th European Conference on Networks & Opti-
cal Communications (NOC), pages 152–159, Krems
(Austria).
McCune, E. (2013). This Emperor Has No Clothes? IEEE
Microwave Magazine, 14(4):48–62.
Pickavet, M., Vereecken, W., Demeyer, S., Audenaert, P.,
Vermeulen, B., Develder, C., Colle, D., Dhoedt, B.,
and Demeester, P. (2008). Worldwide Energy Needs
for ICT: The Rise of Power-Aware Networking. In
2008 2nd International Symposium on Advanced Net-
works and Telecommunication Systems, pages 1–3.
Proakis, J. G. and Salehi, M. (2008). Digital Communica-
tions. McGraw-Hill, Boston; New York; San Fran-
cisco, 5th edition.
Shumate, P. W. (2008). Fiber-to-the-Home: 1977–2007.
Journal of Lightwave Technology, 26(5):1093–1103.
Sklar, B. (2001). Digital Communications. Prentice Hall,
Upper Saddle River, NJ, 2nd edition.
Tsiropoulou, E. E., Katsinis, G. K., and Papavassiliou, S.
(2012). Distributed Uplink Power Control in Multi-
service Wireless Networks via a Game Theoretic Ap-
proach with Convex Pricing. IEEE Transactions on
Parallel and Distributed Systems, 23(1):61–68.
Tucker, R. S. (2011a). Green Optical Communications Part
I: Energy Limitations in Transport. IEEE Journal of
Selected Topics In Quantum Electronics, 17(2):245–
260.
Tucker, R. S. (2011b). Green Optical Communications Part
II: Energy Limitations in Networks. IEEE Journal of
Selected Topics In Quantum Electronics, 17(2):261–
274.
Improving Power and Energy Efficiency of Linearly Equalized Baseband Cable Transmission Links
25
