
Analysis of Optimal Polarization State Sampling
Frequency Applied to Photoelastic Analyzer
Chih-Chung Yang
1
, Chih-Ning Hsu
1
, Yi-Yung Chen
2
, Yu-Hsuan Lin
1
, Hsin-Yi Tsai
1
,
Kuo-Cheng Huang
1
and Chun-Han Chou
*
,1
1
National Applied Research Laboratories, Taiwan Instrument Research Institute, 20 R&D Rd. VI,
Hsinchu Science Park, Hsinchu City 30076, Taiwan
2
Graduate Institute of Color & Illumination Technology,
National Taiwan University of Science and Technology, Taipei City 106335, Taiwan
Keywords: Photoelasticity, Stress, Phase Shift, Doublet Lens.
Abstract: In the paper, we proposed a low-cost photoelastic analysis system and used this system to measure the stress
distribution of the doublet lens. The doublet lens was measured by four types of sampling frequency. The
sampling frequency was 45 degrees, 22.5degrees, 11.25degrees and 5degrees. The different sampling
frequency data was used to build a chart which was the relationship between measurement error and sampling
frequency. The chart could help who used the method to choose a suitable sampling frequency and establish
the most efficient process of stress measurement. In the future, we hope to improve the photoelastic analysis
system to be fully automatic and apply it in the factory production line.
1 INTRODUCTION
In recent years, the optoelectronic industry has
flourished, and optoelectronic products have been
increasing day by day. The volume of optical
products continues to shrink, but the resolution
continues to improve. Therefore, the tolerance
requirements of optical components have become
more and more stringent. The problem of residual
stress in optical components has gradually attracted
attention. There will be residual stress during the
production, assembly and operation of optical
products The residual stress will directly affect the
accuracy and life of the product. Therefore, analyze
the internal stress of optical components and
eliminate residual stress has become the most
important problem in optical products.
Currently, the only way to measure the internal
stress state of a component is photoelastic
analysis(Holister, 1967). The measurement of
photoelastic is used to measure the stress and strain
on the surface or inside of the object by using the
polarization state of the light wave after passing
through the sample. In 1850 years, Maxwell proposed
Stress-optic Law and established the theoretical basis
*
Corresponding Author: bonochou@narlabs.org.tw
of photoelastic analysis(Aben etc., 2012). Many
researchers had published a lot of research on
photoelastic analysis technology based on this theory.
In 1979, Muller's team developed a fully automated
photoelastic analyzer using cameras and image
processing technology(Müller etc., 1979). The
principle was to capture five images from 0 degrees
to 90 degrees of isoclinic line and merged them into a
contour map. The contour map was used to determine
the internal stress distribution of the component. In
1986, Hecker's team developed a phase shift method
for stress measurement (Hecker etc., 1986). The
principle was to capture multiple images with
different angles of polarization. These pictures were
calculated by inverse trigonometric functions to
obtain isoclinic angle and fringe order. The
information of isoclinic angle and fringe order was
used to determine the internal stress distribution of
the component. In 1997, Petrucci's team combined
the phase shift method with color imaging
technology. It could reduce measurement errors
caused by wavelength (Petrucci etc., 1997). In 1998,
the Plouzennec team established a circularly
polarized light source photoelastic analysis system.
The system captured bright field and dark field
images to analysis the phase distribution and derived
106
Yang, C., Hsu, C., Chen, Y., Lin, Y., Tsai, H., Huang, K. and Chou, C.
Analysis of Optimal Polarization State Sampling Frequency Applied to Photoelastic Analyzer.
DOI: 10.5220/0010799900003121
In Proceedings of the 10th International Conference on Photonics, Optics and Laser Technology (PHOTOPTICS 2022), pages 106-110
ISBN: 978-989-758-554-8; ISSN: 2184-4364
Copyright
c
2022 by SCITEPRESS – Science and Technology Publications, Lda. All rights reserved
the stress distribution from the phase
distribution(Plouzennec etc., 1999).
In the traditional stress measurement technologies
and equipment, it usually needed a long time and
high-precision calibration or expensive components.
Therefore, in the paper, we have established a
photoelastic analysis system, a measurement process
and a stress algorithm. The advantage of the system
was low cost and short measurement time. In the last
section of the paper, the photoelastic analysis system
was used to measure the sample stress distribution
with different sampling frequency. The different
sampling frequency data was used to build a chart
which was the relationship between measurement
error and sampling frequency. The chart could help
who used the method to choose a suitable sampling
frequency and establish the most efficient process of
stress measurement.
2 PHOELASTIC ANALYSIS
SYSTEM INTEGRATION
The photoelastic analysis system was mainly
composed of LED Light source, Linear polarizer, 1/4
waveplate, Band pass filter and imaging system. The
relative position of the element of the system was
shown in Fig 1. These elements were commercially
available. These elements didn’t require customized
production, which could reduce the cost of system
construction. The bill of material table was shown in
Table 1.
Table 1: The Photoelasticity bill of material table.
Photoelasticity BOM
Items
Discription
1.
Light
source
Philips MR16 LED(4.2W) with
diffuser and collimator
2.
Linear
polarizer
Visible Linear Polarizing Film
(
Over 99% Polarizin
g
Efficienc
y)
3.
1/4
waveplate
Polymer Achromatic Retarder
(630-835nm)
4.
Band
pass filter
Transmission wavelength :
440-450 nm pass
5.
Imaging
System
STC-MCS163U3V
H x V pixels : 1440 x 1080
Pixel pitch: 3.45 x 3.45 um
Lens : M0814-MP2
In the system, there were several parameters that
must be paid attention to stability of output energy,
uniformity of spot irradiance, symmetrically of the
spot and the element relative levelness, when
assembling the system. In order to achieve high-
precision stress measurement, we formulate an
assembly and adjustment process, shown below:
Element relative levelness: The illumination
surface of light source was regarded as
reference level. Each element level error should
less than 1 um.
Stability of output energy: The visible light
sensor was used to measure the Light source
intensity error at different times. The Light
source intensity error should less than ± 1 uW
within 30 minutes.
Symmetrically of the spot and uniformity of
spot irradiance: The symmetry and unformity
of the spot was directly related to the inclination
angle of the 1/4 waveplate. Therefore, fine-tune
the 1/4 wave plate until the light spot was
unformity and symmetrically distributed,
shown as Fig 2.
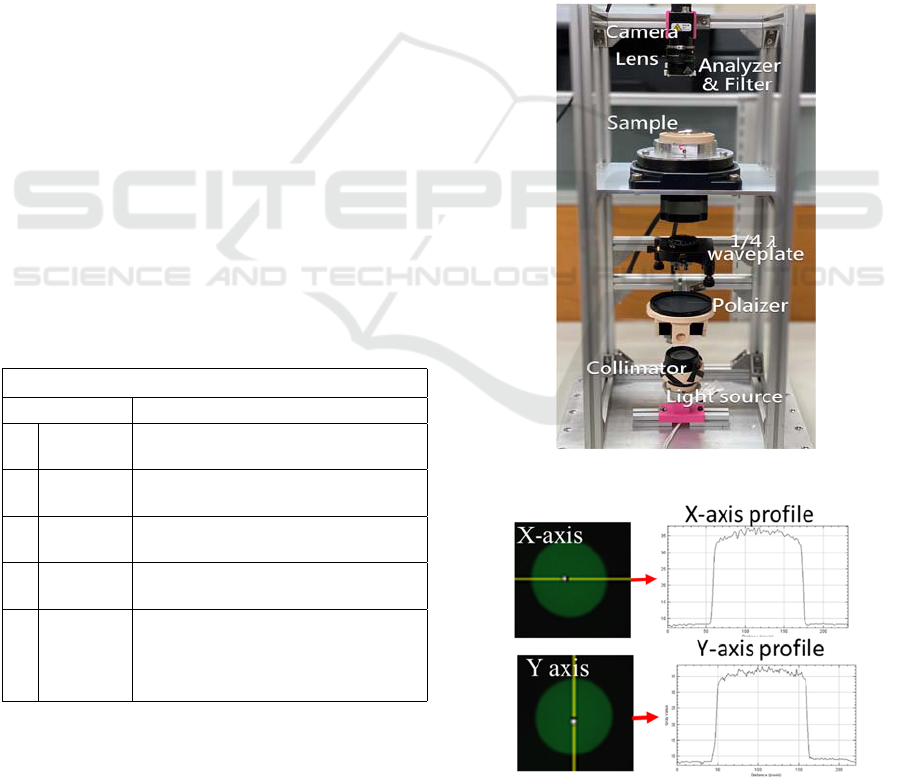
Figure 1: The photoelastic analysis system.
Figure 2: Analyze the symmetry and uniformity of the spot
by the cross-section of the spot.
Analysis of Optimal Polarization State Sampling Frequency Applied to Photoelastic Analyzer
107
Checking the light source polarization state: If
the relative directionality of Linear polarizer
and 1/4 waveplate was incorrect, the light will
become elliptically polarized after passing
through the 1/4 waveplate. Therefore, it was
necessary to rotate the 1/4 waveplate so that its
direction corresponds to the Linear polarizer.
When the light source was circularly polarized,
the intensity captured by the sensor was equal,
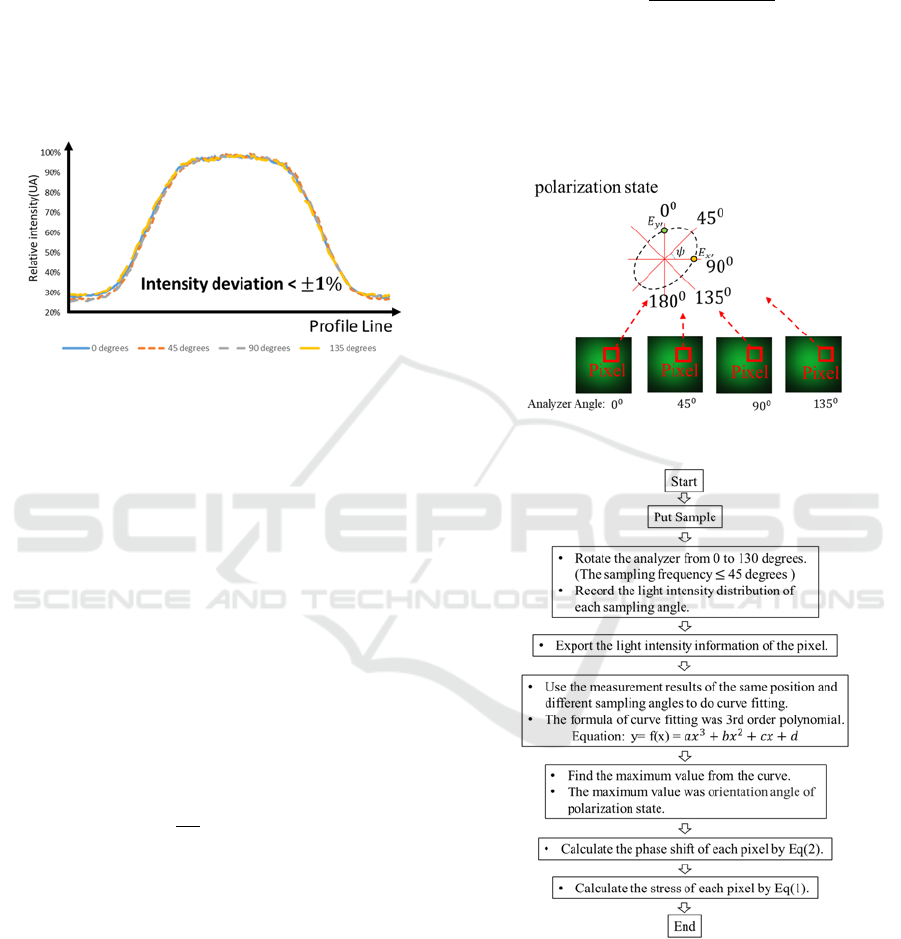
even rotating the analyzer, shown as Fig 3.
Figure 3: The light Spot intensity cross-section profile at the
different angle of analyzer.
It was the photoelastic Analysis System assembly
and adjustment process. After completing the above
steps, you could start to measure the stress of the
sample.
3 STRESS CALCULUS
The stress distribution and the phase difference
distribution are in a proportional relationship. When
the relative phase shift was measured, the relative
stress distribution could be derived. Therefore, the
stress measurement system should focus on how to
obtain the phase shift quickly and accurately. For the
phase shift and stress distribution formula was shown
as Eq. (1)
δ
𝐶𝜎
𝜎
(1)
Where 𝛅 is Phase retardation, t is Object Thickness,
C is Stress-optic coefficient and 𝜎
1
& 𝜎
2
is Principal
stresses.
In the paper, we used the phase shift method to
calculate stress. The principle was modulation the
input light wave into a circular polarization state and
analyze the polarization state of the light wave after
passing through the sample. The measurement
method of polarization state was to rotate analyzer
and capture the intensity of light spot at different
angle. According the different angle of sampling data,
the polarization state of each pixel could be derived,
shown as Fig 4.
When we got the polarization state of each pixel,
the phase shift could be derived. The formula was
shown below: Eq. (2)
𝑐𝑜𝑠φ
∗
∗
(2)
Where φ is the phase, ψ is the elliptical orientation
angle, E_x' is the maximum value of the E_x , E_y' is
the maximum value of the E_y.
Put the phase shift of each pixel into the Eq. (1)
and we could get the stress of each pixel. The process
of stress calculus was shown as Fig 5.
Figure 4: The method of polarization state calculus.
Figure 5: The process of stress calculation of photoelastic
analysis system.
4 STRESS MEASUREMENT AND
ANALYSIS
The previous section introduced the structure of the
photoelastic analysis system and stress calculation
PHOTOPTICS 2022 - 10th International Conference on Photonics, Optics and Laser Technology
108
method. The section presented the stress
measurement results and a average stress
measurement error chart. Here the doublet lens was
used as a sample. The sample diameter is 50 mm and
material is BK7. The material of glass lens does not
have a lot of stress. The stress in the doublet lens
mainly comes from the UV glue. In the experiment,
the” Norland Optical Adhesive 61” was used to
adhesive the double lens. The UV glue is cured by
ultraviolet light with maximum absorption within the
range of 320-380nm. The transmittance of UV glue is
over 90 % in the visible light. The UV glue refractive
index was 1.527 at liquid state. When the UV glue
was cured, the refractive index increased to 1.563.
Therefore, whether the glue was uniformly cured has
a great influence on the internal refractive index.
According to the optical theory proposed by Maxwell
in 1853, the change optical refractive index of a
transparent body was linearly proportional to the
stress. The relationship was as follows: Eq. (3)
𝑛
𝑛
𝐶𝜎
𝜎
(3)
Where n
0
& n
1
is the refractive index of each
principal stress direction in the material, C is Stress-
optic coefficient and 𝜎
0
& 𝜎
1
is Principal stresses.
According the above formula, the internal stress
of the doublet lens will be affected by the uniformity
of illumination and the Curing time. The light source
used in this experiment was a self-made UV light
source. The irradiation area was about 4 inches,
Irradiance uniformity > 90% @ irradiation area and
the average of Irradiance was 5 mW/𝑐𝑚
. Before the
doublet glue lens was cured, the double glue lens
needed to go through the process of glue dispensing,
kneading and homogenization. Generally, the
thickness of the doublet lens adhesive was 50um. The
curing time usually needed 5 minute by self-made UV
light source. In this experiment, the standard samples
were produced according to the above-mentioned
conditions.
Currently, Commercial stress measurement
equipment available usually only measured
information from four angles, and fitted the
polarization state of each pixel through the
information of the four angles. Because there were
only four angle information, it was easy to cause
errors. The easiest way to overcome this problem was
to increase the sampling frequency, but frequent
sampling will cause the measurement time to be too
long. Therefore, this paper would conduct intensive
sampling analysis and provided an optimal sampling
frequency analysis based on the measurement results.
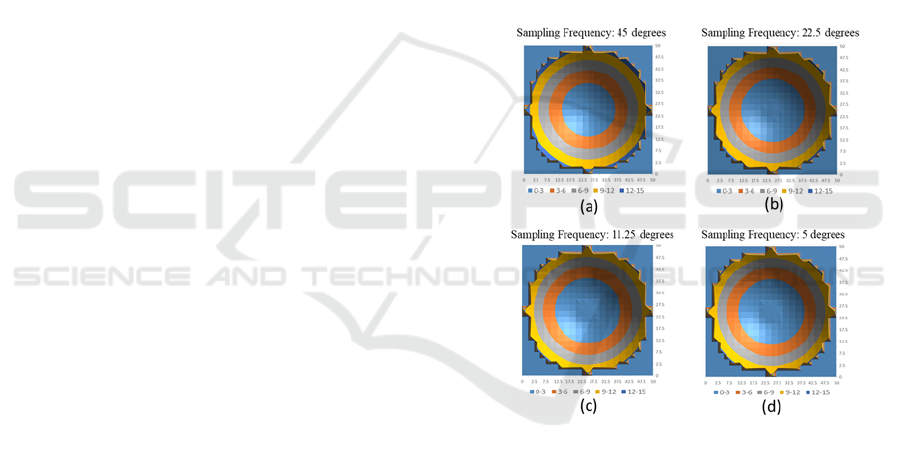
In this experiment, the sampling range was from
0 to 135 degrees and used 45 degrees, 22.5 degrees,
11.25 degrees and 5 degrees as the sampling
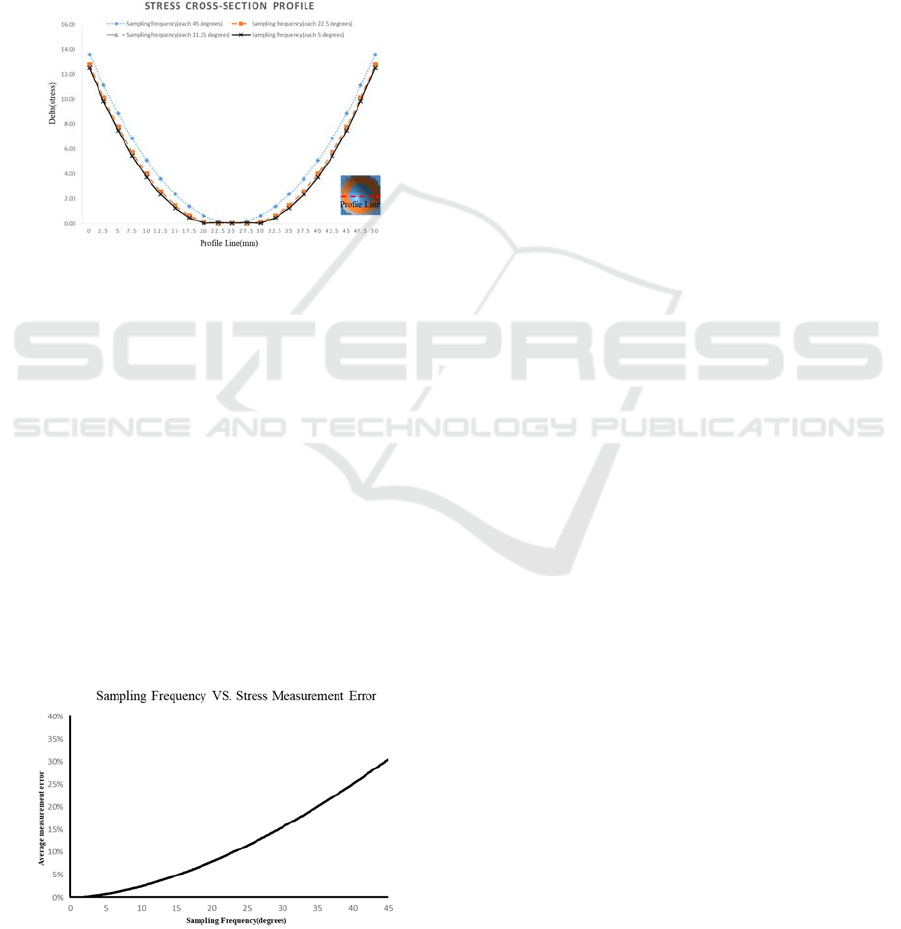
frequency. In the Fig 6, it shown the stress
distribution results at different sampling frequency.
For easy analysis, the X-axis cross-sectional profile
was obtained from the results of different sampling
frequencies for analysis, shown as Fig 7. Because the
5 degrees was highest sampling frequency, we
defined the measurement result of the 5 degrees
sampling frequency was the standard reference value.
According to the measurement results, when the
sampling frequency was higher, the measurement
error was smaller and closer to the reference value.
When the sampling angle was 11.25 degrees, the
stress cross section profile was almost overlaps with
the standard reference profile.
In order to obtain the parameters between
sampling frequency and measurement error, we used
the 5 degrees sampling angle as the standard
reference data, and calculated the average stress
measurement error with the results of other sampling
angles, shown as Fig 8. According the results, when
the sampling angle was less than 15 degrees, the
average stress measurement error was less than 5%.
Figure 6: The results of stress distribution at different
sampling frequency. (a) Sampling Frequency: 450. (b)
Sampling Frequency: 22.50. (c) Sampling Frequency:
11.250. (d) Sampling Frequency: 50.
5 DISCUSSION
In the doublet lens, the UV glue will generate stress
during the curing process. The stress will directly
affect the effective focal length of the doublet lens.
When the effective focal length changes, the optical
quality of the imaging system will also decrease.
Therefore, in the paper, we have established a
photoelastic analysis system, a measurement process
and a stress algorithm. The photoelastic analysis
system was used to measure the sample stress
Analysis of Optimal Polarization State Sampling Frequency Applied to Photoelastic Analyzer
109
distribution with different sampling frequency. The
different sampling frequency data was used to build a
chart which was the relationship between
measurement error and sampling frequency. The
chart could help who used the method to choose a
suitable sampling frequency. In this experiment, the
sampling range was from 0 to 135 degrees and used
45 degrees, 22.5 degrees, 11.25 degrees and 5 degrees
as the sampling frequency. Among them, the 5
degrees data was used to be standard reference data
and compared the reference data with the results of
other sampling frequencies.
Figure 7: The chart of cross-section profile of stress.
According to the measurement results, when the
sampling frequency was higher, the measurement
error was smaller and closer to the reference stress
distribution. When the sampling angle was 11.25
degrees, the stress cross section profile was almost
overlaps with the standard reference profile. In order
to obtain the parameters between sampling frequency
and measurement error, we used the 5 degrees
sampling angle as the standard reference data, and
calculated the average stress measurement error with
the results of other sampling angles. According the
results, when the sampling angle was less than 15
degrees, the average stress measurement error was
less than 5%. If people want to keep the measurement
speed and accuracy, the recommended sampling
frequency angle of photoelastic analysis system was
15 degrees.
Figure 8: The chart of average stress measurement error.
6 CONCLUSION
In the paper, we proposed a low-cost photoelastic
analysis system and used this system to measure the
stress distribution of the doublet lens. The doublet
lens was measured by four types of sampling
frequency. The sampling frequency was 45 degrees,
22.5degrees, 11.25degrees and 5degrees. We used the
measurement stress curve of 5 degrees to be a
reference. When the sampling frequency was
increased, the measure stress curve was closed to the
reference curve. Finally, we used the error of different
sampling frequency to build up a sampling frequency
and measurement error curve. Users could set the
sampling frequency according to their own
measurement accuracy requirements. In the future,
we hope to improve the photoelastic analysis system
to be fully automatic and apply it in the factory
production line.
ACKNOWLEDGEMENTS
The authors would like to express their appreciation
for financial aid from the Ministry of Science and
Technology. R.O.C, number MOST 109-2622-E-
492-011-CC3.
REFERENCES
GS Holister. (1967). Experimental stress analysis:
principles and methods. CUP Archive.
Aben, H., & Guillemet, C. (2012). Photoelasticity of glass.
Springer Science & Business Media.
Müller, R. K., & Saackel, L. R. (1979). Complete automatic
analysis of photoelastic fringes. Experimental
Mechanics, 19(7), 245-251.
Hecker, F. W., & Morche, B. (1986). Computer-aided
measurement of relative retardations in plane
photoelasticity. In Experimental stress analysis (pp.
535-542). Springer, Dordrecht.
Petrucci, G. (1997). Full-field automatic evaluation of an
isoclinic parameter in white light. Experimental
Mechanics, 37(4), 420-426.
Plouzennec, N., & Lagarde, A. (1999). Two-wavelength
method for full-field automated photoelasticity.
Experimental mechanics, 39(4), 274-277.
PHOTOPTICS 2022 - 10th International Conference on Photonics, Optics and Laser Technology
110
