
SysML Models Verification Relying on Dependency Graphs
Ludovic Apvrille
1 a
, Pierre De Saqui-Sannes
2 b
, Oana Hotescu
2 c
and Alessandro Tempia Calvino
3 d
1
LTCI, Telecom Paris, Institut Polytechnique de Paris, France
2
ISAE-SUPAERO, Universit
´
e de Toulouse, France
3
LSI,
´
Ecole Polytechnique F
´
ed
´
erale de Lausanne, Switzerland
Keywords:
MBSE, SysML, Formal Verification, Model Checking.
Abstract:
Formal verification of SysML models contributes to early detection of design errors early in the life cycle of
systems. Incremental modeling of systems leads to the repeated verification of parts of systems models that
were already verified in previous versions of the SysML model. This paper proposes to optimize the verifi-
cation process by generating dependency graphs from SysML models. This revisited verification technique is
now supported by TTool. It is illustrated with an Avionics Full DupleX network.
1 INTRODUCTION
The Systems Modeling Language, (OMG, 2017) or
SysML for short, is an international standard at OMG
and currently under revision to give birth to a new
standard named SysML v2 (OMG, 2020). Modeling
with SysML is more than just drawing the different
diagrams. Formal verification tools, such as model
checkers, offer possibilities to check SysML models
against their expected properties.
A model-checker takes as input a model and a
property, and outputs a result (true/false). The paper
shows how model-checking from SysML models can
be more efficient by using dependency graphs. The
main idea behind this contribution is to compute a re-
duced model of the SysML model that is sufficient to
prove the property of interest: because the resulting
model is smaller, the proof is expected to be faster, as
illustrated in this paper with a case study.
Moreover, assuming a model m of system s has
been checked and needs to be updated to integrate
new requirements, what will be the price of formally
verifying an updated model m
0
of s? In other words,
could we avoid entirely re-verifying m
0
? This paper
positively answers to these questions. Again, the pro-
posed solution relies on dependency graphs.
This paper sketches the dependency graph gener-
ation algorithm and relies on a case study to show the
a
https://orcid.org/0000-0002-1167-4639
b
https://orcid.org/0000-0002-1404-0148
c
https://orcid.org/0000-0001-6612-8574
d
https://orcid.org/0000-0003-1312-2907
efficiency of its implementation in the free software
TTool (TTool, 2021; de Saqui-Sannes et al., 2021),
both for the proof of reachability and liveness proper-
ties.
Section 2 formally defines a subset of SysML.
Section 3 introduces dependency graphs. It also
presents the algorithms implemented by TTool to gen-
erate dependency graphs from SysML models. Sec-
tion 4 discusses a case study. Section 5 surveys re-
lated work. Section 6 concludes the paper and out-
lines future work.
2 SysML
The SysML V1 standard (OMG, 2017) defines nine
types of diagrams that may be used inside one model
to cover the requirement capture, analysis and design
phases in the life cycle of systems. During the design
phase, one defines the architecture of the system using
Block Definition Diagrams (BDD) and Internal Block
Diagrams (IBD). This paper merges BDD and IBD
into one diagram: the Block Instance Diagram (BID).
Each block instance has a behavior expressed in the
form of a SysML state machine diagram.
2.1 Block Instance Diagram
A Block Instance Diagram contains a set of block in-
stances that can be composed together, and associated
through port relations.
Definition: Block Instance. A block instance is a
174
Apvrille, L., De Saqui-Sannes, P., Hotescu, O. and Calvino, A.
SysML Models Verification Relying on Dependency Graphs.
DOI: 10.5220/0010792900003119
In Proceedings of the 10th International Conference on Model-Driven Engineering and Software Development (MODELSWARD 2022), pages 174-181
ISBN: 978-989-758-550-0; ISSN: 2184-4348
Copyright
c
2022 by SCITEPRESS – Science and Technology Publications, Lda. All rights reserved

7-tuple B = hid, A, M, P, S
i
, S
o
, smdi where:
• id is a String that names the block instance.
• A is an attribute list. The attribute types in-
clude Integer, Boolean, Timer, and user-defined
Records. An attribute may be defined with an ini-
tial value.
• M is a set of methods.
• P is a set of ports.
• S
i
and S
o
are sets of input and output signals.
• smd is a state machine diagram.
Definition: Block Instance Diagram. A Block
Instance Diagram models the architecture of a system
as a graph of interconnected block instances. More
formally, a Block Instance Diagram D is a 3-tuple
D = hB , connect, associ. We denote by S
i
the set of
all input signals of B, by S
o
the set of all output signals
of B and by P the set of all ports of B.
• B is a set of block instances.
• connect is a function P × P →
{No, synchronous,asynchronous} that returns the
communication semantics between two ports (
/
0 ,
synchronous or asynchronous).
• assoc is a function (B ×S
o
× B × S
i
) → Bool that
returns true if one output signal of a block is asso-
ciated to an input signal of a block.
2.2 State Machine Diagram
Each block instance contains one finite state machine
that supports states, transitions, attribute settings, in-
puts and outputs operations on signals, and temporal
operators such as delays and timers.
Definition: State Machine. A finite state ma-
chine depicted by a SysML state machine diagram is
a bipartite graph hs0, S, T i where
• S is a set of states (s
0
is the initial state).
• T is a set of transitions.
Definition: State Transition. A transition is a 5-
tuple hs
start
, a f ter, condition, Actions, s
end
i where:
• s
start
is the initial state of the transition.
• a f ter(t
min
,t
max
) enables firing the transition only
after between t
min
and t
max
time units have
elapsed.
• condition is a Boolean expression that conditions
the execution of the transition.This Boolean ex-
pression can use block attributes.
• Actions is a ordered set of action. These actions
can be executed only once the transition has been
enabled, i.e., when the a f ter clause has elapsed
and the condition equals true.
• s
end
is the final state of the transition.
2.3 Formal Verification with TTool
TTool (TTool, 2021; Apvrille et al., 2020) is a free
and open source framework for the design and ver-
ification of embedded systems. The TTool model
checker (Calvino and Apvrille, 2021) inputs SysML
models enriched with safety properties to be verified
and outputs a yes-no answer for each property. In
practice, the TTool model checker takes as input (1)
a block instance diagram and the state machine dia-
grams modeling the inner workings of the blocks, and
(2) properties formally expressed using a CTL-based
language.
3 DEPENDENCY GRAPHS
This section formalizes the verification problem ad-
dressed by the paper. A design is made up of a
(1) SysML block instance diagram and its associated
state machines, and (2) a set of properties. A verifi-
cation process is defined and dependency graphs are
used to simplify the proof associated with that verifi-
cation process.
3.1 Definition of a System
Definition 1 . A System has a Design and a set of
Properties to be verified, as defined in (Calvino and
Apvrille, 2021) .
S = hD, Pi (1)
3.2 Proving a Property over a System
Definition 2 . Let us define prover as a function that
takes a Design D and a Property p as input. prover
returns true if p is satisfied by D (also denoted as D |=
p), f alse otherwise.
prover(D, p ∈ P) =
(
true if p is satisfied by D
f alse Otherwise
(2)
The objective of this work is to decrease the com-
plexity of the prover() function (2).
SysML Models Verification Relying on Dependency Graphs
175
3.3 Optimizing Proofs
To prove a property, a prover considers the whole de-
sign, even if some elements of the design are not in-
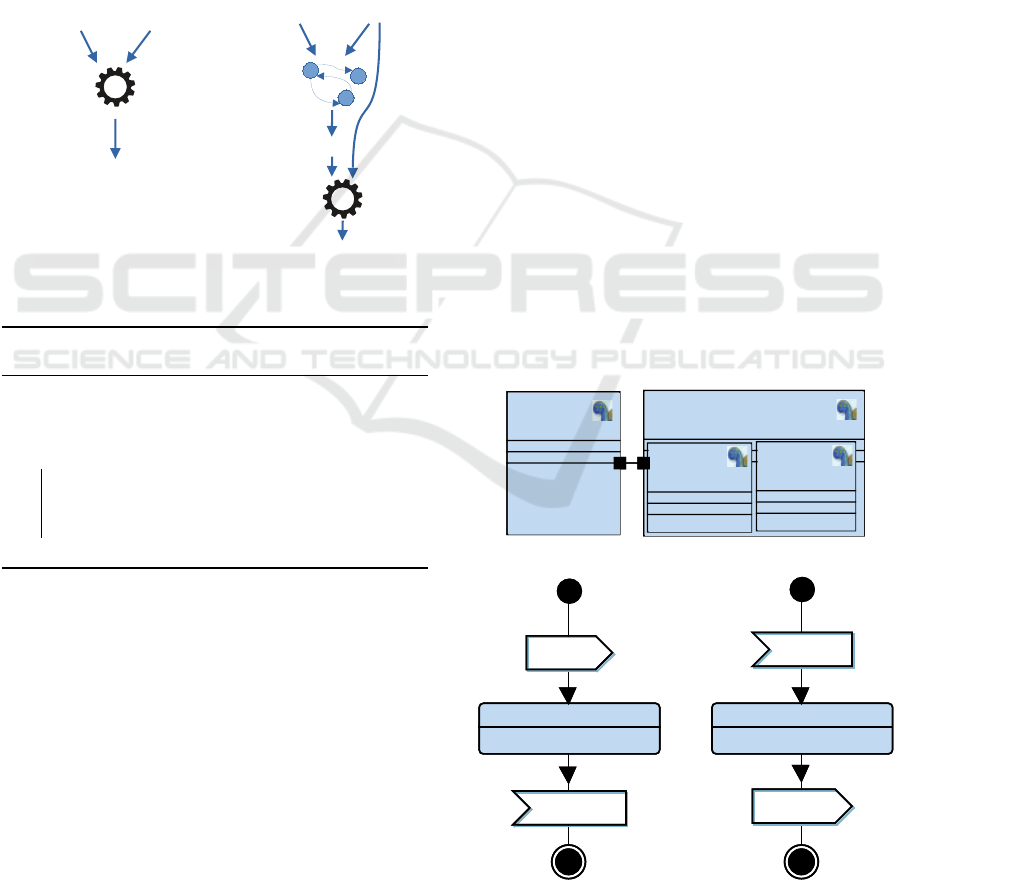
volved in this proof, as depicted by the left part of
Figure 1.
The right part of Figure 1 illustrates the main idea
behind this paper’s contribution. The purpose of this
contribution is to eliminate parts of the models that
may slow down the proof without impacting the proof
result. The proposed solution is to compute a depen-
dency graph from the input model D, then to reduce
D to D
0
according to p, and then to use D
0
and p as
input for the prover (see Algorithm 1).
D
p
prover
True / false
D
p
prover
Dependency
Graph
D’
True / false
Figure 1: Proofs without/with dependency graphs.
Algorithm 1: Use of dependency graphs to simplify
proofs.
Data: D, P
Result: ∀p ∈ P, result
p
= prover(D, p)
1 DG = computeGraph(D)
2 foreach p ∈ P do
3 DG
p
= reduceGraph(DG, p)
4 D
p
= graphToModel(DG
p
)
5 result
p
= prover(D
p
, p)
6 end
3.4 Design to Dependency Graph
A dependency graph can be computed from a block
instance diagram D (Algorithm 2).
DG = computeGraph(D)
For each smd of B ∈ Bl, for each element of the
state machine (states, afters, conditions, actions), we
generate a vertex v
e
in DG (line 4). Then, the al-
gorithm looks for two elements and checks whether
these two elements are read and write operators con-
nected through a channel (line 7, cond
1
). If this is
the case, then a new vertex is added for each operator
(line 9, v
1
and v
2
, and an edge is created in line 10 be-
tween the vertex of the writer (v
1
) to the vertex of the
reader (v
2
). Then, the new vertices v
1
and v
2
are con-
nected to the rest of the graph as follows. (i) Edges
from the operator vertex to v
1
and v
2
and (ii) edges
between the v
1
/ v
2
to the vertex of the next operators
of the writer and the reader in the state machine (lines
11 to 14). Last, if the communication between the
two operators is synchronous (cond
2
, line 16) then an
edge is also added from the reader to the writer: in-
deed, the latter must wait for the former to be ready to
perform the (synchronous) write operation. If the two
selected elements do not correspond to a pair (writer,
reader), then an edge is simply added between their
respective vertices according to the links specified in
their state machines (line 18). Finally, the dependency
graph is built upon control flow dependencies (links
of the state machines) and communication dependen-
cies (asynchronous, synchronous). Finally, the depen-
dency graph captures all the elements of the system
(blocks, state machines, communications), with a fo-
cus on the dependencies between these elements.
Let us use a toy example to illustrate the con-
struction of a dependency graph with a simple client-
webserver system. To handle two requests in parallel,
the webserver needs two instances. Blocks Client and
Webserver are connected by their respective ports to
convey signals query and answer. The state machines
of Client and Instance1 are depicted on the left and
right parts of Figure 3, respectively. Instance2 and
Instance1 have the same state machine.
block
Client
~ out query()
~ in answer()
block
Webserver
~ in query()
~ out answer()
block
Instance2
block
Instance1
block
Client
~ out query()
~ in answer()
block
Webserver
~ in query()
~ out answer()
block
Instance2
block
Instance1
Figure 2: Internal block diagram of the toy system.
Waiting Anwering
query()
query()
answer()
answer()
Waiting Anwering
query()
query()
answer()
answer()
Figure 3: State machine diagrams: Client (left) and In-
stances (right).
MODELSWARD 2022 - 10th International Conference on Model-Driven Engineering and Software Development
176
Algorithm 2: Building a dependency graph from a
model.
Data: D
Result: DG
1 DG = emptyGraph
2 foreach smd of Bl of D do
3 foreach elt ∈ smd do
4 DG ] vertex(elt)
5 end
6 foreach elt
1
, elt
2
∈ smd
2
do
7 cond
1
= isSending(elt
1
)∧
isReceiving(elt
2
) ∧ connect(
block(elt
1
), signal(elt
1
), block(elt
2
),
signal(elt
2
))! = ”No”
8 if cond
1
then
9 DG ] v
1
= vertex(elt
1
to elt
2
) ]
v
2
= vertex(elt
2
to elt
1
)
10 ]edge(v
1
, v
2
)
11 ]edge(vertex(elt
1
), v
1
)
12 ]edge(v
1
, vertex(next(elt
1
))
13 ]edge(vertex(elt
2
), v
2
)
14 ]edge(v
2
, vertex(next(elt
2
))
15 cond
2
= isSending(elt
1
) ∧
isReceiving(elt
2
) ∧
connect(block(elt
1
), signal(elt
1
),
block(elt
2
), signal(elt
2
)) ==
”synchronous”
16 cond
2
=⇒ DG ] edge(v
2
, v
1
)
17 else
18 link(elt
1
, elt
2
) =⇒ DG ]
edge(vertex(elt
1
), vertex(elt
2
))
19 end
20 end
21 end
The resulting dependency graph (Figure 4) shows
in green the start of Client. One can notice that the
Client depends on a synchronization with either In-
stance1 (top left) or Instance2 (down right).
Figure 4: Sub dependency graph of the toy system.
3.5 Reducing a Graph with Regards to
a Property
Graph reduction consists in marking the vertices re-
lated to the selected property p, and then removing all
vertices that are on no path between start vertices and
property vertices. The CTL property explicitly refers
to a list of operators in D. Indeed, in TTool, CTL
properties can either relate to a state of a block (e.g.,
E <> Block
1
.state
1
means the reachability of state
1
in Block
1
) or can refer to attributes of blocks (e.g.,
A[]Controller. pressure > 0&&Controller.pressure <
Controller.threshold expresses that in all the system
states, the pressure attribute of block Controller must
be between 0 and threshold). Algorithm 3 first com-
putes V
p
, the list of vertices corresponding to the oper-
ators (e.g., states) referred to by p. Then, each vertex
of D is added to the reduced graph DG
p
if there exists
a path from v to at least one vertex in V
p
. Finally, if
two vertices of DG are in DG
p
, then all edges between
these two vertices are also added to DG
p
. Finally, we
expect that proving a property on the reduced system
is equivalent to proving it on the original system. Ob-
viously, if a property influences the whole graph then
there is no reduction. Parts of the graph that are not
influenced by the property can instead be pruned.
Algorithm 3: Reduction of dependency Graphs: re-
duceGraph().
Data: D, DG, p
Result: DG
p
1 V
p
= listO fVertices(D, p)
2 foreach vertex v ∈ DG do
3 path(v,V
p
) → DG
p
] v
4 end
5 foreach vertex v1, v2 ∈ DG
2
do
6 e = edge(v1, v2) 6=
/
0 → DG
p
] e
7 end
3.6 Back to a (SysML) Model from a
Dependency Graph
Since a dependency graph references all the model
elements, it is possible to reconstruct the initial model
from a dependency graph. Since our prover takes as
input a model (and a property), once the dependency
graph has been reduced according to a given property,
we can rebuild a new model from the reduced graph.
The new model is reduced with regards to the original
one, which means it contains fewer, or the same
number of operators as the original model.
SysML Models Verification Relying on Dependency Graphs
177
3.7 Dependency Graphs for Model
Updates
D
p
prover
True / false
D’
p
prover
Dependency
Graphs
(2) else
True / false
DG
DG’
(1) DG == DG’ ?
Figure 5: Decreasing proof complexity using dependency
graphs.
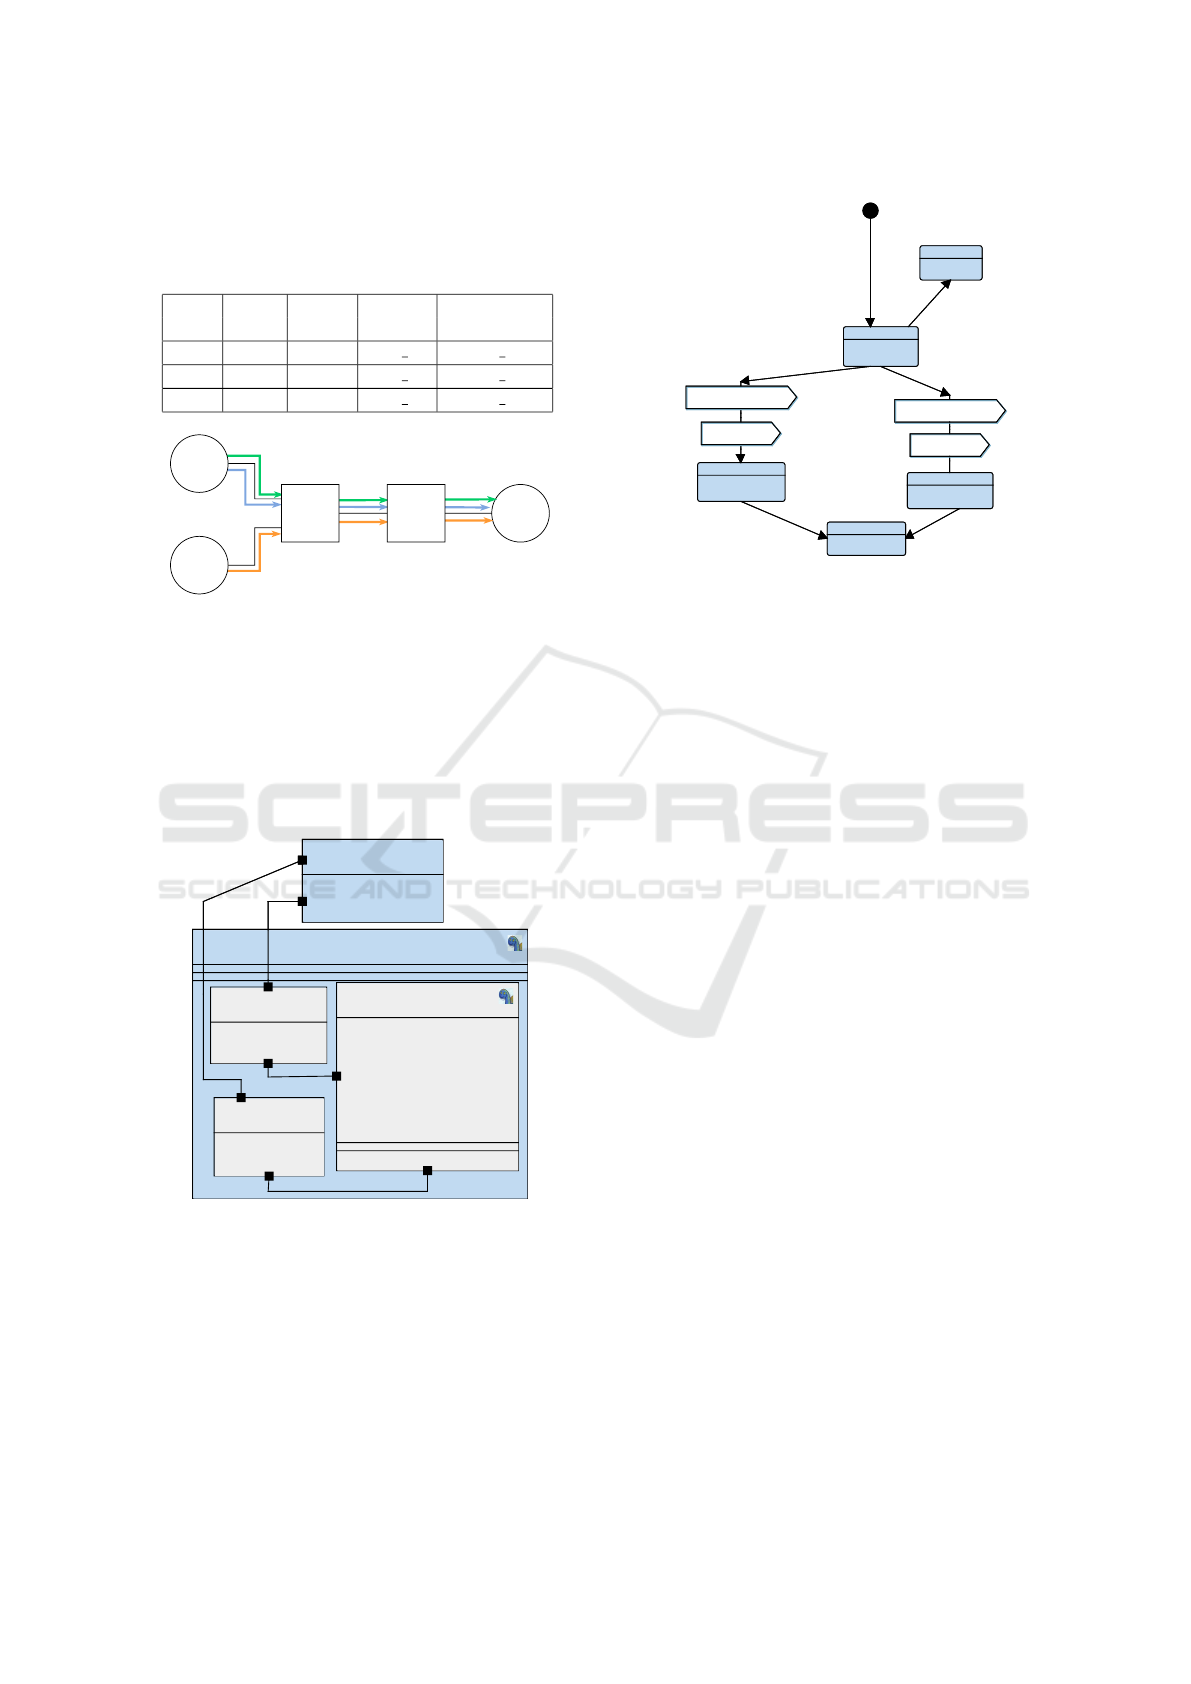
Figure 5 depicts another usage of dependency graphs.
The goal is to avoid reproving properties after a
SysML model was updated. Those properties im-
pacted by the model update are the only ones that need
to be proven again. For this, as shown on the left part
of Figure 5, a property p is first proved on a design
D using a dependency graph DG. Then, D is updated
as D
0
. To know whether p must be proved again on
D
0
, the dependency graph DG
0
is generated and then
compared with DG. If DG is equivalent according to
a bisimulation relation to DG
0
, the proof of p made
on D is still valid for D
0
. Otherwise, p must be proved
for D
0
. This approach is summarized by algorithm 4
(which is implemented by TTool).
Algorithm 4: Use of dependency graphs to simplify
proofs.
Data: D, D
0
, P
Result: DG
1 DG
0
= computeGraph
2 foreach p ∈ P do
3 DG = computeGraph(D, p)
4 DG
0
= computeGraph(D
0
, p)
5 if DG ≡ DG
0
then
6 result
p
0
= result
p
7 else
8 result
p
0
= prover(DG
0
, p)
9 end
10 end
4 CASE STUDY
A distributed system illustrates how dependency
graphs can reduce the proof complexity.
4.1 AFDX Network
AFDX (Avionics Full DupleX switched Ethernet) is
the de facto embedded avionics network, deployed in
Airbus A380 and A350 civilian aircrafts, to transport
command and control data flows between distributed
systems running avionics applications in the flight do-
main. These applications are time-critical. Therefore,
the AFDX communication network has to provide a
set of guarantees, such as the arrival of messages at
the destination application before a deadline, the re-
ception of messages in the transmission order, the ab-
sence of loss of messages due to buffer overflow or
to some failure. The first requirement can be ensured
with worst-case delay analysis methods such as the
well-known Network Calculus (Frances et al., 2006),
while the others can be verified with formal meth-
ods such as the model-based approach discussed in
this paper. An AFDX network typically has a set of
network interfaces called ‘End Systems’ (ES), each
one corresponding to an avionics module, intercon-
nected by switches and communication links. Ded-
icated unidirectional communication channels called
Virtual Links (VLs) connect ES. A VL is specified
with a minimum and maximum frame length (be-
tween 64 bytes and 1,518 bytes) and the Bandwidth
Allocation Gap (BAG), i.e., the minimum interval be-
tween consecutive frames. This interval is enforced
at the emitting ES by a traffic regulator and veri-
fied at switch level by a filtering and policing func-
tion. Possible BAG values are in the set of powers
of 2
k
, k ∈ {0, 1, . . . , 7}. Multicast routes are defined
for each VL by static switching tables implemented
by each switch in the network. ES using multiple
VLs and switches output ports crossed by several VLs
need a scheduling mechanism to select frames requir-
ing access to the same physical link. Typical Schedul-
ing policies are FIFO, Static Priority Queuing (SPQ),
and local table scheduling (Hotescu et al., 2019).
4.2 AFDX Model in SysML
To formally verify the above listed properties of the
AFDX network, we model in SysML the AFDX
mechanisms enforcing communication flows between
end systems
1
. Our model considers two emitting end
systems, two switches and a receiving end system.
1
The model is available from TTool: File, then ”Open
project from TTool repository”. Then, select ”AFDX”
MODELSWARD 2022 - 10th International Conference on Model-Driven Engineering and Software Development
178
Flows of data are transmitted via 3 VLs. Main char-
acteristics are given in Table 1 and Figure 6.
Table 1: Characteristic of VLs in the network architecture.
VL BAG Lmax Source Destination
ES ES
VL1 8 1379 ES 1 ES 3
VL2 16 424 ES 1 ES 3
VL3 8 1385 ES 2 ES 3
ES_1
ES_2
ES_3SW_1 SW_2
VL1
VL2
VL3
Figure 6: AFDX network architecture.
Our SysML model capture each equipment of the
network described before. The model of an end
system has blocks modelling the emission of flows
as well as blocks modeling traffic regulation and
scheduling mechanisms (Figure 7). The switch model
focuses on mechanisms of filtering, switching, classi-
fication and scheduling of messages. The state ma-
chine of an emitting end system is given in Figure 8.
ProtocolEntity
TxMAC_1
Mechanism
- flow2 : Flow;
- msg2 : Message;
Mechanism
Scheduler1
- dataRate = 1 : int;
- msg1 : Message;
- msg2 : Message;
- totalWaitingTime = 0 : int;
- transmissionDelay = 1 : int;
- currentTime = 0 : int;
- countMsg1 = 0 : int;
- countMsg2 = 0 : int;
- countTime1 = 0 : int;
- countTime2 = 0 : int;
Mechanism
- flow1 : Flow;
- msg1 : Message;
User
ES_1
- flow1 : Flow;
- flow2 : Flow;
- cnt1 = 0 : int;
Figure 7: Emitting end system model in SysML.
4.3 Properties Verification with (and
without) Dependency Graph
We now apply the approach of Figure 1, Algorithm 1,
to a set of properties (section 4.3.1) we ought to prove
on our model. We then compare the proof time with
and without dependency graphs. The tests were run
on an Intel core i9 computer, with 8 cores at 2.3GHz,
IDLE
IDLE
flowToSend1(flow1)
flowToSend2(flow2)
sendingF1
sendingF2
OBS_sendF1()
OBS_sendF2()
END
cnt1=cnt1+1
flow1.id=1
flow1.period=8
flow1.nbrOfMessages=2
flow1.msgLength=1379
flow2.id=2
flow2.period=16
flow2.nbrOfMessages=1
flow2.msgLength=424
nbrOfMessages1=flow1.nbrOfMessages
nbrOfMessages2=flow2.nbrOfMessages
[cnt1<flow1.nbrOfMessages ]
[cnt2<flow2.nbrOfMessages ]
[else ]
IDLE
IDLE
sendingF1
sendingF2
END
cnt2=cnt2+1
Figure 8: State machine for an emitting end system. A flow
correspond to a VL of period equal to BAG.
32 Go RAM, running MacOS and Java 8, with TTool
build version 13854 (August 2021).
4.3.1 Evaluated Properties
We have studied the reachability and liveness of four
different meaningful states of the model:
1. State RegulatedF3 in the TrafficRegulator block
2. State ScheduledMsg1 in SWScheduler
3. State FilteredF3 in block Filtering
4. State ReceivedF2 in block Demultiplexer
These states were selected so as to cover the different
networking mechanisms (scheduling, regulation, fil-
tering, demultiplexing) and to cover all virtual chan-
nels: the number at the end of the state refers to the
virtual channel number. For instance, RegulatedF3
refers to the regulation state for virtual channel 3.
4.3.2 Results
Table 2 compares results for reachability and live-
ness analysis. For the case with dependency graph,
we have also added a ‘Graph processing’ column that
corresponds to the time taken to generate the depen-
dency graph from the model, and to select a sub-part
of this graph for the considered property. While this
graph is the same for all properties, we have assumed
that we regenerate it each time for each property. Note
that the same reduced graph can be used both for
reachability and liveness without being recomputed,
because the property concerns the same model ele-
ment, so the dependencies are the same. Whatever
the considered state, the time to generate the depen-
dency graph (Algorithm 2) and to compute its relevant
sub-part (Algorithm 3) was equal to around 15ms.
SysML Models Verification Relying on Dependency Graphs
179
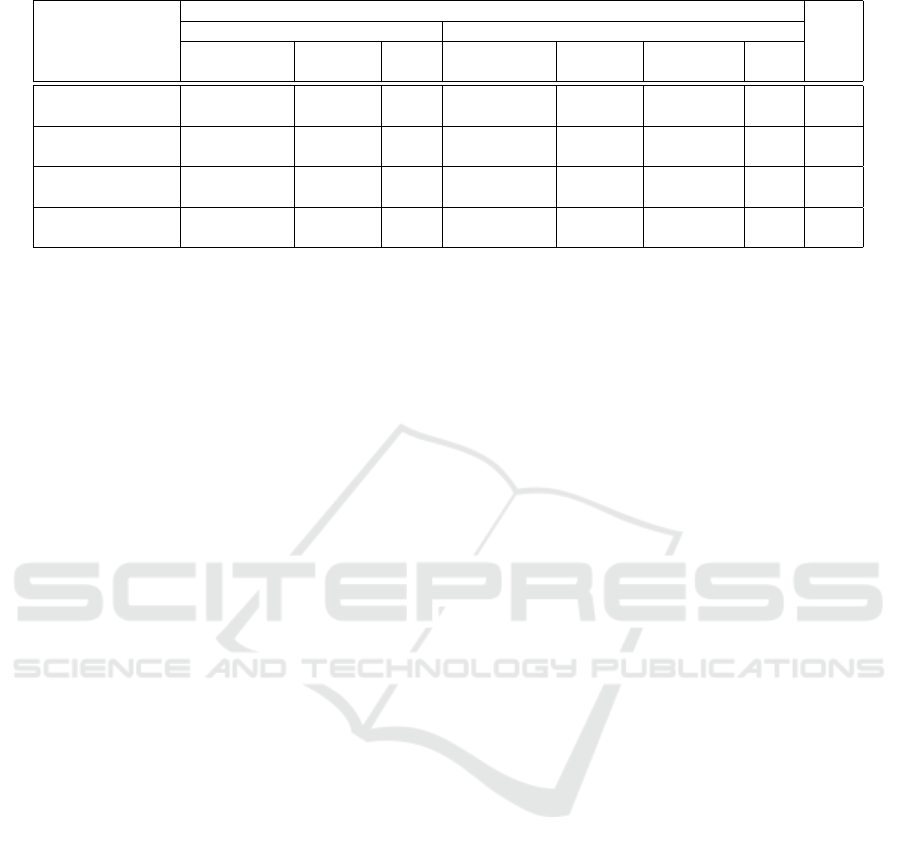
Table 2: Execution duration (in ms) of the reachability and liveness proof with and without dependency graph.
Block/State
Proof duration (ms)
Gain
No DG With DG
Reachability Liveness Total Reachability Liveness
Graph
Total
processing
TrafficRegulator/
6 50 56 6 8 15 29 48%
RegulatedF3
SWScheduler/
104 495 599 18 36 15 69 88%
ScheduledMsg1
Filtering/
98 737 835 19 51 15 85 89%
FilteredF3
Demultiplexer/
114 1734 1848 34 86 15 135 92%
ReceivedF2
The results show, for this case study, that us-
ing the dependency graph is always better, except
when proving only the reachability of TrafficRegu-
lar/RegulatedF3. But even for the this state, prov-
ing both its reachability and liveness leads to an im-
portant time gain (58%) when using the dependency
graph with regard to the usual way. Overall, using
dependency graphs leads to a time gain of 80%. Ob-
viously, we have used only a few properties for one
given (quite complex) model, but these results are al-
ready very encouraging, and correspond to what we
expected: cutting a model according to a property by
capturing dependencies help reducing proof complex-
ity. Moreover, since our approach leads to consider
reduced models, we do expect to be able to perform
reachability and liveness proofs in models with com-
binatory explosion.
5 RELATED WORK
A survey of the literature indicates that papers on the
formal verification of SysML models mostly address
either activity diagrams (Ouchani et al., 2014; Huang
et al., 2019) or state machine diagrams (Delatour and
Paludetto, 1998; Schafer et al., 2001; Apvrille et al.,
2004). In this paper, the model checker of TTool falls
in the category of tools that take state machine dia-
grams as input. The current version of TTool does not
enable formal verification of activity diagrams.
A survey of the literature also indicates that many
authors propose to translate SysML activity or state
machine diagrams into a formal model, and to reuse a
model checker supporting that formal model. Transla-
tion from UML/SysML to state/transition models has
been formalized in the context of Petri nets (Dela-
tour and Paludetto, 1998; Szmuc and Szmuc, 2018;
Huang et al., 2019; Rahim et al., 2020), automata for
NuSMV model checker (Wang et al., 2019), timed
automata (Schafer et al., 2001) for UPPAAL model
checker, hybrid automata (Ali, 2018), model checker
NuSMV (Mahani et al., 2021), probabilistic model
checker PRISM (Ouchani et al., 2014; Ali, 2018), and
a theorem prover (Kausch1 et al., 2021). Translation
from UML to process algebra has been investigated
for RT-LOTOS (Apvrille et al., 2004) and CSP (Ando
et al., 2013). The family of correct by construction
specification has been addressed with B (Laleau and
Mammar, 2000). Other contributions such as (Zoor
et al., 2021), target a better understanding of verifi-
cation results output, especially when the property of
interest is not satisfied.
Translating a SysML model into a formal one
raises the issue of coming back to the original model
(e.g., blocks, state machines). This issue is not sys-
tematically addressed in the literature (De Antoni and
Mallet, 2012). By contrast, the native model checker
of TTool can backtrack verification results to the ini-
tial SysML model and does not oblige the develop-
ers of the SysML diagrams to go into the inner work-
ings of the model checker. Further, in terms of per-
formances, the native model checker of TTool favor-
ably compares to the performance of the first version
of TTool where the latter was interfaced with UP-
PAAL (Calvino and Apvrille, 2021).
The use of dependency graphs could apply to
other model-checking approaches since the idea is
rather to feed into the prover a reduced model —so
without modifying the prover— that is sufficient to
prove the selected properties.
6 CONCLUSIONS
Model checkers state whether a system satisfies prop-
erties or not. The paper presents a new technique,
based on dependency graphs, to reduce the com-
plexity of model-checking performed from SysML
models. Moreover, the same approach can be used
to check whether a property must be checked again
when a modification has been done on a model. The
interest of dependency graphs is demonstrated for an
MODELSWARD 2022 - 10th International Conference on Model-Driven Engineering and Software Development
180

AFDX network subset.
Future works include the definition of a bisimula-
tion relation to compare dependency graphs. We also
intend to use new case studies to demonstrate the effi-
ciency of our approach at larger scale. Last, we intend
to support the new syntax (including the textual syn-
tax) and semantics of SysML V2.
REFERENCES
Ali, S. (2018). Formal verification of SysML diagram us-
ing case studies of real-time system. Innovations in
Systems and Software Engineering, 14(6):245–262.
Ando, T., Yatsu, H., Kong, W., Hisazumi, K., and Fukuda,
A. (2013). Formalization and model checking of
SysML state machine diagrams by csp#. In Compu-
tational Science and Its Applications (ICCSA), page
114–127.
Apvrille, L., Courtiat, J.-P., Lohr, C., and de Saqui-Sannes,
P. (2004). TURTLE: A real-time UML profile sup-
ported by a formal validation toolkit. IEEE Transac-
tions on Software Engineering, 30(7):473–487.
Apvrille, L., de Saqui-Sannes, P., and Vingerhoeds, R. A.
(2020). An educational case study of using SysML
and ttool for unmanned aerial vehicles design. IEEE
Journal on Miniaturization for Air and Space Systems,
1(2):117–129.
Calvino, A. T. and Apvrille, L. (2021). Direct model-
checking of SysML models. In Proceedings of the 9th
International Conference on Model-Driven Engineer-
ing and Software Development (Modelsward’2021),
Vienna, Autrichia (online).
De Antoni, J. and Mallet, F. (2012). Timesquare: Treat your
models with logical time. In International Confer-
enceon Modelling Techniques and Tools for Computer
Per-formance Evaluation, page 34–41. Springer.
de Saqui-Sannes, P., Apvrille, L., and Vingerhoeds, R. A.
(2021). Checking SysML Models against Safety and
Security Properties. Journal of Aerospace Information
Systems, pages 1–13.
Delatour, J. and Paludetto, M. (1998). UML/PNO: A way
to merge UML and Petri net objects for the analy-
sis of real-time systems. In Oriented Technology:
ECOOP’98 Workshop Reader, page 511–514.
Frances, F., Fraboul, C., and Grieu, J. (2006). Using net-
work calculus to optimize the AFDX network. In
ERTS, Toulouse, France.
Hotescu, O., Jaffr
`
es-Runser, K., Scharbarg, J.-L., and
Fraboul, C. (2019). Multiplexing avionics and ad-
ditional flows on a qos-aware AFDX network. In
2019 24th IEEE International Conference on Emerg-
ing Technologies and Factory Automation (ETFA),
pages 282–289. IEEE.
Huang, E., McGinnis, L., and Mitchell, S. (2019). Verifying
sysml activity diagrams using formal transformation
to Petri nets. Systems Engineering, 23(1):118–135.
Kausch1, M., Pfeiffer1, Raco1, D., and Rumpe, B. (2021).
Model-based design of correct safety-critical systems
using dataflow languages on the example of SysML
architecture and behavior diagrams. In AVIOSE’2021,
Software Engineering 2021 Satellite Events, Bonn,
Germany (virtual), Lecture Notes in Informatics
(LNI), Gesellschaft f
¨
ur Informatik, pages 1–22.
Laleau, R. and Mammar, A. (2000). An overview of a
method and its support tool for generating B speci-
fications from UML notations. In ASE2000. Fifteenth
IEEE International Conference on Automated Soft-
ware Engineering, page 269–272.
Mahani, M., Rizzo, D., Paredis, C., and Wang, Y. (2021).
Automatic formal verification of SysML state ma-
chine diagrams for vehicular control system. SAE
Technical Paper.
OMG (2017). OMG Systems Modeling Language.
Object Management Group, https://www.omg.org/
spec/SysML/1.5.
OMG (2020). SysML v2, https://mbse4u.com/2020/10/17/
new-incremental-sysml-v2-release-2020-09/.
Ouchani, S., Ait Mohamed, O., and Debbabi, M. (2014).
A formal verification framework for SysML activity
diagrams. Expert Systems with Applications, 41(6).
Rahim, M., Boukala-Loualalen, M., and Hammad, A.
(2020). Hierarchical colored Petri nets for the veri-
fication of SysML designs - activity-based slicing ap-
proach. In 4th Conf. on Computing Systems and Appli.
(CSA 2020), volume 199 of Lecture Notes in Networks
and Systems, pages 131–142, Algiers, Algeria.
Schafer, T., Knapp, A., and Merz, S. (2001). Model
checking UML state machines and collaborations.
Electronic Notes in Theoretical Computer Science,
55:357–369.
Szmuc, W. and Szmuc, T. (2018). Towards embedded sys-
tems formal verification translation from SysML into
Petri nets. In 25th International Conference Mixed
Design of Integrated Circuits and System (MIXDES),
pages 420–423.
TTool (2021). https://ttool.telecom-paris.fr/. Retrieved
September 10, 2021.
Wang, H., Zhong, D., Zhao, T., and Ren, F. (2019). Inte-
grating model checking with sysml in complex system
safety analysis. IEEE Access, 7:16561–16571.
Zoor, M., Apvrille, L., and Pacalet, R. (2021). Execu-
tion Trace Analysis for a Precise Understanding of
Latency Violations. In International Conference on
Model Driven Engineering Languages and Systems
(MODELS), Fukuoka (virtual), Japan.
SysML Models Verification Relying on Dependency Graphs
181
