
Augmenting Reinforcement Learning to Enhance Cooperation in the
Iterated Prisoner’s Dilemma
Grace Feehan
a
and Shaheen Fatima
b
Loughborough University, Epinal Way, Loughborough, U.K.
Keywords:
Iterated Prisoner’s Dilemma, Interaction Structure, Multiagent Reinforcement Learning, Mood, Cooperation
Index.
Abstract:
Reinforcement learning algorithms applied to social dilemmas sometimes struggle with converging to mutual
cooperation against like-minded partners, particularly when utilising greedy behavioural selection methods.
Recent research has demonstrated how affective cognitive mechanisms, such as mood and emotion, might
facilitate increased rates of mutual cooperation when integrated with these algorithms. This research has,
thus far, primarily utilised mobile multi-agent frameworks to demonstrate this relationship - where they have
also identified interaction structure as a key determinant of the emergence of cooperation. Here, we use a
deterministic, static interaction structure to provide deeper insight into how a particular moody reinforcement
learner might encourage the evolution of cooperation in the Iterated Prisoner’s Dilemma. In a novel grid
environment, we both replicated original test parameters and then varied the distribution of agents and the
payoff matrix. We found that behavioural trends from past research were present (with suppressed magnitude),
and that the proportion of mutual cooperations was heightened when both the influence of mood and the
cooperation index of the payoff matrix chosen increased. Changing the proportion of moody agents in the
environment only increased mutual cooperations by virtue of introducing cooperative agents to each other.
1 INTRODUCTION
Models of human social behaviours, and the socio-
cognitive mechanisms that underlie them, have be-
come a fast focus of researchers in the field of com-
puter science in recent years. In particular, they are
of interest both for the improvement of existing algo-
rithms (such as for the focusing of attention in visual
search; (Belkaid et al., 2017) but also in investigating
individual and group behaviours (social network sim-
ulacra being one example). One testing ground for the
development of such artificial mechanisms are social
dilemmas, as they are relatively well understood, sim-
ple and easy to constrain or build on. In these we find
strong methods of studying interpersonal behaviour.
This work builds on previous research on how typ-
ically reward-focused reinforcement learning (RL) al-
gorithms, utilised by a network of agents engaged
in the Iterated Prisoner’s Dilemma (IPD), can be al-
tered using computational socio-cognitive models to
encourage increased cooperation. One of the newer
of these in recent literature has been a model of mood,
with research suggesting that a key determinant of
a
https://orcid.org/0000-0002-8629-1800
b
https://orcid.org/0000-0002-6068-2942
the emergence of cooperation within moody dilemma
playing is the interaction environment (or network
structure; Collenette et.al., 2017a). The model has
so far been tested primarily in mobile networks of
moving agents; we instead seek to more clearly es-
tablish how a static and more standardised structure
of interaction affects the moody model’s influence
on cooperation. The main objective of this paper
is to find methods of increasing cooperation in RL
agents playing the IPD. To do this, we evaluate the
behaviour of moody learning agents in a static, reg-
ular, multiagent environment whilst playing against
more traditional RL agents - data on which has not
been explicitly presented in past research. We first
summarise the published research on a human-based
model of mood and then examine how behaviour ob-
served in the novel environment compares. We hy-
pothesised that results may follow the data in Col-
lenette et.al. (2017a), and demonstrate that increased
interaction rates dampen cooperation gains, but still
show an increase in cooperation over unaltered RL.
We also investigate two additional factors for in-
creasing cooperation rates; the proportion of oppo-
nents in the environment and a measure of how co-
operative the reward schema is. Results of our sim-
ulations demonstrated that cooperation can indeed
146
Feehan, G. and Fatima, S.
Augmenting Reinforcement Learning to Enhance Cooperation in the Iterated Prisoner’s Dilemma.
DOI: 10.5220/0010787500003116
In Proceedings of the 14th International Conference on Agents and Artificial Intelligence (ICAART 2022) - Volume 3, pages 146-157
ISBN: 978-989-758-547-0; ISSN: 2184-433X
Copyright
c
2022 by SCITEPRESS – Science and Technology Publications, Lda. All rights reserved
be increased by the latter of these factors by up to
15%, whereas the former does not. Our experimen-
tal data are discussed in the context of structures of
interaction, the variables the model utilises, and pos-
sible changes the model’s implementation may need
in this environmental setting. The primary contri-
butions of this research are that we provide direct
evaluation of the moody strategy in static networks
(previously undetailed), test the moody model against
varying quantities of traditional RL opponents to eval-
uate behavioural transference, and test varying payoff
matrices which facilitate comparisons with external
human participant data. The Python code repository
for this paper is available on request.
Beginning with Section 2, we outline the compu-
tational problem space covered by the IPD, and the
justification for using it in uncovering social agent be-
haviour. We also describe the RL algorithm SARSA,
and introduce the notion of interaction structures and
how this relates to the moody model to come. Then, in
Section 3 we describe this model of mood (mSARSA)
as it is primarily outlined in Collenette et.al. (2017b),
with deeper presentation of its relevant past perfor-
mance. We also provide the motivation, based on this
literature, for our own experiments. Section 4 pro-
vides the detail of the novel testing environment, pa-
rameters and hypotheses. Finally, Section 5 gives the
data from these experiments, and Section 6 gives the
subsequent analysis, comparisons and conclusions.
Thereafter we propose suggestions for the improve-
ment of the model.
2 BACKGROUND
2.1 Prisoner’s Dilemma
The Prisoner’s Dilemma is a social dilemma in which
players have two behavioural choices available to
them, and typically must choose without direct com-
munication. Cooperate with the partner, and poten-
tially be exploited, or defect (play selfishly) against
the partner, which (if mutual) will lead to a lower
round payout than with mutual cooperation. The
Nash Equilibrium of the dilemma, due to the payoff
structure (Table 1), is to defect - but if both players
opt to do this, their score is diminished in compari-
son with what could be achieved. In addition, when
the game is played over many rounds (as in the IPD),
several issues arise. The strong incentive to defect
leads networks to obtain substantially lower payoffs
as a whole than sustained mutual cooperations would
provide. There is also a range of problems involving
how to encourage partners to both trust and continue
Table 1: Payoff matrix for the two-player Prisoner’s
Dilemma game, as used in Collenette et.al. (2017b) and
throughout classic literature. The cooperation index of this
matrix (see Section 3.3) is 0.4.
Partner B (Right)
Cooperate Defect
Cooperate 3,3 0,5
Partner A
(Left)
Defect 5,0 1,1
playing the game with you when you repeatedly de-
fect (Wilson and Wu, 2017). This lends itself to the
motivation for finding mechanisms that encourage the
evolution of cooperation in artificial agents.
The payoff values presented in Table 1 have been
used extensively throughout IPD research under dif-
ferent names; Temptation (or T) for a DC outcome,
Reward (or R) for a CC outcome, Punishment (or
P) for a DD outcome and Sucker (or S) for a CD
outcome. In our work, we also refer to these as the
Exploiter, Mutual C, Mutual D and Exploited payoffs
respectively as they provide simpler intuition.
Overall, we find a suitable research environment
given two reasons. Firstly, there is well-established
precedent that human networks playing the game do
not defect in the same manner as many game-playing
strategies (Barreda-Tarrazona et al., 2017), and are
more heterogeneous in their behaviours (Fudenberg
et al., 2012). Secondly, there is large potential for
artificial players to improve from payoff-incentivised
defection with the introductions of novel additions
(as they can already display greedy behaviour; Col-
lenette et.al., 2017b). RL algorithms such as SARSA
have been used to learn behavioural policies for the
IPD (Collenette et.al., 2017b; Yu et.al., 2015; (Gao,
2012), and in general are of interest to computational
neuroscience regarding human behaviour (Shteingart
and Loewenstein, 2014); making them a suitable
methodology for investigating humanlike cooperative
behaviour. In the following section, we detail SARSA
as it relates to social agent research, and then in Sec-
tion 4 we outline how it has been extended further
with a moody model, noting additional factors that
may influence cooperation behaviour.
2.2 Interaction Structure
One of the primary sources demonstrating the effect a
model of mood has on the emergence of cooperation
within social dilemmas is Collenette et.al. (2018),
a study which concludes that the structure of net-
work connections and interactions influences how be-
haviours emerge in said network. Here we will out-
line some of the terminology involved and how each
relates to the research at hand. Interaction structures
can be defined as the way agents interact with each
other; in the context of the IPD, interactions occur
Augmenting Reinforcement Learning to Enhance Cooperation in the Iterated Prisoner’s Dilemma
147

between two players when they play a round of the
dilemma game. In our experiments and in much of
the research summarised in Section 3, this is extended
to involve multiple pairs of players in a group, or a
network. Networks can be given in the form of a
graph, where agents in these networks are represented
as nodes and interaction relationships between agents
are represented as edges between nodes. There are
two main forms of network related to the current re-
search (mobile and static), and there are many struc-
tural variations on the graph which represents how
well connected agents are.
In the mobile environments used in the majority of
the model literature, agents move freely around are-
nas with obstacles (dependent on the network type),
intending to replicate the dynamic and uneven inter-
actions of more natural societal networks. These en-
vironments have equivalent static networks with dif-
fering topographical structures; in Collenette et.al.
(2018), for example, the authors include small world
(characterised by high clustering), fully connected
(where all nodes are connected to all other nodes),
random (as the title suggests) and regular networks
(where each node has the same number of edges). The
equivalent in our own experiments would be a static
regular network. As the literature discussed here de-
scribes the effect of increasing mobility, and there
is some disagreement amongst the papers on the ef-
fect of network structure, evaluating both SARSA and
mSARSA in a static regular network may add more
clarity to structural effects. In the learning algorithm
SARSA, agents update world knowledge through hav-
ing game interactions. This makes the nature of those
interactions, how many interactions agents have in the
course of a learning episode, and what information
those interactions provide, critical to this learning.
2.3 SARSA
State-action-reward-state-action (SARSA) is an on-
policy RL algorithm - one that is used throughout
the literature pertaining to the mood model discussed
here. States, in the case of default SARSA as it is used
in this paper, are the histories of interactions with each
partner - the length of which depending on the mem-
ory size afforded to the agent. In our implementation,
up to seven items can be remembered or for larger
items (like the memory of what both players did), 3 or
4 ‘chunks’. Actions are the behaviours available (i.e.
cooperate or defect), and rewards are given by the
payoff matrix used, depending on the outcome of each
individual interaction. Both the default SARSA and
the mSARSA variant use the ε-greedy behaviour selec-
tion mechanism. Algorithmic details and pseudocode
for SARSA can be found in (Sutton and Barto, 2018).
The equation for updating Q (the learned value) for
each state-action combination is given below as it is
pertinent for comparison with the mood-augmented
version presented in Section 3.1.
Let s represent the state, t denote the current
timestep of a learning epoch, a the action taken in that
state, where α is the learning rate (typically 0.1), γ is
the discount factor (typically 0.95), and r is the reward
received:
Q(s
t
,a
t
) = Q(s
t
,a
t
)+
α[r
t+1
+ γQ(s
t+1
,a
t+1
) − Q(s
t
,a
t
)]
(1)
Originally selected due to its on-policy nature
conforming with the on-policy characterisation of
mood (Collenette et.al., 2017b), it has the added ben-
efits of being well-established, easy to implement and
computationally light when the state space is smaller
(Collenette et.al.’s methodology yields approximately
216 states, for instance). Application of reinforce-
ment learners is of interest to those researching ar-
tificial social and cognitive mechanisms in humans;
Shteingart et.al. (2014) discusses the benefits of
model-free temporal difference learners as practical
methodologies for examining and recreating human-
like behaviour, but also the potential lack of intricacy
and depth that model-free algorithms have when at-
tempting to recreate behaviour altered by chemical
neuromodulation (perhaps particularly of relevance to
mood and emotion modelling).
Still, Q-learners are being pursued as viable meth-
ods to model different variations of human processing
(Lin et al., 2019)) and continue to be of use to interdis-
ciplinary research. Bearing these limitations in mind,
we can consider how augmentations to SARSA may
also begin to pursue more complex humaniform mod-
elling. One particular field of interest in regards to this
is mood, where there exists a large body of literature
on how mood influences dilemma reasoning (Palfai
and Salovey, 1993) and cooperative behaviour (Proto
et al., 2017); (Hertel et al., 2000). We will cover one
particular computational model of mood that has been
integrated into the SARSA learning algorithm.
3 RELATED LITERATURE
3.1 Mood Model and Integration with
SARSA
Mood is reliably, if reductively, defined as a task- and
partner-invariant affect spectrum which influences
ICAART 2022 - 14th International Conference on Agents and Artificial Intelligence
148

other cognitive processes, dissociated more from cur-
rent events with longer-term effects (Collenette et.al.,
2017b). It is a closely interdependent subsystem with
emotions
1
and biases many aspects of human percep-
tion.
The moody mSARSA model under analysis here is
primarily outlined in Collenette et.al. (2017b), and
employs a central mechanism by which mood is a
real number between 1 and 100. Higher mood values
are coded as more risky and cooperative, with lower
moods as more rational and defective; in Collenette
et.al., extreme moods (above 90 and below 10) are
implied as characterising mood disorders (mania and
depression, respectively). Mood updates are made
solely around how an agent perceives its current pay-
off (which is adjusted using the Homo Egualis model,
comparing the reward with the opponent’s reward;
(Fehr and Schmidt, 1999), relative to the average pay-
off previously attained. If an agent perceives itself to
be doing poorly in comparison with its past, its mood
will decrease. In Collenette et.al. (2018), this process
is slightly adjusted to facilitate higher moods decreas-
ing more readily (in line with the ease of fluctuation
at lower moods). The mood-altered equation for up-
dating Q for each state-action pair is provided below
(adapted from Collenette et.al., 2017b).
Q(s
t
,a
t
) = Q(s
t
,a
t
) + α[r
t+1
+ γΨ − Q(s
t
,a
t
)] (2)
The rule for the estimation of future rewards (Ψ)
is encapsulated in Equations 3 through 5 (reproduced
from Collenette et.al., 2017b), where m
t
i
is the mood
of a given agent i at timestep t (a R between 0 and
100). Mem
a
i
is the vector of the set of rewards previ-
ously obtained by that agent when using action a, and
|Mem
a
i
| is at maximum 20. Mem
a
i
(0) returns the most
recent reward.
α
t
i
= (100 − m
t
i
)/100 (3)
β
t
i
= ceil(|Mem
a
i
(n)|/α
t
i
) (4)
Ψ = (n
β
∑
0
Mem
a
i
(n))/β
t
i
(5)
Mood constrains the depth (denoted with n above)
at which memory is consulted for the average past re-
ward, but also controls the value ε in ε-greedy explo-
ration. When an agent’s mood is below 30 and they
cooperate, or above 70 and they defect, ε increases to
0.9 for that turn and a move is re-selected. Mood is
updated and maintained by the series of Equations 6
1
Emotions, which are more temporally distinct, varied,
and can be task-relevant (Zulfiqar and Islam, 2017) also
have an influence on decision-making; despite their rele-
vance, however, emotions are extraneous to the scope of the
current paper.
through 8 (reproduced from Collenette et.al., 2017b).
Let t denote the current timestep of a learning epoch,
p
t
i
return the payoff of agent i in that timestep, µ
t
i
de-
note their average payoff over the elements in Mem
a
i
,
and m
t
i
denote their mood. Let j denote agent i’s op-
ponent, and let α = β (as in Collenette et.al., 2017b):
α
t
i
= (100 − m
t
i
−1
)/100 (6)
Ω
i
,
j
t
= µ
i
t
− α
i
t
· max(µ
j
t
− µ
i
t
,0)−
β
i
t
· max(µ
i
t
− µ
j
t
,0)
(7)
m
i
t
= m
i
t −1
+ (p
i
t
− µ
i
t −1
) + Ω
i
,
j
t −1
(8)
Algorithm 1: mSARSA Pseudocode (Adapted
from Collenette et.al., 2017b).
initialise all Q(states, actions) arbitrarily;
for each episode do
initialise all states;
Choose an action using the policy derived
from Q (ε-Greedy);
for each episode step do
Take the chosen action, observe the
reward and the new state reached;
if mood ≥ 70 and action = ‘D’ OR mood
≤ 30 and action = ‘C’ then
re-select an action under a higher ε
value (0.9)
Choose next action using the policy
derived from Q (ε-Greedy);
Estimate future reward using Equations 3
through 5;
Update Q(s, a) using Equation 2;
Update mood using Equations 6 to 8 ;
Until terminal step;
As Algorithm 1 demonstrates, moody alterations
to the standard SARSA framework are mostly additive,
with the exception of one variable replacement in the
Q-update equation. At each stage of learning mood
value is considered, creating an all-permeating inte-
gration to decision-making. The purpose of the sys-
tem design is a thoughtful combination of a few moti-
vations: it models evidence-based mood in a learner,
where previous focus had been primarily on models of
emotion; it intends to expand understanding on how
human-like mood (and emotion, where applicable) in-
forms decisions in social dilemmas; and it appears to
facilitate increased rates of cooperation in certain sit-
uations, as we will evidence from past research.
One final important aspect of the algorithm to note
is that Equation 8 provides the first iteration of the
mood update function (MU1) that is utilised in Col-
lenette et.al. (2017b), which this paper will make a
direct comparison with in terms of data. There is a
second iteration of this equation (MU2, see Equation
Augmenting Reinforcement Learning to Enhance Cooperation in the Iterated Prisoner’s Dilemma
149

9), which was developed and deployed in Collenette
et.al. (2018) to facilitate faster mood changes when
poor outcomes are received at higher mood levels.
m
i
t
= m
i
t −1
+ (p
i
t −1
− Ω
i
,
j
t −1
) (9)
It is important to note that our implementation (see
Section 4) uses the former of these equations (Equa-
tion 8) in its calculations, for two main reasons. First,
it means we utilise the exact structure of the version
used in Collenette et.al., (2017b), which is the only
source of precise cooperation data for the algorithm
specifically (and not a mixed population as a whole,
as presented in Collenette et.al., 2018). Secondly, ini-
tial testing with MU2 indicated that it took a lot longer
for the algorithm to run to conversion - if at all, as
it potentially exhibited cyclic behavioural loops. It
did, however, manipulate the mood value much more
effectively than MU1 appeared to do, with the be-
haviour of both possibly exaggerated by the nature of
our environment used. Though full details on our ob-
servations cannot be evaluated here due to constraints,
this may be examined in further work - the limitations
and critique of MU1 where it is relevant to the current
experiments are detailed clearly in Section 6.
3.2 Moody versus Non-Moody
Firstly, it is quite apparent that the addition of the
mood model in previous research scenarios is a posi-
tive one; networks with moody agents achieve greater
proportions of mutual cooperation at behavioural con-
vergence than their non-moody (or even emotional)
counterparts. Moody agents do not necessarily al-
ways attain the greatest utility
2
but the mechanism
does seem to reduce the self-interest of otherwise
greedy SARSA agents. These agents are typically ren-
dered using Stage (Vaughan, 2008) and perform ran-
dom walks, usually in an environment with central ob-
stacles. On encountering an opponent, they perform
a round of the Prisoner’s Dilemma (or other game, as
relevant) and then move on. It is worth bearing in
mind this setup throughout the following analysis, as
the authors repeatedly comment on how reduced rates
of uncertainty in repeated interaction introduces diffi-
culty in sustaining cooperation and removes the threat
of punishment for defecting.
Initial work combining the mood system with the
Ortony, Clore and Collins (OCC) Model of Emo-
tions (Ortony et al., 1988), (Clore and Ortony, 2013)
demonstrated a high rate of effectiveness in the IPD.
2
In Collenette et.al. (2018), Tit-for-Tat was identified as
the most successful strategy despite differing environments
and network structures.
In Collenette et.al. (2017b), a three-emotion frame-
work saw an increase in the peak proportion of mutu-
ally cooperative outcomes from approximately 35%
to 100% in some scenarios when the mood model
was added. With the scenarios representing differ-
ent proportions of starting moods (between low, neu-
tral and high) in the environment, it is clear that in
initial testing high mood networks happily cooper-
ate with one another. As discussed later in the pa-
per, however, these are not resilient outcomes, and are
vulnerable to exploitative crashes against pure defec-
tors (versus low mood groups). In these resilience
tests, the percentage of mutual cooperation rose at
best by approximately 16%, which is still a marked
improvement over the 5% initial rate. This paper also
demonstrates the positive visual correlation between
mood value and percentage of mutually cooperative
outcomes, with both rising steadily as more interac-
tions occur.
In a highly mobile environment, the model facil-
itated an increase in the proportion of mutually co-
operative outcomes by at least 40% over the SARSA
equivalent; both when opponents were recognisable
and when their mood labels were directly observable
(Collenette et.al., 2017b). This increase was even
greater when agents possessed no information about
their opponents, with regular SARSA agents attain-
ing only 1.7% mutually cooperative outcomes and
their moody counterparts attaining (at greatest) 78%.
There were equivalent decreases in the proportion
of mutually defective outcomes in these conditions
where mSARSA performed well.
In more explorative network research, the model
was included amongst a very wide variety of other
strategies in a broader selection of topologies. In one
paper, though there is no per-strategy breakdown pro-
vided in the data regarding cooperation or utility gath-
ered, mutual cooperation was maintained at approx-
imately 49% in a mixed strategy environment (Col-
lenette et al., 2018b). Importantly, this paper draws
several key conclusions about the effect network con-
nectivity (and the equivalent physical environments)
has on both cooperation and dilemma playing. Net-
works with random connectivity facilitate the greatest
proportion of mutual cooperation and average pay-
offs to agents, with the mobile environment equiva-
lent providing the same in terms of cooperation, but
performing only approximately as well as the empty
and small world environments. Though the effect on
the mood model specifically is unknown due to lack
of strategy-by-strategy breakdown, it is important to
note that our environment is most comparable with
the regular static network in Collenette et.al. (2018)
(the mobile equivalent of which is utilised in the ma-
ICAART 2022 - 14th International Conference on Agents and Artificial Intelligence
150

jority of the tested environments across the papers
discussed). In the terms of connectedness, the reg-
ular static network performed second worst out of the
four constructions (demonstrated lower cooperation
and lower average payoff attained) but attained higher
scores on both metrics in comparison to its mobile
equivalent.
One final paper (Collenette et al., 2017a) com-
bines two of these methodologies - the emotional-
moody non-learning model and a variety of differ-
ent network types, similar to Collenette et.al. (2018).
Again, mood shows a strong positive influence on co-
operation levels over just the OCC framework alone.
Emotional agent networks sustained cooperation al-
most regardless of length of interaction, with starting
level of cooperation having a much larger effect than
the distribution of admiration thresholds (one of the
three emotions used) on the level of cooperation in
the system. Most of the results where initial cooper-
ation was set to 50% resulted in mutual cooperation
proportions within the range of 25% to 40%. On the
other hand, the inclusion of mood increases this range
to between approximately 82% to 100%. Resilience
results are similar to those seen in Collenette et.al.
(2017b), demonstrating low moods as more resistant
to pure defectors in the long run.
3.3 Cooperation Index
Throughout the moody algorithm literature, varia-
tions on the traditional payoff matrix (Table 1) have
not been tested. This is an important factor for an
algorithm modelling humanlike traits, as there exists
work that demonstrates how relational differences be-
tween the payoffs influences human cooperation rates
in the IPD. In one paper (Wrightsman et al., 1972), the
authors summarise and discuss initial research into a
cooperation index (henceforth referred to as K, as in
Colman et.al., 2018), or formula for characterising the
intensity of the conflict the structure of the payoff ma-
trix creates. This text is rather old, but summarises
past work regarding human interactivity with K well;
namely, cooperative behaviour appears to increase as
K increases, with less clear-cut conclusions made re-
garding its influence on defections (something the au-
thors suggest is primarily influenced by the T payoff
alone). The equation for K, where each input has been
defined previously in Section 2.1, is given in Equation
10.
K = (R − P)/(T − S) (10)
Other research continues to use K to evaluate pay-
off matrices with humans and compare it to other
models. K has been shown to be a strong cooperation
predictor when values of K are distributed from 0.1
to 0.9 (Hristova and Grinberg, 2005). These authors
again found a consistent increase of cooperation as K
increased, and an influence of contextual K (that is,
playing other IPD games with high K values around
a specified target game with a differing K) on cooper-
ation levels. The authors also create a computational
model that utilises subjective expected utility theory,
combined with weightings for the importance of each
outcome type (calculated via average of past payoffs)
to replicate the trends shown in the human data, with
success. One paper reiterates the human conclusions
from this previous work in one of the most recent ref-
erences to K, providing solid basis of connection be-
tween K and cooperation (Colman et al., 2018).
3.4 Summary and Literature Gap
The evidence discussed thus far indicates that the
model has a strong propensity for inducing mutual co-
operation between homogeneous agents, with indirect
data suggesting it possibly assists in the formation of
a stable level of cooperation in heterogeneous strate-
gical groups. It has been flexibly combined with RL
and frameworks of emotional behaviour alike, and in
both cases has allowed for the increase in coopera-
tion. Highly connected networks reduce the effective-
ness of the model as opposed to randomly connected
networks, and with mobility added on top of this, co-
operation is even further diminished in mixed groups.
There is also evidence to suggest that in homogeneous
groups, the influence of network orientation is much
less important than variables such as starting mood
(though this is in non-learning populations).
Overall, there is a lack of specific, isolated data
on the performance of the moody learner in a static,
homogeneous environment with regular connectivity,
and no data whatsoever on how moody agents be-
have in environments with varying distributions of
opponents or different payoff matrices. The experi-
mentation in Section 4 seeks to partially rectify this.
For these reasons, we will test mSARSA against itself,
replicating the parameters thoroughly tested in Col-
lenette et.al., (2017b) but under a more consistent in-
teraction structure. We will also substantially evaluate
the two contributing factors outlined (opponent den-
sity and K value) in order to provide a thorough exam-
ination of behavioural outcomes. If we can establish
a baseline of whether mSARSA behaves similarly and
reliably in our environment in comparison with mo-
bile counterparts, we then not only lend weight to the
model’s robustness, but also set precedent for further
experimentation.
Augmenting Reinforcement Learning to Enhance Cooperation in the Iterated Prisoner’s Dilemma
151

4 EXPERIMENTAL EVALUATION
4.1 Design
The environment used for all three of the following
experiments is a regular 2D grid network of 25 agents
who do not change positions between rounds. Grid
positions begin from the bottom left (pos. 1) and in-
crease vertically northwards, filling out each column
before moving to the next (i.e. top left is pos. 5, top
right is pos. 25). In a single round of the IPD, agents
interact with as many available partners in the four
von Neumann neighbourhood positions, north, south,
east and west (clockwise, in this order). In Interac-
tion Structure experiments, all agents in the grid are
of the same strategy (mSARSA or SARSA). In Strat-
egy Proportion, most agents in the grid are initially
SARSA, with the proportion of agents increased grad-
ually as documented in Table 2. In Payoff Schema,
there are 12 mSARSA agents in the environment to 13
SARSA agents, using the F agent arrangement from
the previous experiment (Table 2).
This structure was designed in MESA (Team,
2021), recreating grid environments from other spa-
tial social dilemmas (Yu et al., 2015). Data pre-
sented are the results of only the inner square grid
of agents (excluding all border players) - this pro-
vides more standardised analysis as these agents will
have the maximum of four partners. Each experiment
consists of 5 learning episodes (experimental periods
in which internal variables are maintained), each con-
sisting of 10,000 time steps. This value was chosen
to compromise between efficient runtime and allow-
ing for any late-phase change of behaviour. Data pre-
sented averages over these learning episodes.
4.2 Parameters
In the base experiment, mSARSA will be tested (as in
Collenette et.al., 2017b) using three levels of state in-
formation - the opponent’s last move, the opponent’s
ID, and the opponent’s mood label - each cumulative
with the last, under the names Stateless, Agentstate
and Moodstate. The parameter mA is intended to re-
flect the ‘extent to which mood influences behaviour’
(Collenette et.al., 2017b); this takes the form of alter-
ing moody behavioural thresholds chosen each round
and how epsilon is changed. We will test this pa-
rameter with values 0 through 0.8, in increments of
0.4. In the Strategy Proportion and Payoff Schema
experiments, mSARSA utilises just the Moodstate and
mA=0.8 parameters.
In the basic test of Interaction Structure, agents
solely play against opponents of their own strategy
in the grid. In the two experiments following this,
mSARSA agents play the IPD with SARSA agents. The
positions and proportions of agent types in the envi-
ronment for Strategy Proportion tests are outlined in
Table 2, with the Payoff Schema experiments utilising
the Condition F structure from this same table.
Table 2: Parameters used for the Strategy Proportion exper-
iment. The first row notes the grid locations of mSARSA
agents in each condition, and the second row displays what
percentage of the whole population the mSARSA agents oc-
cupy.
Condition A B C D E F G H
Grid
Locations
1 9
7,
9,
17,
19
1,
5,
21,
25
C,
D
E,
6,
10,
16,
20
F,
2,
4,
22,
24
G,
3,
11,
15,
23
Network
Proportion (%)
4 4 16 16 32 48 64 80
The independent variable changed in Payoff
Schema is the payoff matrix used, varied both in ac-
tual value size and in size of cooperation index (K)
- a measure used in both Wrightsman et.al. (1972)
and Colman et.al. (2018) (see Table 3). These can be
broadly categorised into three sections; small-value
payoffs (between 0 and 1) with small, medium and
large values of K, the traditional IPD payoff scheme
(Condition 4) and then large-value payoffs (between
0 and 100), again with small, medium and large val-
ues of K. This should provide some insight not only
into influence of increasing K, but also the actual
value of payoffs themselves. We also investigate the
influence of increasing K when the T and R payoffs
remain the same - the payoffs used in this portion
of the experiment can be found in Table 4. SARSA
utilises α = 0.1, γ = 0.95 and a linear decay mech-
anism for ε that starts at 0.99 and decays linearly to
0.1 mid-way through each episode. It also uses a state
information profile closest to Stateless with a single-
step memory.
Table 3: Parameters used for the first section of the Payoff
Schema experiment. Each column provides the payoff ma-
trix utilitsed by each numbered condition. K is the value of
the Cooperation Index for that payoff matrix column.
Outcome Payoff Value Used
Condition 1 2 3 4 5 6 7
T 0.8 1 1 5 99 56 99
R 0.6 0.9 0.9 3 52 37 98
P 0.5 0.1 0.1 1 51 16 1
S 0 0.6 0 0 0 14 0
K 0.12 0.50 0.80 0.40 0.10 0.50 0.97
4.3 Hypotheses
First and foremost, we wish to evaluate how mSARSA
performs in the environment detailed in Subsection
4.2. According to past research (Collenette et al.,
ICAART 2022 - 14th International Conference on Agents and Artificial Intelligence
152
Table 4: Parameters used for the second section of the Pay-
off Schema experiment. Each column provides the payoff
matrix utilitsed by each condition. K is the value of the Co-
operation Index for that payoff matrix column.
Outcome Payoff Value Used
T 52 52 52 52 52 52 52 52 52
R 51 51 51 51 51 51 51 51 51
P 50 50 48 49 49 48 44 43 33
S 42 47 42 47 48 47 42 42 32
K 0.1 0.2 0.3 0.4 0.5 0.6 0.7 0.8 0.9
2018a), it is likely with the increased and determin-
istic interaction rate that any increase in the propor-
tion of mutual cooperations may be dampened in
comparison with past research. Given the model’s
overall success in mobile scenarios (Collenette et.al.,
2017b), we expect that increased mood will help raise
proportions of mutual cooperation in our own en-
vironment (over those of standard SARSA counter-
parts) even if this increase is smaller than in mobile
agent research. If we do observe increased propor-
tions of mutual cooperation (in comparison with stan-
dard SARSA), we expect that the model will uphold
similarly when tested with the parameters from Col-
lenette et.al., (2017b). As no prior direct data is avail-
able to make a prediction, we hypothesise that when
mSARSA is played directly against SARSA agents, it
may encourage SARSA to attain more mutually coop-
erative outcomes, based on the mixed-strategy results
of Collenette et.al. (2018). This may only be true,
however, after a critical proportion of mSARSA agents
are present in the environment; the Strategy Propor-
tion experiment serves to evaluate this hypothesis and
search for such value. Lastly, it has been shown in
previous research with human participants in the IPD
that increasing K appears to promote increased rates
of cooperation (see Wrightsman et.al., 1972; Colman
et.al., 2018)). We therefore predict that it is possi-
ble mSARSA may follow this trend, particularly given
that mSARSA utilises actual payoff values more exten-
sively than its competitors. The varying of actual pay-
off values (Conditions 1 through 3 versus Condi-
tions 5 through 7) will serve to evaluate if the K value
is purely responsible for any behavioural changes, or
if payoffs must be chosen carefully in terms of exact
values also.
5 RESULTS
5.1 Interaction Structure
As the primary reference point for the analysis of
these data, we first summarise the result data of
the comparable conditions from Collenette et.al.,
(2017b).
Table 5: Proportions of Outcome Types (Mutual Defec-
tions and Mutual Cooperations, respectively) converged to
with 99% confidence intervals in the mobile environment
of past work, summarised from Collenette et.al., (2017b).
S column contains SARSA’s performance, taken from the
Agentstate condition (for comparison with our own SARSA
tests).
Mutual Defection
mA
State Info
0 0.4 0.8 S
Stateless
48.6%
± 1.5
19.7%
± 0.8
1.4%
± 0.1
Agentstate
49.8%
± 1.1
24.3%
± 0.7
6.0%
± 0.5
49.7%
± 1.1
Moodstate
48.4%
± 1.2
24.4%
± 0.6
6.6%
± 0.5
Mutual Cooperation
mA
State Info
0 0.4 0.8 S
Stateless
8.4%
± 0.7
29.7%
± 1.0
78.9%
± 0.5
Agentstate
21.1%
± 0.7
32.1%
± 0.8
63.2%
± 1.2
21.1%
± 0.7
Moodstate
21.3%
± 0.6
31.4%
± 0.8
62.3%
± 1.1
Table 6: Mean Proportions of Outcome Types (Mutual De-
fections and Mutual Cooperations, respectively) averaged
over the last 1000 rounds in the static environment of the
current experiments. S column contains SARSA’s perfor-
mance. * The [Agentstate, 0] condition did not converge on
a final stable behaviour on any of the experimental trials.
Mutual Defection
mA
State Info
0
(SD)
0.4
(SD)
0.8
(SD)
S
(SD)
Stateless
85.13%
(0.24)
49.18%
(11.19)
27.54%
(6.98)
Agentstate
81.86%
(23.08)*
49.61%
(12.90)
26.54%
(6.83)
94.99%
(23.40)
Moodstate
85.43%
(22.52)
49.58%
(12.39)
26.80%
(6.63)
Mutual Cooperation
mA
State Info
0
(SD)
0.4
(SD)
0.8
(SD)
S
(SD)
Stateless
0.55%
(0.24)
9.33%
(2.87)
22.38%
(5.52)
Agentstate
2.89%
(4.39)*
9.52%
(3.44)
23.85%
(6.29)
0.07%
(0.04)
Moodstate
1.54%
(2.99)
9.36%
(3.36)
24.09%
(6.44)
Average proportion of mean cooperation (over the
last 1000 rounds) in the moody learning population
followed a similar trend as in the resultant original
data, if greatly reduced in actual value. The influence
of the Stateless condition does not seem to be present
in the static environment results as in the original mo-
bile data, aside from possibly influencing Mutual Co-
operations when mA is 0. An increase in information
to the learner generally produced a greater proportion
of mutual cooperation in interactions - as did an in-
crease in the value of mA. Mutual defections simi-
larly decreased as more information became available
and mA increased, reaching a point where it was only
slightly higher than mutual cooperation. Importantly,
the proportions of all outcome types were approxi-
mately equal when mA=0.8; this is observable in Ta-
ble 6 with the similar levels of both mutual defection
Augmenting Reinforcement Learning to Enhance Cooperation in the Iterated Prisoner’s Dilemma
153
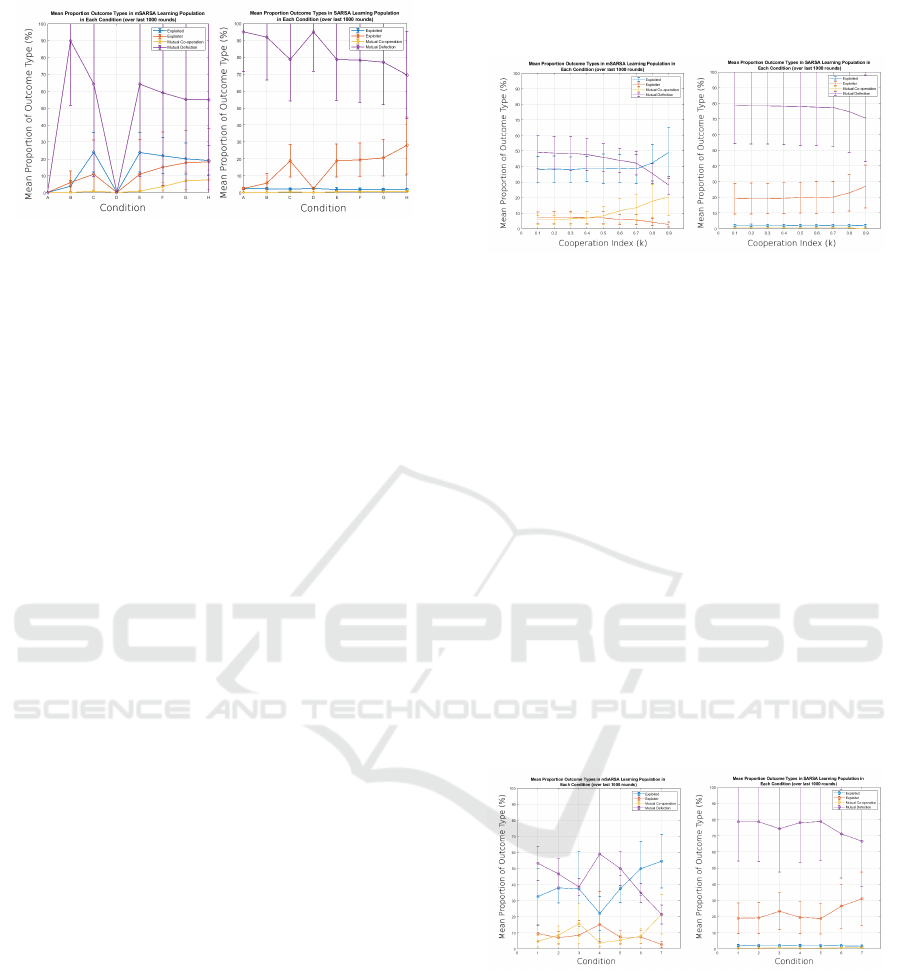
Figure 1: Summary graphs for mSARSA versus SARSA,
displaying mean proportion of outcomes in the last 1000
rounds across the experimental conditions given in Table
2. Error bars show one standard deviation from the mean.
Conditions A and D for mSARSA are marked as null as
mSARSA agents were not present in the analysis population.
and mutual cooperation, which persisted through the
non-mutual interactions also.
At all levels, mSARSA performed more mutual co-
operations and less mutual defections than SARSA.
It also showed a higher preference for mutual defec-
tion, and does not experience as many mutual cooper-
ations, at all condition levels compared to the agents
in Collenette et.al., (2017b). The results of a two-
way between-subjects ANOVA on the summed mu-
tual cooperation data from the last 1000 rounds of
each experiment showed a significant effect of value
of mA on the total amount of last 1000 rounds of mu-
tual cooperation reached (F (2, 396) = 868.68, p <
0.01), and a significant (if weaker) effect of depth of
state information on the same (F (2, 396) = 3.29, p
= .0383). There no statistically significant interaction
effect present between the two (at a significance level
of p=.05).
5.2 Strategy Proportion
As the proportion of mSARSA increases in the envi-
ronment, SARSA’s proportion of exploitation of its
opponents increases. This increase is directly con-
nected to its interactions with mSARSA agents, as ev-
ident by the low proportion of DC outcomes when
the central SARSA agents are not in contact with any
mSARSA agents (see Conditions A and D, where
the analysed agents are not in direct contact with
mSARSA partners). It maintains a high proportion
of mutual defection throughout, as SARSA primarily
defects in our environment. In the mSARSA popula-
tion, the primary learned outcome types are mutual
defection and Sucker outcomes. As the proportion of
mSARSA in the network increases, mutual coopera-
tion and Temptation outcomes increase - in line with
the previous experiment where populations of entirely
mSARSA have equal proportions of outcome types.
5.3 Payoff Schema
Figure 2: Summary graphs for mSARSA versus SARSA,
displaying mean proportion of outcomes in the last 1000
rounds across the experimental conditions given in Table 4.
Error bars show one standard deviation from the mean.
For the basic comparison of increasing values of K
(whilst maintaining actual payoff values of the T and
R payoffs), it seems that mutual cooperation rises
in mSARSA agents (presumably with other mSARSA
agents, as the SARSA outcome proportions show no
such increase) as K gets larger. Mutual defections
similarly decrease, and the proportion of S payoffs ex-
perienced also increases - meaning that overall, when
K increases, mSARSA displays more cooperative be-
haviour to opponents. Outcomes T and P seem to be
most influenced when K>=0.7, whereas those of S
and R seem to change from approximately K=0.4.
With SARSA, it appears that behaviour is unaf-
fected by the increase in K, except at high values
(e.g.K>=0.7). This coincides with the point at which
mSARSA begins to be exploited more often (presum-
ably due to an increase in the latter’s cooperation).
Figure 3: Summary graphs for mSARSA versus SARSA,
displaying mean proportion of outcomes in the last 1000
rounds across the experimental conditions given in Table 3.
Error bars show one standard deviation from the mean.
The change in outcome proportions experienced
by the two strategies varies both between the smaller
versus larger payoff values and as the value of K (the
cooperation index) changes (Figure 3).
For mSARSA, it seems both of these manipulations
to the payoff matrix has an influence on behaviour in
certain ways. As the value of K increases, propor-
tions of mutual defection decrease and proportions
ICAART 2022 - 14th International Conference on Agents and Artificial Intelligence
154

of Sucker outcomes increase. Mutual cooperations
also increase, whereas proportions of Temptation out-
comes do not appear to show a consistently linear pat-
tern. Despite the classical payoff matrix having a K-
value of 0.4, it does not seem to fit in-trend just under
either of its K=0.5 counterparts (Conditions 2 and 6).
This is possibly due to the size of the payoff values
themselves in Condition 4, which are between 1 and
10 (as opposed to between 0 and 1, and 1 and 100
respectively for the other two categories).
When the actual value of payoffs are greater but
the values of K follow the same trend (minimal, mid-
dling and high), these trends for mSARSA appear to
be replicated but with greater exaggeration.
With SARSA, we see possible similar effects
with the mutual defection and Temptation outcomes,
but these differences may be purely reactive to the
greater changes in mSARSA behaviour. As coopera-
tive behaviour increases with payoff matrix change in
mSARSA, SARSA observes more Temptation payoffs
and slightly less mutual defections. As stated previ-
ously, this effect appears more exaggerated when the
payoff values themselves are larger. SARSA seems
fairly inoculated to changes in the payoff matrix in
our environment, with only small amounts of vari-
ation between conditions and almost none at all in
terms of mutually cooperative or Sucker outcomes.
As mSARSA takes payoffs as a greater factor in each
calculation (such as in the calculation of mood) how-
ever, it appears more influenced by its values and the
ratio of cooperative payoffs to non-cooperative pay-
offs (K).
6 ANALYSIS, COMPARISON AND
DISCUSSION
In Collenette et.al., (2017b), the primary trends of be-
haviour observed for mSARSA included an overall de-
crease in the proportion of mutual defections at con-
vergence as the value of mA increased, with a like-
wise increase in mutual cooperations. The interaction
of state information is a little more complex. The ad-
dition of more information above Stateless seems to
keep mutual defections a little higher when mA gets
larger, but still largely below the proportion that nor-
mal SARSA mutually defects at. Conversely, addi-
tional information aids mutual cooperation at lower
levels of mA, but ultimately at the highest end (0.8)
an increase in information hinders the proportion of
mutual cooperations. Again, mSARSA still cooperates
much more frequently than SARSA. When we trans-
pose the algorithm into our environment, we observe
a similar, if compressed, trend to that of the original
data. The increased certainty and consistency of inter-
actions in our environment may have led to more ex-
treme proportions in both instances; for example, our
SARSA defects at twice the proportion of the SARSA
in Collenette et.al., (2017b), and mutually cooperates
almost 400 times less (comparing averages). In terms
of mutual defections, behaviour seemed largely unal-
tered by state information but followed the same trend
as in Collenette et.al., (2017b) regarding mA.
Despite similar trends emerging to earlier work,
however, the proportion of non-mutual outcomes
gives us greater insight into how the algorithm func-
tions here. Even though proportions of mutual de-
fection decreased, and mutual cooperations increased,
they evened out to similar proportions overall ( 25%)
- as did non-mutual outcomes. This ‘evening out’ of
all behaviours is unlike that observed in past work,
where mutual cooperation in mSARSA was the clear
dominant outcome. One possible explanation for
these observations comes from how the value of mood
changes within the algorithm in our environment. As
covered in the final paragraph of Subsection 3.1, there
are two possible equations to use for updating mood
for each agent - MU1 (Collenette et al., 2017b) and
MU2 (from later work; Collenette et.al., 2018). The
latter of these has no direct data available for it (re-
garding mood changes or behaviour of the algorithm
specifically), and so is impractical to compare against;
it also exhibits cyclical behaviour of both mood and
resulting behavioural outcomes, taking many more
cycles to attempt to attain convergence (a primary
limitation for our research in terms of time and hard-
ware availability). It does, however, appear to pro-
vide mSARSA with the reactivity necessary for more
diverse behaviour in such a high-interaction environ-
ment. We observed that with MU1, mSARSA agents
rapidly increase in mood to maximum and then very
rarely fluctuate from that position (if they do, the
mood change is infinitesimally small). These ef-
fect may not have been observed in Collenette et.al.,
(2017b) due to the lower rate of interaction and the
lack of guarantee of interacting with the same part-
ner repeatedly. We opted not to utilise MU2 due to
reasons of practicality (after initial testing), but this is
certainly an avenue of future research worth pursuing.
In essence, agents in our own experiments were
therefore always operating at extremely high moods,
meaning that when any agent initially selects defec-
tion, a new behaviour is then re-selected under the
new, higher ε value (0.9), which is high enough to
lead to near-random behaviour selection. Data not re-
ported in Table 6 is that of the non-mutual behaviours
observed, which were at similar levels to both the
mutual outcomes - suggesting that behaviour is more
Augmenting Reinforcement Learning to Enhance Cooperation in the Iterated Prisoner’s Dilemma
155

randomly selected during the ‘converged’ portion of
the experiment (at the very least, within the last 1000
rounds of each test). This is of important note to fu-
ture researchers who opt to use this algorithm, as an
uninformed selection of interaction structure and en-
vironment may lead to differing efficacy.
Effects of increasing the proportion of mSARSA
in the environment are relatively straight-forward. As
mSARSA has a comparatively high propensity to co-
operate, increasing the proportion of mSARSA agents
in the environment increases the likelihood it will be
exposed to agents of its own kind - this explains the
gradual increase of the mutually cooperative and ex-
ploited outcome proportions (the R and S payoffs re-
spectively). We can see this is the case from look-
ing at the SARSA data; in conditions where the anal-
ysed central group of agents were all made up of
SARSA agents that did not come into direct contact
with mSARSA agents (i.e. conditions A and D, where
mSARSA agents were in the outer corners of the grid).
In these conditions, SARSA’s proportion of T pay-
offs is as minimal as its other payoffs (as it primar-
ily plays with like agents, who also defect heavily).
As the proportion of more cooperative (mSARSA) op-
ponents increases, it finds more opportunities to ex-
ploit. When even 10% of grid agents utilise SARSA,
this significantly impacts the outcomes experienced
by mSARSA; they experience twice as many mutual
defections when there are some SARSA agents present
in the environment than when there were none (com-
pared with data from Interaction Structure). This may
suggest that mSARSA is particularly sensitive, in this
environment, to highly defective or pure-defective
partners. Our data also suggest that in our experi-
ments there was no migration of behaviour over time
(at least within the time frame of 10,000 rounds)
- in contrast to our hypotheses, the introduction of
mSARSA to an environment of SARSA did not encour-
age the latter to cooperate more.
One of the more interesting outcomes of the
three experiments dictated here is the interaction of
mSARSA with K, the cooperation index value. Where
we observed approximately 60% mutual defections
and 5% mutual cooperations in Strategy Proportion:
Condition F, when 48% of agents in the environment
were mSARSA, the alteration of the payoff scheme to-
wards a higher K facilitates half as many mutual de-
fections and four times as many mutual cooperations.
The standard payoff matrix (used throughout Strat-
egy Proportion tests) has a K value of 0.4, meaning
that the value of the payoffs themselves only appears
to have decreased the T proportion slightly, and in-
creased the R proportion slightly (in Figure 2 from
in Figure 1). Observing the consistent trend in human
research that an increased K leads to increased rates of
cooperation (Wrightsman et.al., 1972; Colman et.al.,
2018), it is very positive to see that the more human-
like of the two learning algorithms reacts similarly.
The choice of payoff matrix therefore is an important
tool in maximising mutual cooperation in the network
outlined in this research. We also observe an effect of
the size of the actual payoffs themselves on the out-
come behaviours observed, which is critical informa-
tion for future experimentation. mSARSA seems to
display larger changes to its mutual outcomes when
K increases and the actual value of the payoffs them-
selves are large (see Conditions 5, 6, 7 in Figure 3).
7 CONCLUSIONS
Overall, the experiments detailed have thoroughly
tested the mSARSA algorithm presented in Collenette
et.al. (2017b) and Collenette et.al. (2018) with a
novel interaction structure and environment, and also
tested two further dimensions of interest (environ-
mental presence and cooperation index). We ob-
served similar trends to these past works, but also
highlight the limitations of differing versions of the
algorithm within our grid network where possible.
Namely, there was an exaggeration of weaknesses in
the first version of the algorithm, which were altered
by the authors in later work but in ways that possi-
bly present further technical issue. The moody al-
ternative to SARSA cooperates more than its standard
counterpart, but is vulnerable to exploitation in its first
iteration, meaning that in this particularly intense in-
teraction structure it does not adapt well to poor out-
comes. Additionally, whilst increasing the proportion
of SARSA agents in the environment serves to reaf-
firm this vulnerability to exploitation, altering the co-
operation index K demonstrated that mSARSA follows
behavioural reactivity to this variable previously ob-
served in humans. This offers affirmation to the de-
sign basis of the variant algorithm, and creates poten-
tial for more accurate human behavioural modelling
in future.
We would next like to perform similar evaluations
with the second iteration of the algorithm and repeat
experiments with K with differing levels of agent con-
nectivity to test for interaction effects. We are cur-
rently evaluating the algorithm in dynamic random
networks as an extension of this. There are also many
avenues of experimentation possible for altered ver-
sions of mSARSA; using alternative methods to evalu-
ate the desirability of an outcome, for example.
ICAART 2022 - 14th International Conference on Agents and Artificial Intelligence
156

ACKNOWLEDGEMENTS
This work was part-funded by UK Research and In-
novation (UKRI) and Loughborough University. We
would like to thank Dr. Joe Collenette and Dr. Katie
Atkinson (University of Liverpool) for their provi-
sion of the code from their implementation of Moody
SARSA, and for their friendly support and communi-
cation.
REFERENCES
Barreda-Tarrazona, I., Jaramillo-Guti
´
errez, A., Pavan, M.,
and Sabater-Grande, G. (2017). Individual character-
istics vs. experience: An experimental study on coop-
eration in prisoner’s dilemma. Frontiers in Psychol-
ogy, 8.
Belkaid, M., Cuperlier, N., and Gaussier, P. (2017). Emo-
tional metacontrol of attention: Top-down modulation
of sensorimotor processes in a robotic visual search
task. PLoS ONE, 12(9).
Clore, G. L. and Ortony, A. (2013). Psychological construc-
tion in the occ model of emotion. Emotion Review,
5(4):335 – 343.
Collenette, J., Atkinson, K., Bloembergen, D., and Tuyls,
K. (2017a). Environmental effects on simulated emo-
tional and moody agents. The Knowledge Engineering
Review, 32.
Collenette, J., Atkinson, K., Bloembergen, D., and Tuyls,
K. (2017b). Mood modelling within reinforcement
learning. In Proceedings of ECAL’17, pages 106–113.
MIT Press.
Collenette, J., Atkinson, K., Bloembergen, D., and Tuyls,
K. (2018a). Modelling mood in co-operative emo-
tional agents. In Distributed Autonomous Robotic Sys-
tems, volume 6.
Collenette, J., Atkinson, K., Bloembergen, D., and Tuyls,
K. (2018b). On the role of mobility and interaction
topologies in social dilemmas. In Proceedings of Con-
ference on Artificial Life.
Colman, A. M., Pulford, B. D., and Krockow, E. M. (2018).
Persistent cooperation and gender differences in re-
peated prisoner’s dilemma games: Some things never
change. Acta psychologica, 187:1–8.
Fehr, E. and Schmidt, K. (1999). A theory of fairness, com-
petition, and cooperation. Quarterly Journal of Eco-
nomics, pages 817–868.
Fudenberg, D., Rand, D. G., and Dreber, A. (2012). Slow to
anger and fast to forgive: Cooperation in an uncertain
world. Law & Prosociality eJournal.
Gao, Y. (2012). A reinforcement learning based strategy
for the double-game prisoner’s dilemma. In Proceed-
ings of the First International Conference on Agree-
ment Technologies, volume 918, pages 317–331.
Hertel, G., Neuhof, J., Theuer, T., and Kerr, N. L. (2000).
Mood effects on cooperation in small groups: Does
positive mood simply lead to more cooperation? Cog-
nition and Emotion, 14:441 – 472.
Hristova, E. and Grinberg, M. (2005). Investigation of con-
text effects in iterated prisoner’s dilemma game. In
CONTEX. Lecture Notes in Computer Science, vol-
ume 3554, Berlin, Heidelberg. Springer.
Lin, B., Cecchi, G. A., Bouneffouf, D., Reinen, J., and
Rish, I. (2019). Reinforcement learning models of hu-
man behavior: Reward processing in mental disorders.
ArXiv, abs/1906.11286.
Ortony, A., Clore, G. L., and Collins, A. M. (1988). The
cognitive structure of emotions. New York, NY: Cam-
bridge University Press.
Palfai, T. P. and Salovey, P. (1993). The influence of de-
pressed and elated mood on deductive and inductive
reasoning. Imagination, Cognition and Personality,
13:57 – 71.
Proto, E., Sgroi, D., and Nazneen, M. (2017). The effect
of positive mood on cooperation in repeated interac-
tion. In The Warwick Economics Research Paper Se-
ries (TWERPS) 1141, University of Warwick, Depart-
ment of Economics.
Shteingart, H. and Loewenstein, Y. (2014). Reinforcement
learning and human behavior. Current Opinion in
Neurobiology, 25:93–98.
Sutton, R. and Barto, A. (2018). Reinforcement Learning:
An Introduction. MIT Press, Cambridge, Mass.
Team, P. M. (2021). projectmesa/mesa. https://github.com/
projectmesa/mesa. Last accessed 03 August 2021.
Vaughan, R. T. (2008). Massively multi-robot simulation in
stage. Swarm Intelligence, 2:189–208.
Wilson, A. J. and Wu, H. (2017). At-will relationships:
How an option to walk away affects cooperation and
efficiency. Games Econ. Behav., 102:487–507.
Wrightsman, L. S., O’Connor, J., and Baker, N. J. (1972).
Cooperation and Competition: Readings on Mixed-
Motive Games. Brooks/Cole Pub. Co., Belmont, CA.
Yu, C., Zhang, M., Ren, F., and Tan, G. (2015). Emo-
tional multiagent reinforcement learning in spatial so-
cial dilemmas. IEEE Transactions on Neural Net-
works and Learning Systems, 26:3083–3096.
Zulfiqar, S. and Islam, A. (2017). Exploring the role of
emotions and moods in decision making: Study on the
use of structured decision approach and intuition. In-
ternational Journal of Engineering and Management
Sciences, 2:140–149.
Augmenting Reinforcement Learning to Enhance Cooperation in the Iterated Prisoner’s Dilemma
157
