
Channel Selection for Motor Imagery Task Classification using
Non-linear Separability Measurement
Stuti Chug and Vandana Agarwal
a
Department of Computer Science and Information Systems, BITS Pilani, Pilani Campus, India
Keywords:
Brain Computer Interface, Channel Selection, Non Linearity Measurement, Support Vector Machine.
Abstract:
The EEG based motor imagery task classification requires only those channels which contribute to the maxi-
mum separability of the training data of different classes. The irrelevant channels are therefore not considered
in the formation of feature vectors used in classification. In this paper, we propose a novel algorithm for
efficient channel selection (NLMCS). The algorithm computes the proposed metric λ for non-linearity mea-
surement (NLM) and uses this for channel selection. The algorithm is validated on the benchmarked BCI
competition IV datasets IIa and IIb. The selected channels are then used for extracting Haar wavelet features
and subjected for classification using Support vector Machine. The minimum value of λ corresponds to the
optimal channel selection resulting in the best accuracy of motor imagery task classification. The mean Kappa
coefficient computed for BCI competition IV IIa dataset using the proposed algorithm is 0.65 and it outper-
forms some existing approaches.
1 INTRODUCTION
Brain computer interface (BCI) systems are used in
various application areas such as assistive technology
support based on classification of motor imagery of
EEG patterns of thoughts, communication and gam-
ing to provide a level of independence to people suf-
fering from neuromuscular disorder. Brain computer
interface provides a platform where brain signals are
connected with computer. BCI system uses various
type of signals such as electroencephalogram (EEG),
Electrocorticography (ECog), magnetoencephalogra-
phy (MEG) and functional magnetic resonance imag-
ing (fMRI). However, EEG signals are widely used
in non-invasive BCI system. The basic approach
of BCI is used to convert user brain activity pattern
into corresponding command. BCI system comprises
of different modules such as signal acquisition, pre-
processing for artifact and noise removal, channel
selection, feature extraction and classification. BCI
applications mainly focus on needs of people who
are not able to communicate directly to the world
e.g. medical applications such as deep brain stim-
ulation for Parkinson disease and cochlear implants
for the deaf. BCI introduced an efficient way to con-
vert thoughts into machine commands. Thought pat-
a
https://orcid.org/0000-0002-8942-5114
terns have also been examined in applications such
as controlling a cursor on the screen by brain, choos-
ing a letter from a virtual keyboard, browsing internet,
emotion recognition, motor imagery and gaming (Ab-
dulkader et al., 2015).
The raw EEG signals are captured through a large
number of channels, mounted on the scalp of the per-
son, of which some channels are highly active during
a particular mental activity such as imagining about
the movement of an arm or of a leg. The selection of
such active channels providing useful and discrimina-
tory information is a challenging task. These channels
once selected, are used to extract the features to rep-
resent the thought samples. These samples of EEG
signals are represented as points in the highly multi-
dimensional space. These points belonging to differ-
ent pattern classes may be highly overlapping caus-
ing misclassification or may be separable using higher
order non linear polynomial functions. Linear sep-
arability of these sample points plays important role
in classification of thought patterns. If classification
data is linearly separable then it is easier to classify as
compared to the data which is non-linearly separable.
In literature, highly non-linearly separable EEG data
is classified using an extremely complex deep neu-
ral network that uses a large number of hidden layers
(Zhang et al., 2019). This induces an extremely large
parametric space to work with, especially for com-
Chug, S. and Agarwal, V.
Channel Selection for Motor Imagery Task Classification using Non-linear Separability Measurement.
DOI: 10.5220/0010787300003122
In Proceedings of the 11th International Conference on Pattern Recognition Applications and Methods (ICPRAM 2022), pages 171-178
ISBN: 978-989-758-549-4; ISSN: 2184-4313
Copyright
c
2022 by SCITEPRESS – Science and Technology Publications, Lda. All rights reserved
171
(a)
(b)
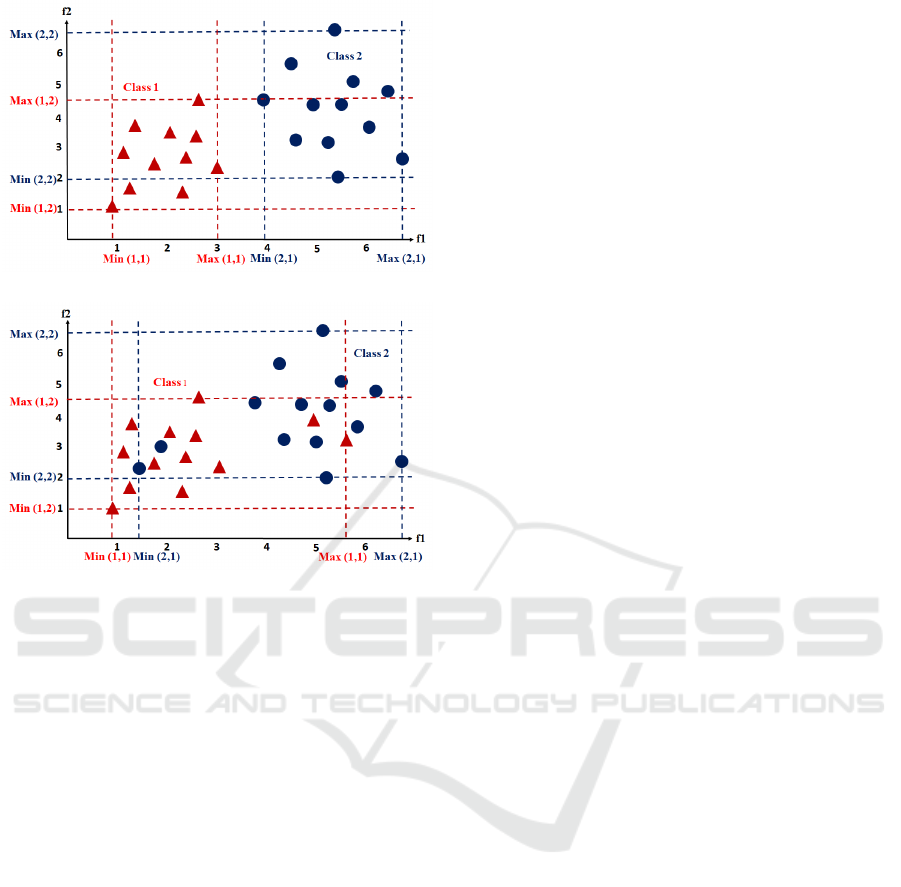
Figure 1: Sample input space (a) sample data is linearly
separable (b) sample data is not separable linearly.
putation of synaptic weights. The optimal parame-
ters thus are computationally intensive and sometimes
difficult to be obtained due to the limitations of al-
gorithms such as Gradient Descent and Genetic al-
gorithms, which get trapped in the local optima. In
this paper, we attempt to explore the linear separabil-
ity of the data to be able to work with linear classifiers
such as Support Vector Machine to save the time from
complex hidden layers and classify thought patterns
more efficiently and accurately. Linear separability of
data is computed using computational geometry, lin-
ear programming, neural network and quadratic pro-
gramming (Elizondo, 2006; Elizondo et al., 2012).
Our Contribution in This Paper: In this paper, we
propose a novel algorithm for Non-Linearity Mea-
surement (NLM) metric to compute the best channels
in-order to improve the motor imagery task classifica-
tion. This algorithm uses the raw EEG data from all
channels initially and computes the proposed NLM
metric for all classes pairwise for the given combina-
tion of channels. The minimum value of NLM metric
is then used to select the best channels for classifi-
cation. The proposed algorithm is validated with the
bench marked BCI competition IV datasets IIa and
IIb. The algorithm performance has been measured in
terms of accuracy and Kappa coefficient, and it out-
performs some of the existing work in the same do-
main.
This paper is organized as follow: Section 2 de-
scribes the brief literature survey on channel section,
Section 3 presents the basic framework and the pro-
posed algorithm, section 4 discusses the results and
section 5 presents the conclusion.
2 RELATED WORK
The aim of using a channel selection algorithm is to
enhance the classification accuracy by reducing over-
fitting issue and also reducing computational com-
plexity while using EEG data. Channel selection is
usually considered as part of the feature extraction
process.
Channel selection algorithms are based on prior
information regarding scalp region of interest of mo-
tor imagery task and iteratively optimize the most rel-
evant channels (Shenoy and Vinod, 2014). The au-
thors showed that their algorithm gives 90.77% ac-
curacy on BCI Competition III dataset IVa data us-
ing ten channels. A real-time feedback based Iter-
RelCen method using relief algorithm gives 85% ac-
curacy on self-data (Shan et al., 2015). This algo-
rithm is not suitable for the multi-class model and
is time-consuming. ReliefF-based channel selection
is used for reducing number of channels for conve-
nience in practical usage in DEAP dataset (Zhang
et al., 2016). CKSCSP method obtained a minimum
set of relevant channels along with the spatial region
of brain, with 84.55% accuracy on BCI Competition
III dataset (Kirar and Agrawal, 2017). Cohen’s d ef-
fect size CSP (E-CSP) channel selection algorithm
eliminates those channels which do not give any use-
ful information by using z-score (Baig et al., 2020;
Das and Suresh, 2015). It shows 85.85% classifica-
tion accuracy on BCI Competition III dataset IVa by
using 9 channels. Sequential Floating Forward Se-
lection (SFFS) technique adds and removes channels
according to its Signal Characteristics Advantage Dis-
advantage P300 (Baig et al., 2020; Qiu et al., 2016).
In ICA-BCI system subject specific minimal channel
subset was selected to produce high classification ac-
curacy but, in this algorithm, the minimal set of chan-
nels is greater than 5-8 (Zhou et al., 2019). A detailed
review on channel section techniques can be found in
(Baig et al., 2020).
The raw EEG data from selected channels is sub-
jected for feature extraction using various methods
such as Fourier transform, Discrete Wavelet transform
(DWT) & Haar wavelet (Nicolas-Alonso and Gomez-
ICPRAM 2022 - 11th International Conference on Pattern Recognition Applications and Methods
172
Gil, 2012). Various classification algorithms are used
for motor imagery classification namely: linear clas-
sifier, nonlinear Bayesian classifier, nearest neighbor
classifier, neural network and combination of classi-
fiers. Linear classifiers use linear functions for dis-
tinguishing the classes such as Linear discriminant
analysis (LDA) and support vector machine (SVM)
(Gonzalez et al., 2013; Nicolas-Alonso and Gomez-
Gil, 2012).
Power spectral density (PSD) technique adopted
for feature extraction on various frequency transfor-
mations enhances the classification performance us-
ing LDA classifier (Alam et al., 2021). In ”Dis-
tance Preservation to Local Mean” [DPLM] approach
for dimensionality reduction the local architecture of
the features is preserved by preserving distances to
local means (Davoudi et al., 2017). (Gaur et al.,
2018) introduced a pre-processing filter approach
”Subject Specific Multivariate EMD Filter” [SS-
MEMDBF]. The filters based on MEMD reduce the
non-stationaries caused by inter and intrasubject dif-
ferences, thus obtaining enhanced EEG signals. For
classification, the author used Riemannian mean com-
putation for all classes. A multi class time-frequency
CSP algorithm for motor imagery feature extraction
with three different classifiers named Linear Discrim-
inant Analysis (LDA), Na
¨
ıve Bayes (NVB), and Sup-
port Vector Machine (SVM) was proposed by (Zhang
and Eskandarian, 2020). Sparse time-frequency seg-
ment common spatial pattern (STFSCSP) algorithm is
used for features selection in multiple time-frequency
segments and the Weighted Na
¨
ıve Bayesian Clas-
sifier (WNBC) was used as classifier (Miao et al.,
2017). Bilinear sub-manifold learning (BSML) clas-
sification algorithm was proposed to classify the data
on a learned intrinsic sub-manifold based on high-
dimensional Riemannian manifold (Xie et al., 2016).
3 PROPOSED ALGORITHM
In the present work, we propose to compute the non
linear separability of the training samples belonging
to different motor imagery classes. Each sample is
represented by a d-dimensional point, where d is the
total number of features. The j
th
training sample of
p
th
class is represented by the feature vector T
p j
given
as T
p j
= (x
1
p j
, x
2
p j
, x
3
p j
, . . . x
i
p j
, . . . x
d
p j
). If the number
of intersection points between two classes is less, then
the data is highly linear separable. A new metric for
NLM for finding the optimal number of channels is
proposed. All combinations of the channels are gen-
erated and the NLM value for each combination is
computed.
Algorithm 1: NLM pairwise (T
C
a
,p,k).
Input: T
C
a
: Feature matrix obtained using
equation (9), class p, class k
Output: λ
C
pk
D=s*t // D is the total no of features
from ’s’ selected channels
N
pk
=0 // Number of overlapping feature
points between class p & k
for class u = [p,k] do
for each dimension i = 1 to D do
Min(u, i) = Min
j
(x
i
u j
);
Max(u, i) = Max
j
(x
i
u j
);
for u =[p,k] do
for v = [p,k] do
for each training feature vector
[T
c
r1
au j
T
c
r2
au j
T
c
r3
au j
...T
c
rs
au j
] for class u
count=0 // Initialize count as 0
if u 6= v
for each dimension i = 1 to D do
if x
i
u j
>= Min(v,i)&&x
i
u j
<=
Max(v, i) then
count = count + 1;
if count == D then
N
pk
= N
pk
+ 1 // training sample
adds to overlapping
Compute λ
C
pk
=
N
pk
N
p
+N
k
// N
K
:Number of
samples in class k
Consider a two class sample data represented us-
ing 2-dimensional feature vectors [Fig.1]. The class
1 data is represented by red dots and has 11 samples,
while class 2 is represented by blue dots which has 12
samples [Fig.1a]. The notion used for sample size of a
class p is N
p
as is explained after equation (1). In this
example, N
1
=11 and N
2
=12. The term x
i
p j
represents
the i
th
feature value extracted from the j
th
sample of
the class p where p represents class index (p = 1, 2),
j represents the sample number ( j = 1, 2, ..m) and i
represents the feature number (i = 1, 2, ...d).
In Fig.1, we have shown samples for two classes
p = 1 and p = 2, where m = 11 for p = 1, and m = 12
for p = 2. The axes of coordinate plane are f
1
and
f
2
. The range of feature values is computed for each
class in each dimension along the axes f
1
and f
2
re-
spectively. Each sample data T
p j
is represented by its
feature vector (x
1
p j
,x
2
p j
) and is shown as a point. The
range of class p samples is defined in f
1
dimension by
Min(p,1) and Max(p,1), where Min and Max repre-
sent the minimum and maximum of all data samples
T
p j
( j = 1, 2) in f
1
dimension. Similarly, Min(p,2)
and Max(p,2) represent the minimum and maximum
Channel Selection for Motor Imagery Task Classification using Non-linear Separability Measurement
173
Algorithm 2: NLMCS (T).
Input: Feature matrix T of training data set
Output: C={C
r1
,C
r2
,C
r3
, ...C
rs
}
All Channels = [c
1
, c
2
, c
3
, ...c
q
] // q number
of channels initially
Min NLM=10.0; C=All channels;
// Initialize
for a = 1 to 2
q
− 1 do
ch = a
th
combination of channel set
{C
r1
,C
r2
,C
r3
, ...C
rs
} using (7)
Sum = 0;
T
c
a
= feature matrix obtained using (9) for
a
th
channel set
for p= 1: (no. of classes-1) do
for k= p+1: no. of classes do
λ
ch
pk
= NLM pairwise[T
c
a
, p, k]
Sum = Sum + λ
ch
pk
λ
a
= Sum; // using (2)
if λ
a
<= Min NLM then
Min NLM = λ
a
; C = ch;
return C // C corresponds to Min NLM
(a)
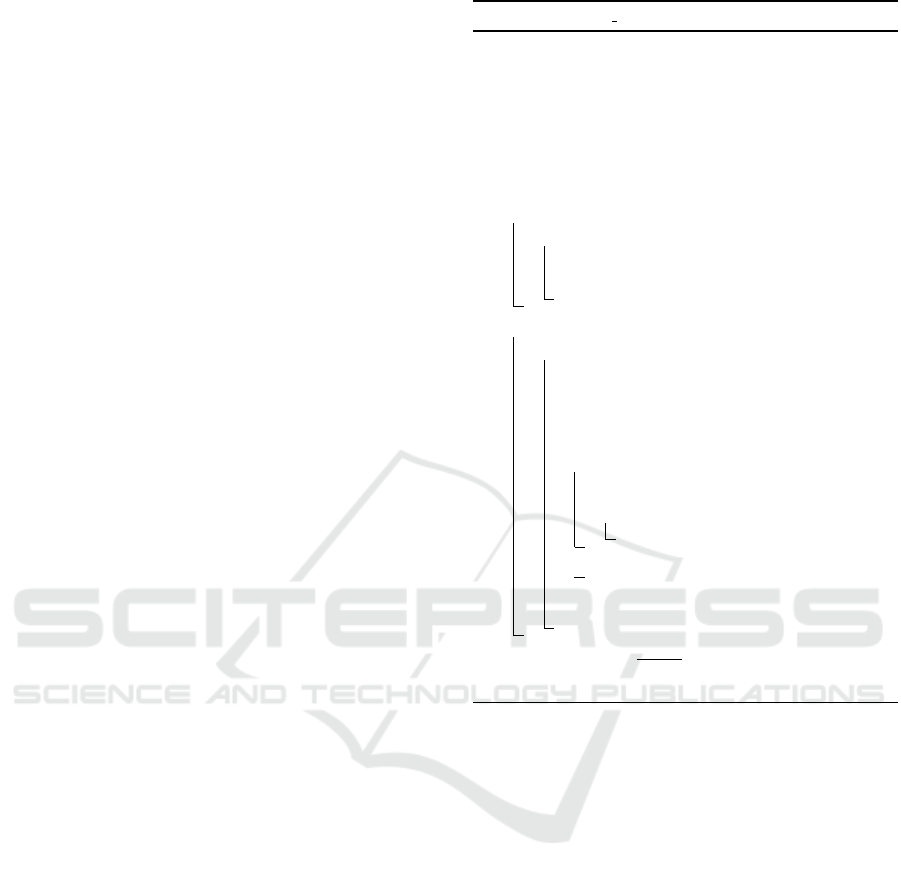
(b)
Figure 2: The proposed NLM metric is not affected by the
class imbalance data. Example class size N
1
= 6, and N
2
=
21. It is affected by the overall spread of overlapping data
across other classes. In (a)λ
12
= 6/(6+21) = 0.222 (b) λ
12
=
20/(21+6) = 0.74.
values in f
2
direction.
A data sample T
p j
from class p is investigated if it
overlaps with data samples of any other class k (where
k 6= p) by checking if x
i
p j
>= Min (k, i) and x
i
p j
<=
Max (k, i) for all i = 1, 2, ...d. If the overlap is in all di-
mensions, the data sample T
p j
from class p is consid-
ered to be overlapping with class k samples, causing
non linear separability. This contributes in the pro-
posed metric (λ
pk
) of NLM between classes p and k
and is defined as follows.
λ
pk
=
N
pk
N
p
+ N
k
(1)
Where N
pk
is the total number of overlapping
points between classes p and k, and N
p
and N
k
are
the total number of samples in classes p and k respec-
tively [Algorithm 1]. The proposed metric of non lin-
earity measurement is given below
λ =
n
∑
p,k=1
p6=k
λ
pk
(2)
Where n is the total number of classes in given
dataset.
The metric (λ
pk
) is effectively used for the class
balanced data set used in this study. However, the
metric does not impose any penalty for the class im-
balanced data set [Fig.2]
The feature matrix T of the training data involv-
ing all channels prior to channel selection is shown in
equation (3).
T =
x
1
11
x
2
11
x
3
11
...
x
d
11
x
1
12
x
2
12
x
3
12
...
x
d
12
: : : : :
x
1
1N
1
x
2
1N
1
x
3
1N
1
...
x
d
1N
1
x
1
21
x
2
21
x
3
21
...
x
d
21
x
1
22
x
2
22
x
3
22
...
x
d
22
: : : : :
x
1
2N
2
x
2
2N
2
x
3
2N
2
...
x
d
2N
2
: : : : :
x
1
n1
x
2
n1
x
3
n1
...
x
d
n1
x
1
n2
x
2
n2
x
3
n2
...
x
d
n2
: : : : :
x
1
nN
n
x
2
nN
n
x
3
nN
n
...
x
d
nN
n
class 1: N
1
feature vectors
class 2: N
2
feature vectors
class n: N
n
feature vectors
(3)
The size of feature matrix T is r ∗d, where r is the
number of rows in the feature matrix and is equal to
the total number of samples in the training data given
as.
r = N
1
+ N
2
+ ... + N
n
(4)
ICPRAM 2022 - 11th International Conference on Pattern Recognition Applications and Methods
174

The number of columns in T is d, which is equal
to the total number of channels multiplied by the
number of features extracted for a channel [assuming
equal number of features extracted from each chan-
nel]. Total number of classes is n and N
p
is the num-
ber of training samples in class p. The raw feature
matrix T given in equation (3) involves all channels
prior to channel selection. If there are a total of q
channels (say C
1
,C
2
,C
3
...C
q
) initially and if t features
are extracted from each channel, then the total num-
ber of features d is equal to q ∗ t. Then the matrix T
in equation (3) can further be illustrated as
T =
x
1
11
...
x
t
11
...
x
(q−1)t+1
11
...
x
qt
11
x
1
12
...
x
t
12
...
x
(q−1)t+1
12
...
x
qt
12
: : : : : : :
x
1
1N
1
...
x
t
1N
1
...
x
(q−1)t+1
1N
1
...
x
qt
1N
1
x
1
21
...
x
t
21
...
x
(q−1)t+1
21
...
x
qt
21
x
1
22
...
x
t
22
...
x
(q−1)t+1
22
...
x
qt
22
: : : : : : :
x
1
2N
2
...
x
t
2N
2
...
x
(q−1)t+1
2N
2
...
x
qt
2N
2
: : : : : : :
x
1
n1
...
x
t
n1
...
x
(q−1)t+1
n1
...
x
qt
n1
x
1
n2
...
x
t
n2
...
x
(q−1)t+1
n2
...
x
qt
n2
: : : : : : :
x
1
nN
n
...
x
t
nN
n
...
x
(q−1)t+1
nN
n
...
x
qt
nN
n
Channel C
1
Channel C
q
(5)
The class labels along with corresponding rows
are used in the NLM algorithm for the purpose of
computing λ
pk
for classes p and k. The features ma-
trix in equation (5) above involves all channels which
is refined by selecting the channels appropriately. An
inclusion of channel consists of retaining the appro-
priate columns. For example, if the channel C
s
is se-
lected, then all t columns are used for the j
th
sample
of class p and is given by
h
x
(s−1)t+1
p j
x
(s−1)t+2
p j
x
(s−1)t+3
p j
... x
st
p j
i
The combination of selected channels of all q chan-
nels is represented by the bit string of 0
s
and 1
s
where
0 represents the absence and 1 represents the pres-
ence of a channel in an experimental run. For ex-
ample a combination 1011001 represents the selec-
tion of C
1
,C
3
,C
4
and C
7
channels. This bit string is
also equivalent to a unique decimal number (64 + 0 +
16 + 8 + 0 + 0 + 1 = 89). The position of bit for each
channel is fixed. The channel numbering can corre-
spond to either left to right or right to left in the bit
string and remains fixed throughout the experiment.
In order to form the combinations, we systematically
iterate from 1 to 2
q
−1. This keeps generating equiva-
lent bit string in each iteration which is used to extract
the relevant columns from the feature matrix defined
in equation (5). A feature matrix T
C
a
is obtained by
retaining all columns corresponding to the included
channels C represented as 1
s
in the binary equivalent
of the number a. Recalling the above example of a
taken as 1011001, the selected channels are written as
a set {C
1
,C
3
,C
4
,C
7
}. If q = 10 (say) then,
{C
1
,C
3
,C
4
,C
7
} ⊆ {C
1
,C
2
,C
3
,C
4
,C
5
,C
6
,
C
7
,C
8
,C
9
,C
10
} (6)
To generalize, if a total of s channels
{C
r1
,C
r2
, ..C
rs
} are selected using the binary
equivalent of a, then the selected channels can be
represented as a subset of all q channels.
{C
r1
,C
r2
, ..C
rs
} ⊆ {C
1
,C
2
...C
q
} (7)
where s ≤ q. Let the set of selected channels
{C
r1
,C
r2
, ...C
rs
}, obtained using binary equivalent of
a, be represented as C. Then the feature matrix
formed by retaining the corresponding t*s number of
columns in T from equation (5) can be denoted by T
C
a
.
Let us define,
T
c
rb
ap j
=
h
x
(r
b
−1)t+1
p j
x
(r
b
−1)t+2
p j
... x
(r
b
−1)t+t
p j
i
1×t
(8)
Then,
T
C
a
=
T
C
r1
a11
T
C
r2
a11
...
T
C
rs
a11
T
C
r1
a12
T
C
r2
a12
...
T
C
rs
a12
: : : :
T
C
r1
a1N
1
T
C
r2
a1N
1
...
T
C
rs
a1N
1
T
C
r1
a21
T
C
r2
a21
...
T
C
rs
a21
T
C
r1
a22
T
C
r2
a22
...
T
C
rs
a22
: : : :
T
C
r1
a2N
2
T
C
r
2
a2N
2
...
T
C
rs
a2N
2
: : : :
T
C
r1
an1
T
C
r2
an1
...
T
C
rs
an1
T
C
r1
an2
T
C
r2
an2
...
T
C
rs
an2
: : : :
T
C
r1
anN
n
T
C
r2
anN
n
...
T
C
rs
anN
n
Class 1
Class 2
Class n
(9)
The size of matrix T
C
a
is given as r ∗ st, where r is ob-
tained using equation (4), s is the number of channels
selected equation (7) and t is the number of features
extracted from each channel. Each of T
C
rb
ap j
in equa-
tion (9), for all classes p=1,2,...n and their samples
Channel Selection for Motor Imagery Task Classification using Non-linear Separability Measurement
175
indexed by j=1,2,...,N
p
, is then replaced by its corre-
sponding vector as defined in equation (8). The al-
gorithm NLMCS() [Algorithm 2] returns the selected
channels to be used for obtaining T
c
a
using (9) to train
the classifier for motor imagery task classification.
4 EXPERIMENTAL SETUP
4.1 Data Set Description
In this paper, two bench marked datasets namely
BCI Competition IV dataset IIa and IIb were used.
BCI Competition IV dataset IIa has 4 classes of
motor imagery tasks. The EEG signals were col-
lected from nine volunteer participants including four
classes namely left hand, right hand, tongue and feet.
Two sessions of motor imagery tasks were recorded
from each subject, one for training and the other for
evaluation. Each session contains 288 trials of data
recorded with 25 channels (22 EEG Channels and
3 EOG channels). BCI Competition IV dataset IIb
has 2 classes of motor imagery tasks. The EEG
signals were collected from nine volunteer partici-
pants including two classes namely left hand and right
hand movements. Two sessions of motor imagery
tasks were recorded from each subject one for train-
ing and the other for evaluation. Each session con-
tains 120 trials of data recorded with 3 channels [
http://www.bbci.de /competition/iv/] .
4.2 Experimental Evaluation
The performance of the proposed algorithm is eval-
uated on BBCI Competition IV datasets IIa and IIb
as discussed above. The BCI Competition IV IIa
dataset has nine subjects as is mentioned above and
each subject data is divided into training and test-
ing. We train the model on training dataset and val-
idate the accuracy on testing dataset. Out of the 25
channels, we initially used 10 channels subset (i.e
11,13,15,19,20,21,22,23,24,25) for this experiment to
reduce the exponential time complexity. For these 10
channels, 1023 combinations (2
10
-1) are generated.
Thirty features were extracted using Haar wavelet
with parameters n=5 and m=4 (where n and m are lev-
els of decomposition) from each of the 10 channels on
training dataset. The feature vector size for each train-
ing sample class is taken as 600 (60 features* number
of channels). The best channels were selected using
the proposed NLMCS algorithm and used for classi-
fication using Support Vector Machine (SVM). Two
performance measures were used to evaluate the per-
formance of the proposed algorithm; cohen’s kappa
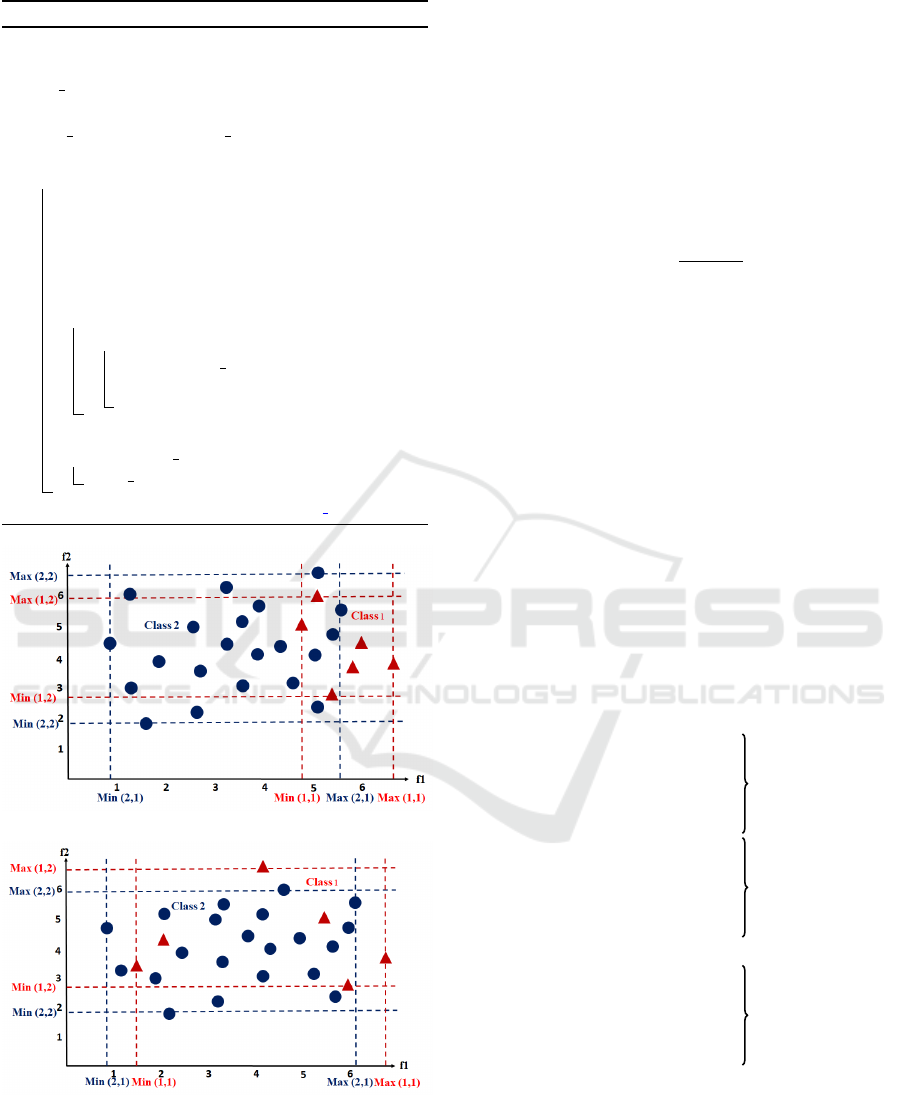
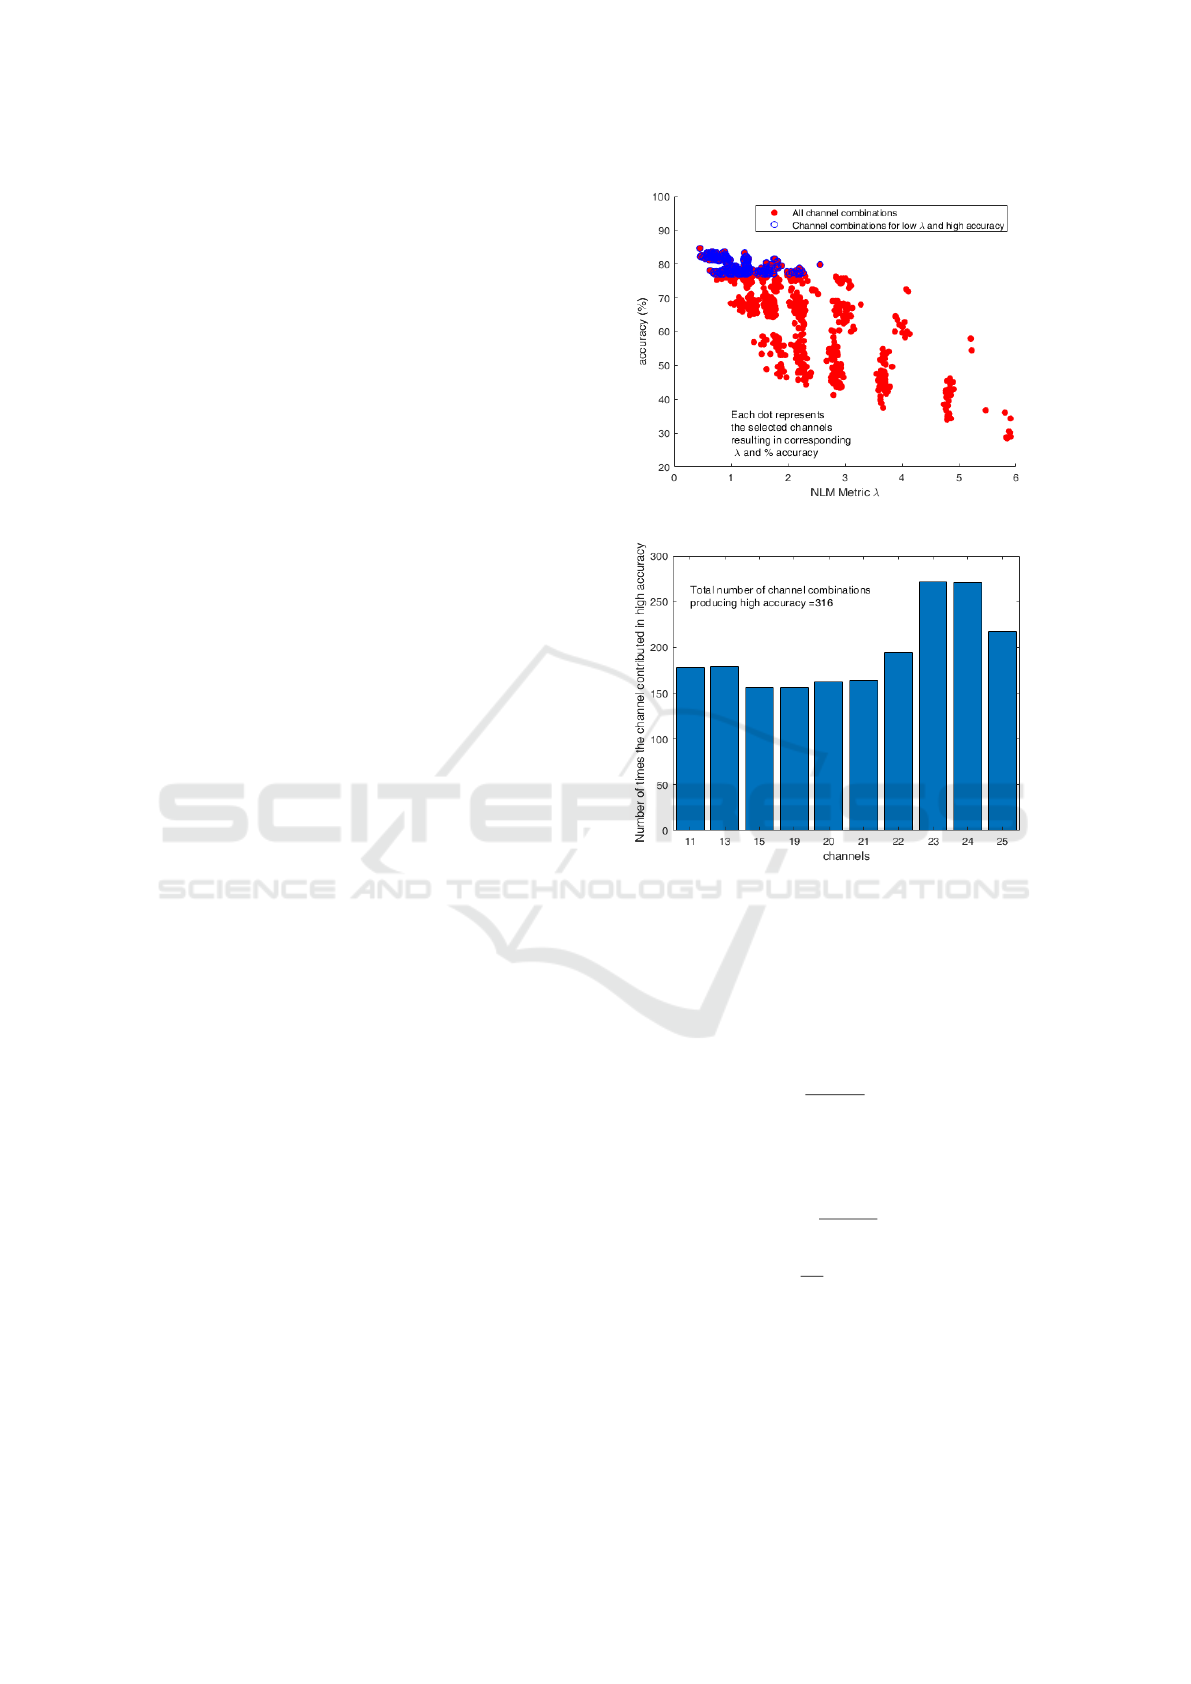
(a)
(b)
Figure 3: Channel selection using NLMCS() (a) NLM met-
ric λ versus accuracy scatter graph (b) Number of times
channels contributed in high accuracy.
cofficient(k) and accuracy (Acc) computed using the
diagonal values of confusion matrix (Table 3). The
accuracy (Acc) was computed as the ratio.
Acc =
∑
n
t=1
n
t
1
∑
n
t=1
n
t
2
∗ 100 (10)
Cohen’s kappa coefficient given below is used for
evaluating the performance of the proposed algo-
rithm.
κ =
P
o
− P
a
1 − P
a
(11)
P
a
=
1
N
2
n
∑
t=1
n
t
1
∗ n
t
2
(12)
where, P
o
and P
a
represent observed agreement and
chance agreement on test samples respectively. N is
the total number of test samples, n is the total number
of classes, n
t
1
is the total number of samples predicted
to be belonging to class t and n
t
2
is the total number of
samples from actual class t. The proposed algorithm
ICPRAM 2022 - 11th International Conference on Pattern Recognition Applications and Methods
176

Table 1: NLM and accuracy of each subject with respective channels selected using proposed algorithm.
BCI Comp IV dataset IIa BCI Comp IV dataset IIb
Subject
Channels
NLM
Acc(%)
Channels
NLM
Acc(%)
11 13 15 19 20 21 22 23 24 25 1 2 3
Sub 1 0 0 1 1 1 1 1 1 1 1 0.438 61.458 0 1 0 0.870 55
Sub 2 1 1 1 1 0 0 1 1 0 1 0.544 57.916 1 1 1 0.808 66.32
Sub 3 0 1 1 0 0 0 1 1 0 1 0.640 56.944 1 0 1 0.708 60.32
Sub 4 1 1 0 1 0 0 1 1 0 0 0.435 55.55 0 1 1 0.879 54.07
Sub 5 1 1 0 1 0 0 1 1 1 1 0.448 84.680 1 0 1 0.735 67.20
Sub 6 1 1 1 0 0 1 0 1 1 1 0.324 54.166 0 0 1 0.996 65.77
Sub 7 1 1 0 0 1 0 1 1 1 1 0.397 78.819 1 1 0 0.801 61.43
Sub 8 0 0 1 0 1 0 1 1 1 1 0.398 75.694 1 1 1 0.829 52.61
Sub 9 0 0 0 0 0 0 0 1 1 1 0.317 62.152 1 1 1 0.892 56.73
Table 2: Kappa values of the proposed approach and existing approaches for BCI competition IV IIa dataset.
Study Approach #C 1 2 3 4 5 6 7 8 9 Mean
(Xie et al., 2016) TSSM+LDA 22 0.77 0.33 0.77 0.51 0.35 0.36 0.71 0.72 0.83 0.59
(Davoudi et al., 2017) DPLM 22 0.75 0.49 0.76 0.49 0.34 0.36 0.68 0.76 0.76 0.60
(Miao et al., 2017) DSFTP 22 0.63 0.43 0.74 0.54 0.19 0.26 0.63 0.62 0.69 0.53
(Gaur et al., 2018) SS-
MEMDBF
22 0.86 0.24 0.70 0.68 0.36 0.34 0.66 0.75 0.82 0.60
(Zhang and Eskandarian,
2020)
TFCSP 22 0.62 0.36 0.76 0.40 0.29 0.34 0.59 0.57 0.62 0.51
(Alam et al., 2021) FE-PSD 22 0.47 0.48 0.92 0.60 0.61 0.50 0.53 0.72 0.68 0.61
Proposed Algorithm NLMCS <=10 0.61 0.49 0.61 0.58 0.81 0.53 0.78 0.77 0.67 0.65
Table 3: Confusion matrix for subject 1.
Predicted class
1 2 3 4
1 35 16 13 8
2 14 44 9 5
3 8 8 50 6
Actual
class
4 7 6 7 52
was implemented using MATLAB R2020b and all ex-
periments were performed on Intel(R) Core(TM) i5-
4590 CPU Processor(3.30GHz).
4.3 Results and Discussion
This section presents the results of classification accu-
racy using the proposed NLMCS() algorithm on both
BCI Competition IV datasets IIa and IIb. These re-
sults indicate that if data is more linearly separable
then classification accuracy will enhance. Fig.2(a)
displays the effect of NLM on accuracy where each
point is a unique combination of channels. The figure
depicts the scatter plot of 2
10
(=1024) points repre-
senting unique combinations of 10 different channels.
To visually depict the channel selection, in this fig-
ure the training data used is of subject 5, while sim-
ilar plots for other subject are not displayed here to
avoid redundant figures. It is observed from the figure
that the maximum accuracy (84.680%) is associated
with the minimum NLM value (0.448) on one chan-
nel combination and the minimum accuracy (29%) is
associated with with the maximum NLM value (5.9)
on another channel combination. All combinations
of channels that attribute to high accuracy (greater
than 77% in the figure) and low NLM metric λ (lesser
than 6.0) are displayed as blue circles in Fig. 2(a).
Of these 316 such different combinations out of to-
tal 1024 combinations, a few channels heavily con-
tributed, while other channels were not involved in
high accuracy. This observation is presented in Fig.
2(b). It is observed that channels 15 and 19 were least
active, while channels 23 and 24 contributed the most
for high accuracy. Table 1 summarises the NLM met-
ric (λ) values along with the selected channels to pro-
duce maximum accuracy for both the datasets. The
accuracy (Acc) and Kappa coefficient (K) where com-
puted using equations (10) and (11).
The proposed algorithm achieved a mean kappa
values of 0.65 for all subjects on less than 10 chan-
nels. This value was cross-validated on 10 indepen-
dent runs. The comparative analysis with previous
studies of BCI competition IV dataset IIa shows that
the proposed algorithm achieves better results com-
pared to other studies in literature as in Table 2. The
proposed channel selection algorithm (NLMCS) com-
putation time is 13.107 sec, training computation time
through SVM is 0.599 sec and total testing computa-
tion time for 288 samples is 2.867 sec. Per sample,
the testing time comes out 0.0097 sec.
Channel Selection for Motor Imagery Task Classification using Non-linear Separability Measurement
177

5 CONCLUSIONS
In this paper, a computational geometry-based algo-
rithm is proposed for selecting the optimal number
of channels which is based on non-linear separabil-
ity measurement. The proposed algorithm is evalu-
ated on both BCI competition IV datasets IIa and IIb.
In this work, an effect of low NLM metric (λ) value
on high accuracy has been investigated by using the
EEG channels that are used to compute such λ. Al-
though, the most effective channels out of the 10 ini-
tial channels have been selected, yet the potential of
all 25 channels has not been explored. Based on pro-
posed NLMCS() algorithm, we are motivated to apply
clustering to compute the λ value for clusters between
two classes. In future, the work will be extended for
all channels and a subject independent model will be
built on features taken from the selected channels de-
sign for use in self evolving neural network for EEG
classification for improved accuracy.
REFERENCES
Abdulkader, S. N., Atia, A., and Mostafa, M.-S. M. (2015).
Brain computer interfacing: Applications and chal-
lenges. Egyptian Informatics Journal, 16(2):213–230.
Alam, M. N., Ibrahimy, M. I., and Motakabber, S. (2021).
Feature extraction of eeg signal by power spectral den-
sity for motor imagery based bci. In 2021 8th Interna-
tional Conference on Computer and Communication
Engineering (ICCCE), pages 234–237. IEEE.
Baig, M. Z., Aslam, N., and Shum, H. P. (2020). Filtering
techniques for channel selection in motor imagery eeg
applications: a survey. Artificial intelligence review,
53(2):1207–1232.
Das, A. and Suresh, S. (2015). An effect-size based chan-
nel selection algorithm for mental task classification
in brain computer interface. In 2015 IEEE Interna-
tional Conference on Systems, Man, and Cybernetics,
pages 3140–3145. IEEE.
Davoudi, A., Ghidary, S. S., and Sadatnejad, K. (2017). Di-
mensionality reduction based on distance preservation
to local mean for symmetric positive definite matrices
and its application in brain–computer interfaces. Jour-
nal of neural engineering, 14(3):036019.
Elizondo, D. (2006). The linear separability problem: Some
testing methods. IEEE Transactions on neural net-
works, 17(2):330–344.
Elizondo, D. A., Birkenhead, R., Gamez, M., Garcia, N.,
and Alfaro, E. (2012). Linear separability and classifi-
cation complexity. Expert Systems with Applications,
39(9):7796–7807.
Gaur, P., Pachori, R. B., Wang, H., and Prasad, G. (2018).
A multi-class eeg-based bci classification using multi-
variate empirical mode decomposition based filtering
and riemannian geometry. Expert Systems with Appli-
cations, 95:201–211.
Gonzalez, A., Nambu, I., Hokari, H., Iwahashi, M., and
Wada, Y. (2013). Towards the classification of single-
trial event-related potentials using adapted wavelets
and particle swarm optimization. In 2013 IEEE In-
ternational Conference on Systems, Man, and Cyber-
netics, pages 3089–3094. IEEE.
Kirar, J. S. and Agrawal, R. (2017). Composite kernel sup-
port vector machine based performance enhancement
of brain computer interface in conjunction with spa-
tial filter. Biomedical Signal Processing and Control,
33:151–160.
Miao, M., Zeng, H., Wang, A., Zhao, C., and Liu, F.
(2017). Discriminative spatial-frequency-temporal
feature extraction and classification of motor im-
agery eeg: An sparse regression and weighted na
¨
ıve
bayesian classifier-based approach. Journal of neuro-
science methods, 278:13–24.
Nicolas-Alonso, L. F. and Gomez-Gil, J. (2012). Brain
computer interfaces, a review. sensors, 12(2):1211–
1279.
Qiu, Z., Jin, J., Lam, H.-K., Zhang, Y., Wang, X., and Ci-
chocki, A. (2016). Improved sffs method for channel
selection in motor imagery based bci. Neurocomput-
ing, 207:519–527.
Shan, H., Xu, H., Zhu, S., and He, B. (2015). A novel
channel selection method for optimal classification in
different motor imagery bci paradigms. Biomedical
engineering online, 14(1):1–18.
Shenoy, H. V. and Vinod, A. P. (2014). An iterative opti-
mization technique for robust channel selection in mo-
tor imagery based brain computer interface. In 2014
IEEE International Conference on Systems, Man, and
Cybernetics (SMC), pages 1858–1863. IEEE.
Xie, X., Yu, Z. L., Lu, H., Gu, Z., and Li, Y. (2016).
Motor imagery classification based on bilinear sub-
manifold learning of symmetric positive-definite ma-
trices. IEEE Transactions on Neural Systems and Re-
habilitation Engineering, 25(6):504–516.
Zhang, C. and Eskandarian, A. (2020). A computation-
ally efficient multiclass time-frequency common spa-
tial pattern analysis on eeg motor imagery. In 2020
42nd Annual International Conference of the IEEE
Engineering in Medicine & Biology Society (EMBC),
pages 514–518. IEEE.
Zhang, J., Chen, M., Hu, S., Cao, Y., and Kozma, R. (2016).
Pnn for eeg-based emotion recognition. In 2016 IEEE
international conference on Systems, Man, and Cy-
bernetics (SMC), pages 002319–002323. IEEE.
Zhang, R., Zong, Q., Dou, L., and Zhao, X. (2019). A novel
hybrid deep learning scheme for four-class motor im-
agery classification. Journal of neural engineering,
16(6):066004.
Zhou, B., Wu, X., Ruan, J., Zhao, L., and Zhang, L. (2019).
How many channels are suitable for independent com-
ponent analysis in motor imagery brain-computer in-
terface. Biomedical Signal Processing and Control,
50:103–120.
ICPRAM 2022 - 11th International Conference on Pattern Recognition Applications and Methods
178
