
Towards a Low-cost Vision System for Real-time Pavement Condition
Assessment
Kehinde Olufowobi and Nic Herndon
a
Department of Computer Science, East Carolina University, Greenville, U.S.A.
Keywords:
Pavement Distress Detection, Object Detection, Homography Estimation, Neural Networks.
Abstract:
Although advances in camera and sensing technology in the last decade helped propel the automation of pave-
ment distress detection and characterization, increased equipment acquisition and running costs limit access
to the most effective solutions. Furthermore, some of these advanced techniques require substantial human in-
volvement to process and analyze data correctly. We propose a cost-effective, end-to-end automated approach
to pavement condition assessment that employs a neural object detector to identify and measure instances
of pavement distress in real time from oblique two-dimensional imagery acquired using an unmanned aerial
vehicle. A state-of-the-art object detector architecture is applied to identify and localize pavement distress
instances in these images. Camera data, information about Street View image acquisition conditions, and the
principles of photogrammetry and planar homography are exploited to construct a mapping for translating
pixel distances to real-world distances. This capability is integrated into the neural network inference process
to derive an end-to-end system for real-time distress identification and measurement.
1 INTRODUCTION
Pavement condition assessment enables cost-effective
decision-making associated with road maintenance.
These assessments are usually performed using spe-
cialized tools. Although the past decade yielded im-
provements in sensing and camera technology that
propelled the automation of pavement distress detec-
tion and characterization, this also led to increased
costs from the acquisition and operation of advanced
equipment. To reduce pavement condition assess-
ment costs, we propose to leverage advances in im-
age processing, which enable the deployment of cost-
effective, computationally efficient resources in pave-
ment distress monitoring. We apply modern computer
vision techniques to the problem of detecting and
evaluating pavement distress from images taken us-
ing a camera mounted on an unmanned aerial vehicle
(UAV) flying at a low altitude. Our objective is to in-
vestigate the effectiveness of YOLOv5 (Jocher et al.,
2021), a state-of-the-art object detector, for pavement
distress detection. We train and validate this neural
network on a revised Pavement Image Dataset (PID)
(Majidifard et al., 2019). Furthermore, we estimate
the potential asphalt patch area directly from image
a
https://orcid.org/0000-0001-9712-148X
pixels using techniques from traditional computer vi-
sion, but with some constraints. The contributions of
this study include: A network for low-cost, real-time,
end-to-end pavement distress detection and measure-
ment based on YOLOv5, and an approach to spa-
tially evaluate pavement distress from oblique pave-
ment imagery in a rapid manner using planar homog-
raphy. Figure 1 shows the output of this end-to-end
system.
2 RELATED WORKS
2.1 Pavement Distress Detection
In (Zhang et al., 2016), CrackNet, a convolutional
neural network (CNN) trained using raw image
patches, was used to determine whether an image con-
tained a crack or not. Building on this, CrackNet-
R (Zhang et al., 2019) used a recurrent neural net-
work (RNN) to accurately detect small cracks while
removing noise. Our approach involves using an ob-
ject detection algorithm to optimize the search space.
We first extract discriminative features from an image
using a CNN. Then we generate regions of interest
within the image before finally detecting objects via
526
Olufowobi, K. and Herndon, N.
Towards a Low-cost Vision System for Real-time Pavement Condition Assessment.
DOI: 10.5220/0010785900003122
In Proceedings of the 11th International Conference on Pattern Recognition Applications and Methods (ICPRAM 2022), pages 526-533
ISBN: 978-989-758-549-4; ISSN: 2184-4313
Copyright
c
2022 by SCITEPRESS – Science and Technology Publications, Lda. All rights reserved
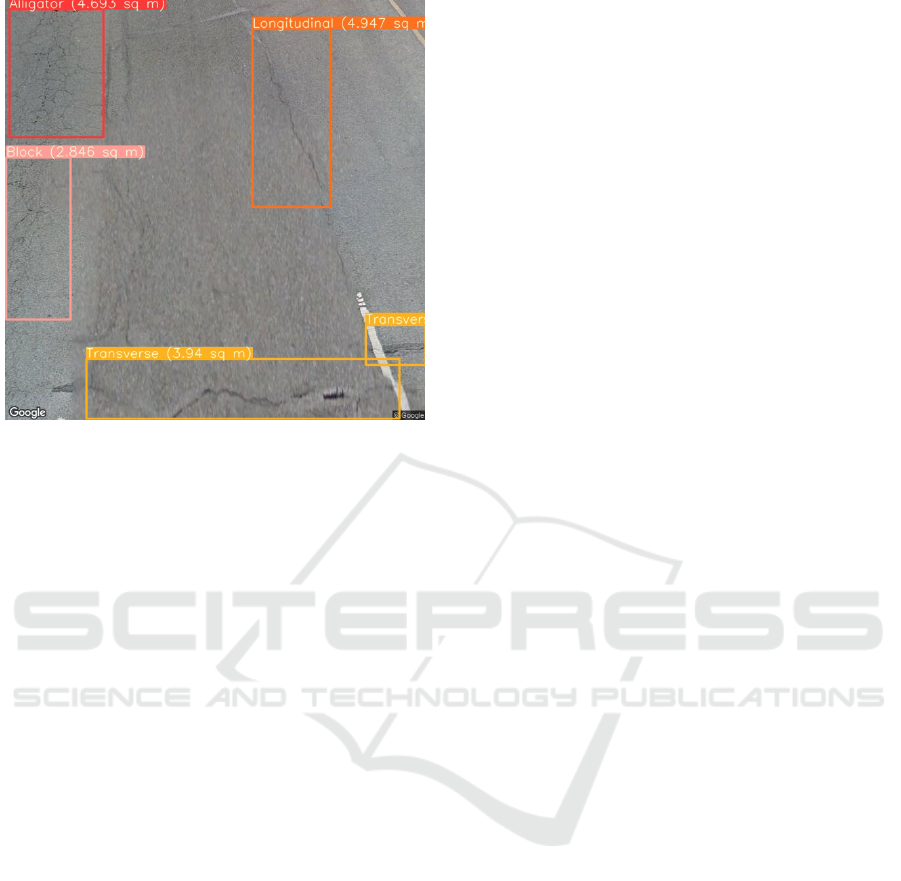
Figure 1: Real-time distress detection and measurement.
The bounding boxes identify individual pavement cracks in
the image and the measurements shown in square meters re-
flect the true physical dimensions of the enclosed regions.
The central idea is to employ Google Street View images as
a proxy for oblique pavement imagery acquired by flying a
UAV at a fixed low altitude over a road section. These im-
ages are then used to train a neural object detector with a
built-in homography estimator to measure detected cracks.
This facilitates a low-cost automated pavement condition
assessment.
bounding box coordinates.
In (Mandal et al., 2018) YOLOv2 (Redmon and
Farhadi, 2017) was proposed to perform pavement
crack detection in automated pavement distress anal-
ysis systems. YOLOv3 (Redmon and Farhadi, 2018)
was adopted in (Nie and Wang, 2019) to achieve im-
proved real-time performance and better detection ac-
curacy. Sarmiento (2021) describes the deployment of
YOLOv4 (Bochkovskiy et al., 2020) in a dual demon-
stration of the effectiveness of deep learning for both
distress detection and segmentation. The efficacy of
YOLOv5 for detecting concealed cracks in asphalt
pavement was recently demonstrated in (Li et al.,
2021). Our study exhibits the potential of YOLOv5.
We determine the optimal experiment configurations
and judge the model’s overall effectiveness for the
task of distress detection.
Fan et al. (2018) describes the deployment of
a CNN to learn pavement crack textures from raw
images by analyzing crack pixels within an image.
The problem was modeled as a multi-label classi-
fication problem. In (Jenkins et al., 2018), a U-
Net (Ronneberger et al., 2015) architecture was em-
ployed in implementing an encoder-decoder structure
for semantic segmentation of pavement images. Fur-
thermore, DeepCrack was proposed in (Zou et al.,
2019) as an end-to-end trainable network for auto-
matic crack detection and is based on the SegNet
(Badrinarayanan et al., 2017) encoder-decoder CNN
architecture.
The best-performing segmentation algorithms rely
on an encoder-decoder network architecture for which
a significant reduction in resolution due to downsam-
pling is undesirable. Since the vast majority of pave-
ment distress image pixels (more than 95%) are back-
ground (Jenkins et al., 2018), low-quality input im-
ages can easily degrade model performance. These
segmentation techniques also rely on planar view im-
ages for more accurate views of distresses as com-
pared to oblique or wide-view images. However, pla-
nar view images generally require a more sophisti-
cated camera and mounting equipment.
2.2 Pavement Distress Characterization
In (Tan and Li, 2019) an algorithm was developed to
extract the geometric features of pavement distress
after they are automatically detected from road 3D
models constructed from UAV oblique photogramme-
try. Sarsam et al. (2015) describes the implementation
of CRP for evaluating pavement surface distresses to
validate the equivalency of the technique with visual
evaluation. The results of both the photogrammet-
ric and visual techniques were modeled and the pho-
togrammetric approach was found to be highly effi-
cient with a Coefficient of Determination value be-
tween 0.985 and 0.999 compared to the traditional ap-
proach.
Structure-from-motion (SfM) (Ozyesil et al.,
2017) techniques were used for pavement distress
analysis in (Inzerillo et al., 2018). Imagery acquired
using cameras at head level and higher altitudes were
analyzed to determine metric information about size,
shape, and position within the images. In (Zhang and
Elaksher, 2012) 3D reconstruction and measurement
of surface distresses on unpaved roads was performed
on UAV-acquired imagery. The acquired imagery was
subjected to photogrammetric orientation, resulting in
precise orientation parameters.
In general, the analyses furnished by the preced-
ing proposals rely on a combination of advanced and
manual imaging and 3D reconstruction techniques to
address questions regarding varied aspects of pave-
ment health. Most of these techniques were imple-
mented using commercial software. Our analysis fo-
cuses on the spatial quantification of the degree of
damage via crack size measurement, to inform asphalt
patch requirements for the repair and maintenance of
a road section. Our proposal enables the aggregation
Towards a Low-cost Vision System for Real-time Pavement Condition Assessment
527
of such patch requirements across a long stretch of
road pavement and thus supports large-scale distress
analysis via straightforward and relatively inexpen-
sive means.
3 METHODS
3.1 Dataset
Our pavement assessment model is defined on 2D
Street View data. The images are used to replicate the
outcome of flying a drone with an onboard camera at
a low altitude to collect oblique pavement imagery.
On the one hand, this warrants that certain orientation
parameters be constrained – altitude, pitch, and field
of view (FOV) have to be predetermined and fixed for
the duration of the flight. On the other hand, Street
View images offer the desirable advantages of ease of
acquisition and scale.
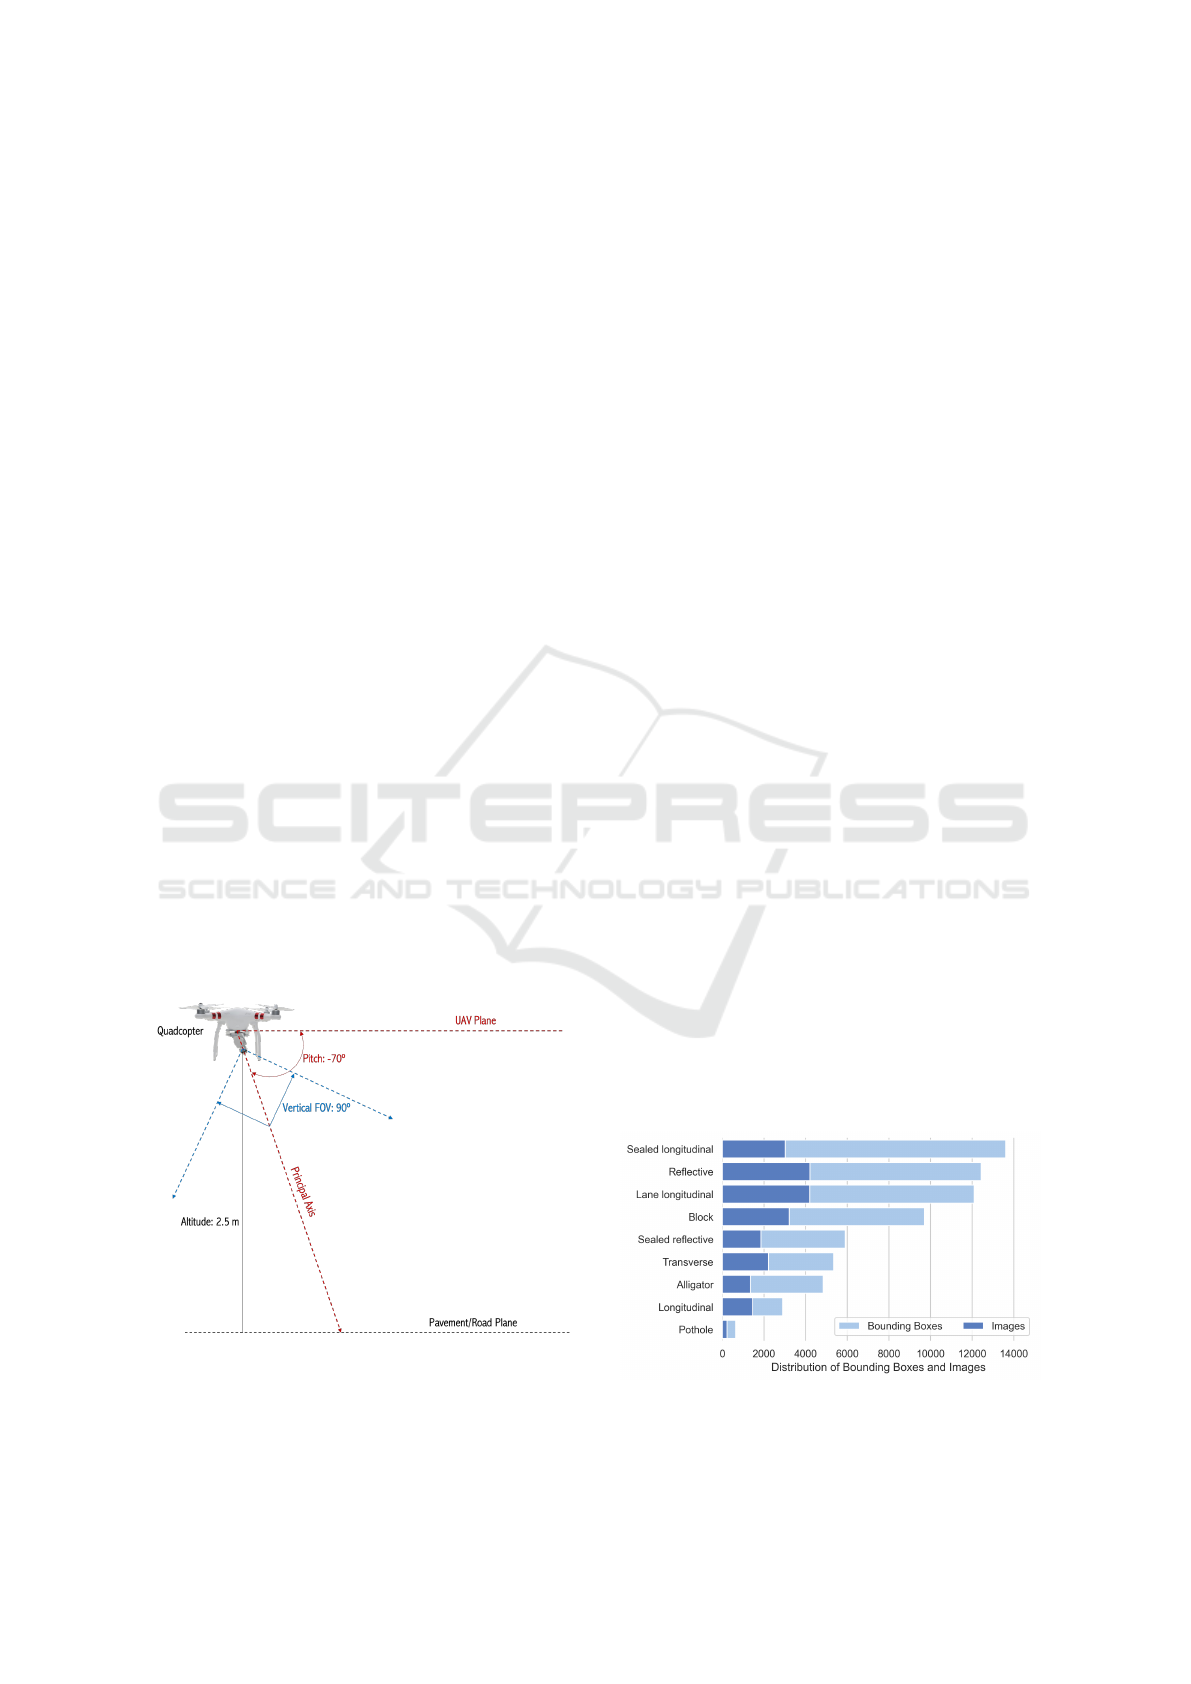
It is assumed that these orientation constraints can
be easily replicated for an arbitrary flight. In partic-
ular, to successfully implement our proposal, during
image acquisition, a UAV should maintain an altitude
of 2.5 m, an onboard camera pitch of -70
◦
, and target
FOV should be 90
◦
, as shown in Figure 2. The camera
heading should align with an axis parallel to any pave-
ment centerline markings, and the axes of rotation are
to be kept constant. This guideline is informed by the
camera and image parameters specified in the Street
View Street API calls used to extract the images.
The primary dataset for our analysis is PID, a
manually-annotated collection of 7,237 640×640 im-
Figure 2: Prescribed orientation parameters. Note that ver-
tical FOV (v) is shown in this 2D diagram instead of hor-
izontal FOV (h). Both values are equivalent when deal-
ing with a 1:1 aspect ratio, as is our case. Note that
h = arctan(aspect ratio ∗ tan(v)) = arctan(tan(v)) = v.
ages of 22 different pavement sections that include
both interstate and US highways (Majidifard et al.,
2019). PID is designed to support simultaneous pave-
ment distress detection and density quantification us-
ing various camera views. The images were extracted
using Street View Static APIs by specifying GPS co-
ordinates and camera and image parameters. For each
pavement section, the images were collected at 15-
meter intervals within predetermined start and end-
points.
Since the dataset was created for both distress
classification and density determination, two different
views were collected at each coordinate point: pla-
nar view images taken at a pitch of -90
◦
and wide-
view images taken at -70
◦
. The wide-view images
were manually annotated by professionals for nine
distinct distress categories. These categories had been
determined as the most critical distresses that affect
pavement condition. The distribution of images and
bounding boxes across classes is shown in Figure 3.
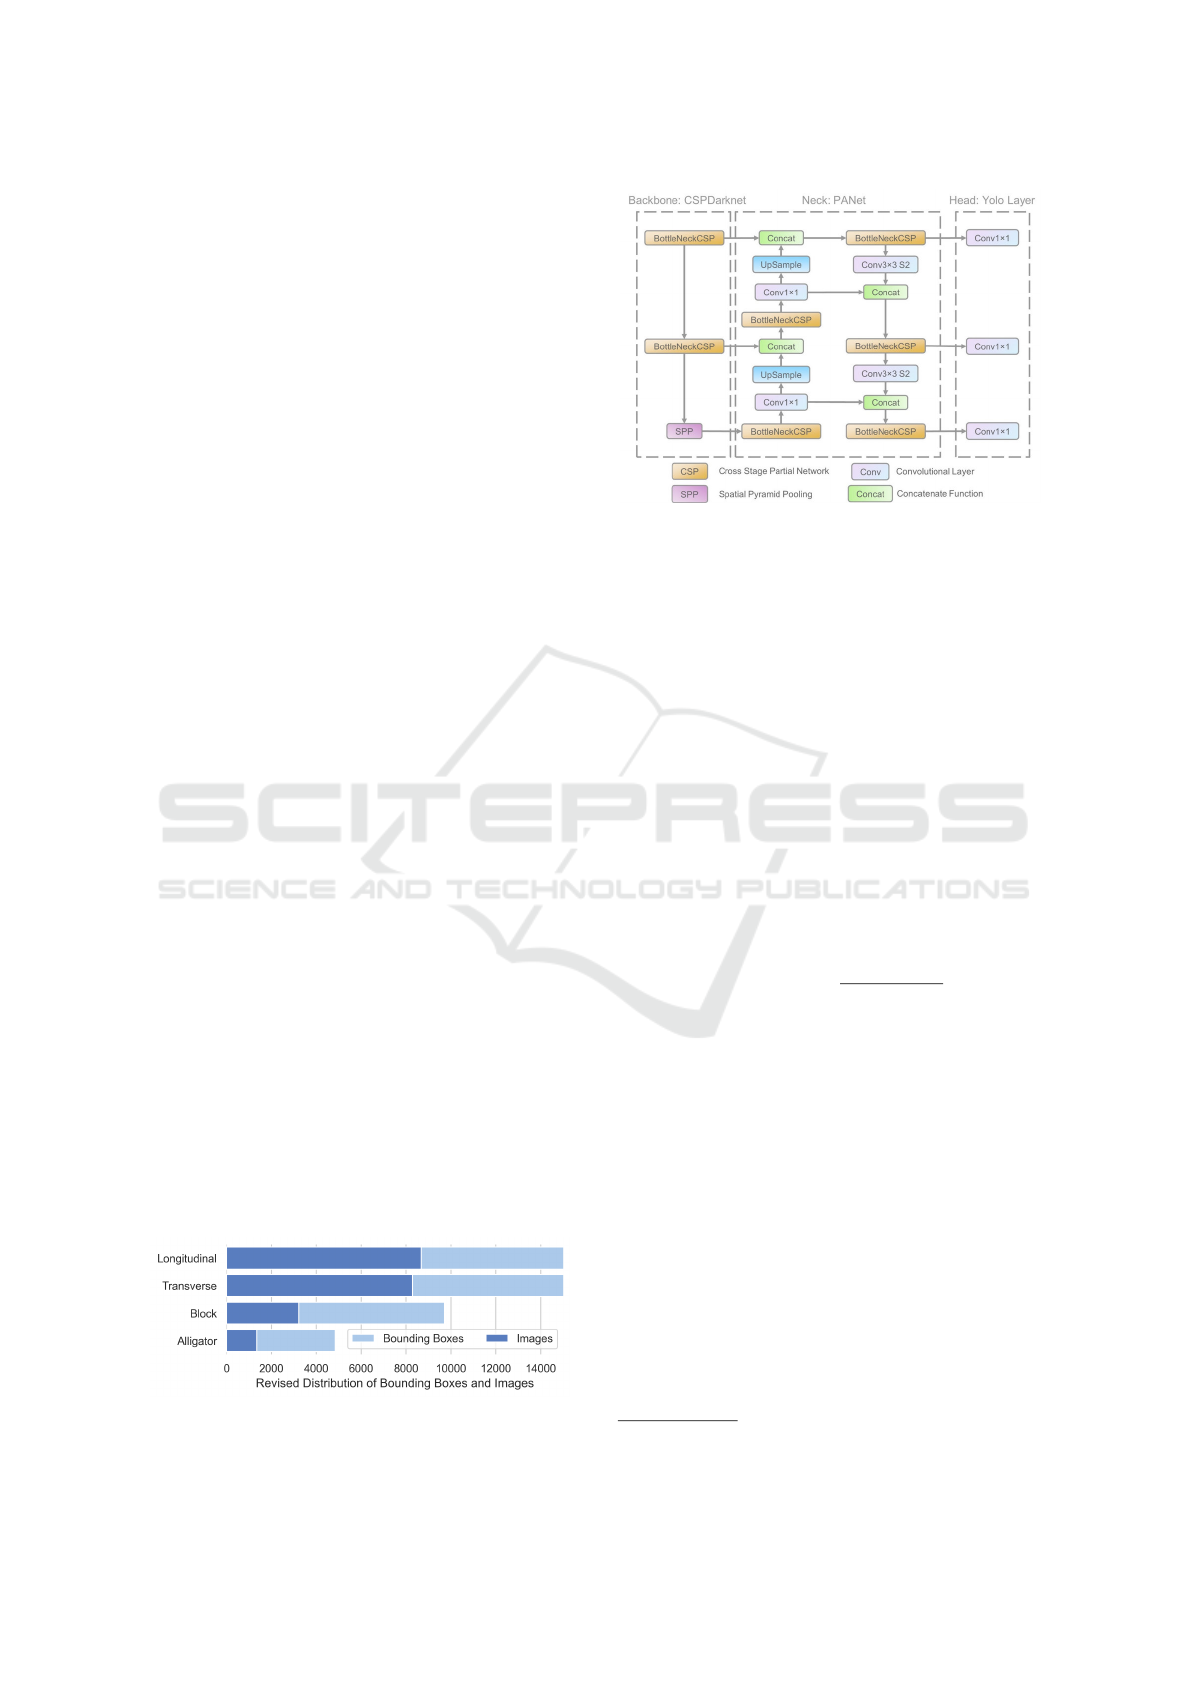
To enable faster model training and inference,
variants of the same distress type were collapsed into
a single category, effectively reducing the total num-
ber of classes to be predicted from nine to four. Given
the sparsity of potholes across the entire dataset, we
were able to exclude this category from the scope of
our distress detection problem without compromising
the quality of the solution. The revised numeric dis-
tribution of the dataset is shown in Figure 4.
3.2 YOLOv5
YOLOv5 is a state-of-the-art, single-stage, real-time
object detector and one of the latest models in the evo-
lution of the YOLO algorithm. In general, YOLO
models are compact but highly performant, and this
makes them ideal candidates for real-time conditions
and on-device deployment environments.
Figure 5 shows the network architecture of
YOLOv5. The first major component is a CNN back-
Figure 3: Sorted PID numeric distribution with overlapping
horizontal bars to show comparison between the number of
bounding boxes and images per class.
ICPRAM 2022 - 11th International Conference on Pattern Recognition Applications and Methods
528
bone for extracting image convolutional features at
different granularities from the input RGB image. For
its backbone, YOLOv5 incorporates Cross Stage Par-
tial Network (CSPNet) (Wang et al., 2020) into Dark-
net to create CSPDarknet.
The second major component is a series of lay-
ers for aggregating the image features called the neck.
The detection neck employed to boost information
flow in YOLOv5 is PANet (Wang et al., 2019), a path
aggregation network that adopts the Feature Pyramid
Network (FPN) (Lin et al., 2017) structure to improve
low-level feature propagation.
The third major YOLOv5 component is the pre-
diction head which consumes features from the neck
to make bounding box and class predictions. This is
the final layer in the network. To achieve multiscale
prediction, three feature maps of different sizes are
generated. This allows the model to handle variations
in object sizes.
3.3 Homography Estimation
If we use homogeneous coordinates to express the
point
~
P on an object plane and the corresponding
point ~p on an image plane, then the homography or
projective mapping can be expressed as:
~p = s · H ·
~
P (1)
where s is an arbitrary scale factor.
We use this result to compute the homography ma-
trix for mapping the road plane – and, by extension,
the pavement distress plane – onto the image plane in
our pavement distress measurement task. To calibrate
H we use correspondences between multiple points
on pavement distress images and control points in the
real world scene. This setup allows us to establish the
rotation and translation associated with the perspec-
tive projection.
Figure 6 illustrates this projective mapping be-
tween a 640×640 image and a quadrilateral depicting
the scope of the object plane of interest – that is, the
pavement view captured in the image. Ground dis-
tance measurements obtained using a reference im-
age show that |A
0
B
0
| = 9.85 m, |A
0
D
0
| = |B
0
C
0
| = 8.35
m, and |C
0
D
0
| = 4.25 m. Thus, the eight vertices
Figure 4: Numeric distribution of image dataset after revi-
sion.
Figure 5: Architecture of YOLOv5 from (Xu et al., 2021).
Features are extracted using CSPDarknet and fused using
PANet. The CSP Bottleneck is used to efficiently formu-
late image features. The prediction head generates 18×18,
36×36, and 72×72 feature maps and outputs the detection
results. Source: shorturl.at/cdhAW (licensed under CC BY
4.0).
(four for each plane) used to estimate homography H
are: A(0,0), B(639,0) , C(639, 639), D(0, 639), and
A
0
(0,8.35), B
0
(9.85,8.35), C
0
(7.05,0), D
0
(2.8,0).
Note that A, B, C, D are pixel coordinates while A
0
,
B
0
, C
0
, D
0
correspond to metric coordinates. The cam-
era orientation constraints we have defined allow us to
estimate the image-plane-to-road-plane relation using
only homography – that is, without the need for ad-
ditional metadata or complex camera calibration. To
estimate the true size of abcd in the real world, we
simply compute the area of trapezoid a
0
b
0
c
0
d
0
. This is
given by:
Area of a
0
b
0
c
0
d
0
=
|a
0
b
0
| + |c
0
d
0
|
2
∗ h (2)
where h is the height of the trapezoid, equal to the
perpendicular distance from |a
0
b
0
| to |c
0
d
0
|.
3.4 Experimental Design
Our experiment was conducted using tools available
from the Utralytics GitHub repository
1
. We split the
modified dataset into training and validation sets as
follows: 5,426 training images and a validation set
of 1,811 images, or a 75-25 split, and 6,006 training
images and a validation set of 1,231 images, or an 83-
17 split.
We trained the four YOLOv5 models on the orig-
inal and revised versions of our dataset from scratch.
Training loss in YOLOv5 is a composition of box
loss, object loss, and classification loss. The combina-
tion of these losses helps maximize the mAP metric.
1
https://github.com/ultralytics/yolov5.
Towards a Low-cost Vision System for Real-time Pavement Condition Assessment
529
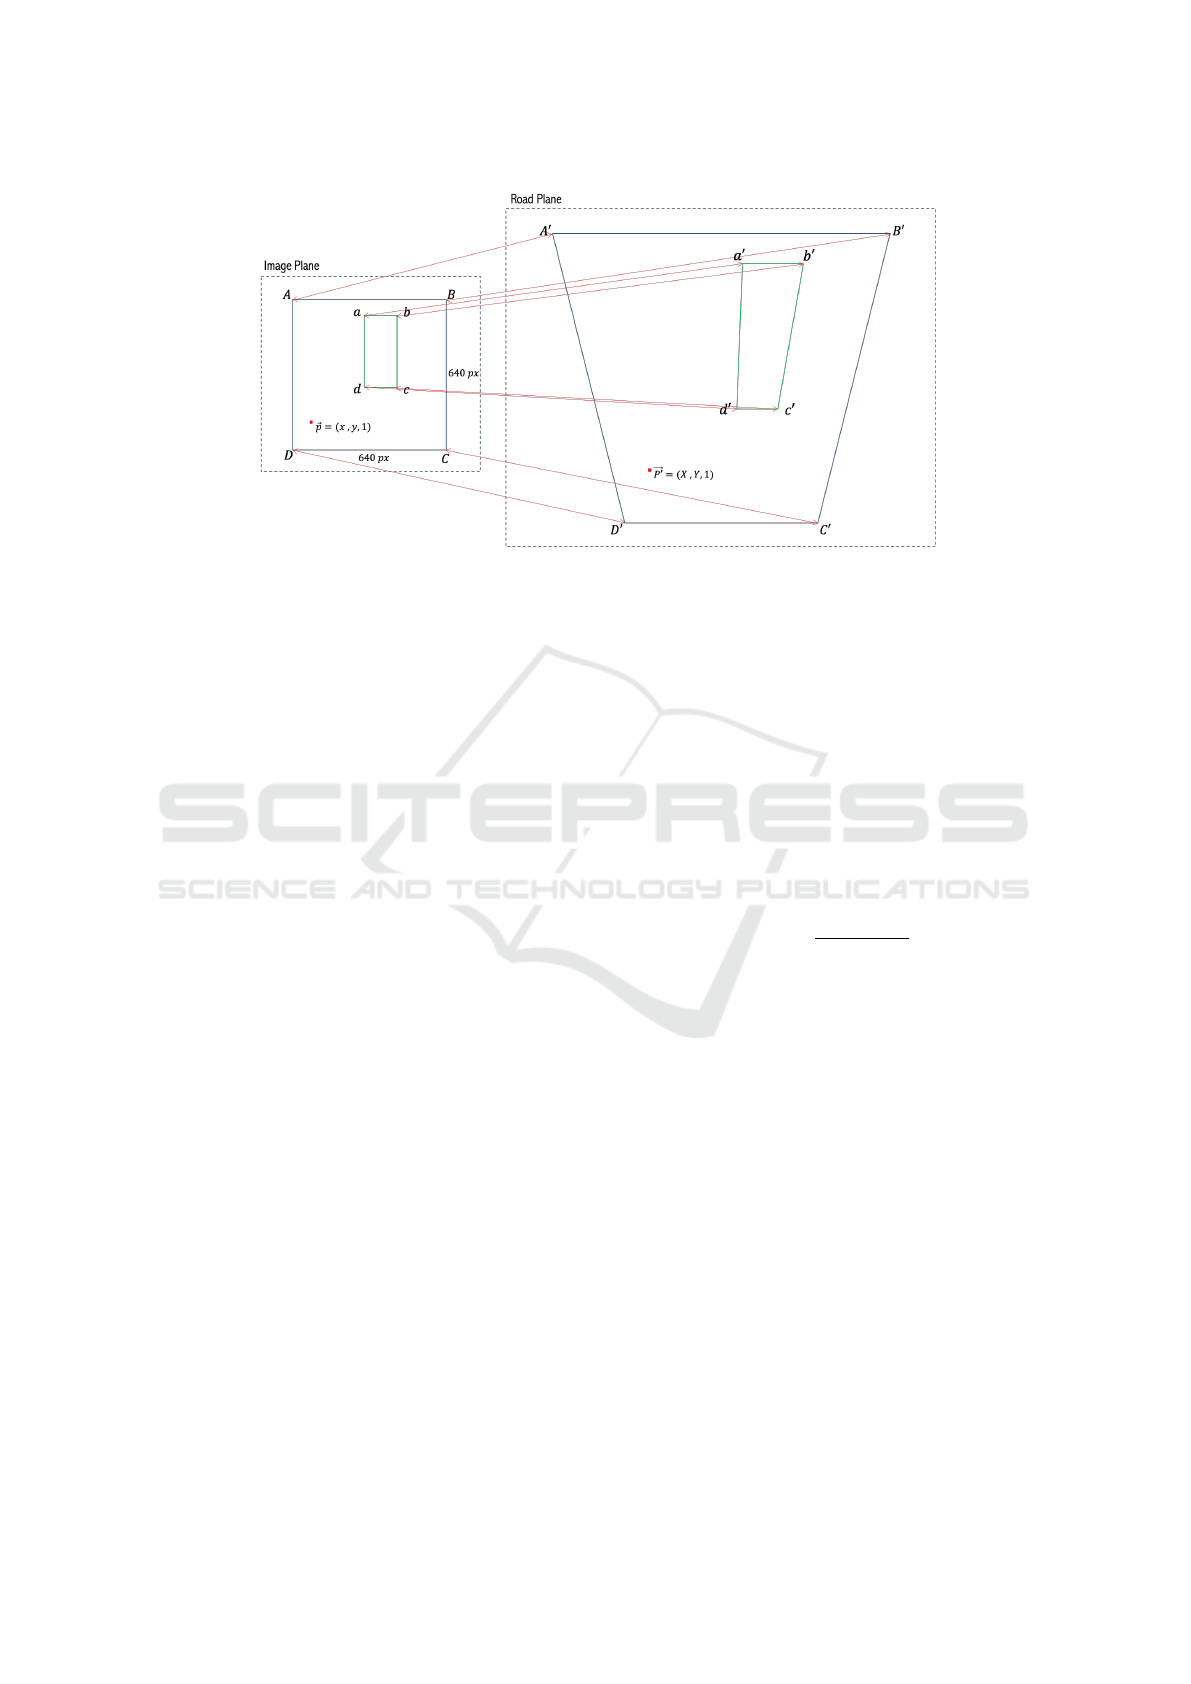
Figure 6: View of bounding box abcd around a pavement distress as described by the perspective mapping between the road
plane and image planes. The true geometry of the planar view captured in image ABCD is reflected in trapezoid A
0
B
0
C
0
D
0
. Pla-
nar homography enables simultaneous comprehension of the location of both planes and effectively maps ABCD to A
0
B
0
C
0
D
0
,
thereby transforming abcd to a
0
b
0
c
0
d
0
. This task can be interpreted as artificially correcting for linear perspective in an image.
Input size was fixed but we varied batch size, epochs,
optimizer, and batch normalization across the many
training experiments performed. The weight optimiz-
ers used were Stochastic gradient descent (SGD) and
Adam.
We compared the results obtained by training four
YOLOv5 models (small, medium, large, extra-large)
using batch sizes proportionate to the model sizes.
This allowed us to determine the most effective mod-
els for our dataset: the large and extra-large. We
focused on these two models and iterated through
more than twenty experiment configurations by vary-
ing batch size, dataset version and split, optimizer se-
lection, and training time.
We also observed the effect of fine-tuning a pre-
trained model, batch normalization, and a combina-
tion of batch normalization and multi-GPU training.
Table 1 shows the experiment configurations adopted
in the tuning process. To realize a truly end-to-end
system, we integrated the distress measurement task
into the detection network’s inference process. The
code that estimates and applies the homography ma-
trix that maps the view in an image to its real-world
geometry is integrated into the YOLOv5 detection
pipeline.
Not only does our implementation enable real-
time detection of pavement distress, but the actual
area in square meters of the imaginary bounding box
enclosing each physical distress instance is also dis-
played as additional information alongside the bound-
ing box. Example outputs are shown in Figure 7. In-
put sources may be an image, video, or live video
stream.
4 EVALUATION
4.1 Training Metrics
The mAP, precision, recall, and F1 Score were em-
ployed in evaluating the performance of the trained
models on the validation set. The mAP was the pri-
mary index used to measure YOLOv5’s overall detec-
tion effectiveness per experiment configuration. It is
defined as:
mAP =
∑
C
i=1
AP(c
i
)
C
(3)
where C is the number of categories in the decision
space and AP(c
i
) is the average precision (AP) for a
given category, c
i
. AP is defined as the area under the
precision vs. recall curve (PR Curve), where preci-
sion is the fraction of predictions that are correct and
recall is the fraction of the ground truth that the model
correctly predicts.
We evaluated each trained model on the validation
set using different IoU thresholds, via the mAP@0.5
and mAP@[.5, .95] metrics. IoU is a similarity metric
obtained by dividing the area of overlap or intersec-
tion between the predicted and ground truth boxes by
the area of their union. By definition, this is a value
between 0 and 1 that represents the quality of overlap
between the two boxes. The F1 Score measures the
balance achieved between precision and recall. Fig-
ure 8 shows the F1 Score and PR Curve plots for Ex-
periment 1.
ICPRAM 2022 - 11th International Conference on Pattern Recognition Applications and Methods
530

Table 1: Training experiment configurations. The result for Experiment 0 was obtained using hyperparameter values derived
from running a genetic algorithm for 90 generations, with Experiment 1 as the base scenario. The 83-17 dataset split was used
for Experiments 0, 1 and 2; all other runs were based on the 75-25 split. The top four mAP values are shown in bold font.
ID Model Batch Size Epochs Optimizer GPU Hours mAP@0.5 Classes Other
0 YOLOv5l 48 150 SGD 16.9 0.4657 4 –
1 YOLOv5l 48 150 SGD 16.9 0.4555 4 –
2 YOLOv5l 24 150 SGD 18.8 0.4459 4 –
3 YOLOv5l 48 150 SGD 9.5 0.4039 4 –
4 YOLOv5l 48 100 SGD 11.8 0.3984 4 Batch Normalization
5 YOLOv5x 72 200 SGD 18.6 0.3969 4 –
6 YOLOv5l 24 150 SGD 16.8 0.3948 4 –
7 YOLOv5l 48 100 SGD 11.8 0.3712 5 –
8 YOLOv5x 72 1000 Adam 93.6 0.3604 4 –
9 YOLOv5l 48 200 Adam 24.2 0.3545 4 Batch Normalization
10 YOLOv5l 48 500 Adam 33.1 0.3510 4 –
11 YOLOv5l 48 200 Adam 24.2 0.3501 4 –
12 YOLOv5l 48 100 SGD 11.6 0.3497 5 Pretrained
13 YOLOv5l 48 100 Adam 12.0 0.2988 5 –
14 YOLOv5l 48 200 SGD 16.7 0.2929 9 Batch Normalization
15 YOLOv5l 48 200 SGD 18.7 0.2919 9 –
16 YOLOv5x 72 500 SGD 47.4 0.2888 9 –
17 YOLOv5l 72 200 SGD 12.5 0.2861 9 Batch Normalization
18 YOLOv5l 72 500 SGD 30.9 0.2839 9 –
19 YOLOv5l 48 100 Adam 12.2 0.2822 5 Pretrained
20 YOLOv5m 16 100 SGD 9.7 0.2790 9 –
21 YOLOv5l 16 425 SGD 40.3 0.2777 9 –
22 YOLOv5x 12 200 SGD 59.6 0.2733 9 Batch Normalization
23 YOLOv5x 8 150 SGD 19.5 0.2710 9 Batch Norm + Parallelization
24 YOLOv5l 36 200 SGD 14.3 0.2687 9 –
25 YOLOv5m 8 50 SGD 10.9 0.2647 9 –
26 YOLOv5s 8 75 SGD 13.4 0.2562 9 –
27 YOLOv5x 4 200 SGD 67.1 0.2561 9 Batch Norm + Parallelization
28 YOLOv5s 16 75 SGD 10.3 0.2489 9 –
29 YOLOv5x 24 200 SGD 19.9 0.2396 9 Batch Norm + Parallelization
4.2 Discussion
Overall results show that the larger models are
more favorable for our problem context compared to
smaller models. For the same models, SGD achieved
better results compared to Adam optimizer. However,
we cannot assert that training the same models using
Adam optimizer will not eventually lead to better per-
formance if the training time is long enough.
Models trained on the refined dataset generally
performed better. The only exceptions were models
trained using Adam optimizer, which did not show
any performance improvements within a reasonable
amount of time. Also, fine-tuning a model pre-trained
on a previous dataset version was found to result in
worse performance than when the model was trained
from scratch on the refined dataset.
The model appears to be more robust in detecting
block cracks compared to other categories, although
both transverse and longitudinal cracks are better rep-
resented in the dataset. This is explained by the high
intra-class variability associated with both the trans-
verse and longitudinal cracks (due to dataset revi-
sion), as compared with the other two categories. On
the contrary, the block crack class lends itself to low
intra-class variability and relatively balanced repre-
sentation, which the model is more amenable to. This
is not the case with the alligator crack class which has
both low representation and more complex features.
The lack of background images (images with no
cracks) in the dataset led to increased background
False Positives and False Negatives, the effect of
which impacted the model’s ability to predict classes
with complex features and low representation in the
dataset accurately enough.
4.3 Limitations
Our model suffers from a low-quality dataset and in-
sufficient dataset size and scope. PID and the revised
versions we derived from it do not sufficiently address
the expectation of context variation. For example,
homogeneous highway scenery typifies the views in
the training images, whereas the images we used dur-
ing inference included views characterized by slightly
more municipal scenes. This limits the model’s gen-
Towards a Low-cost Vision System for Real-time Pavement Condition Assessment
531
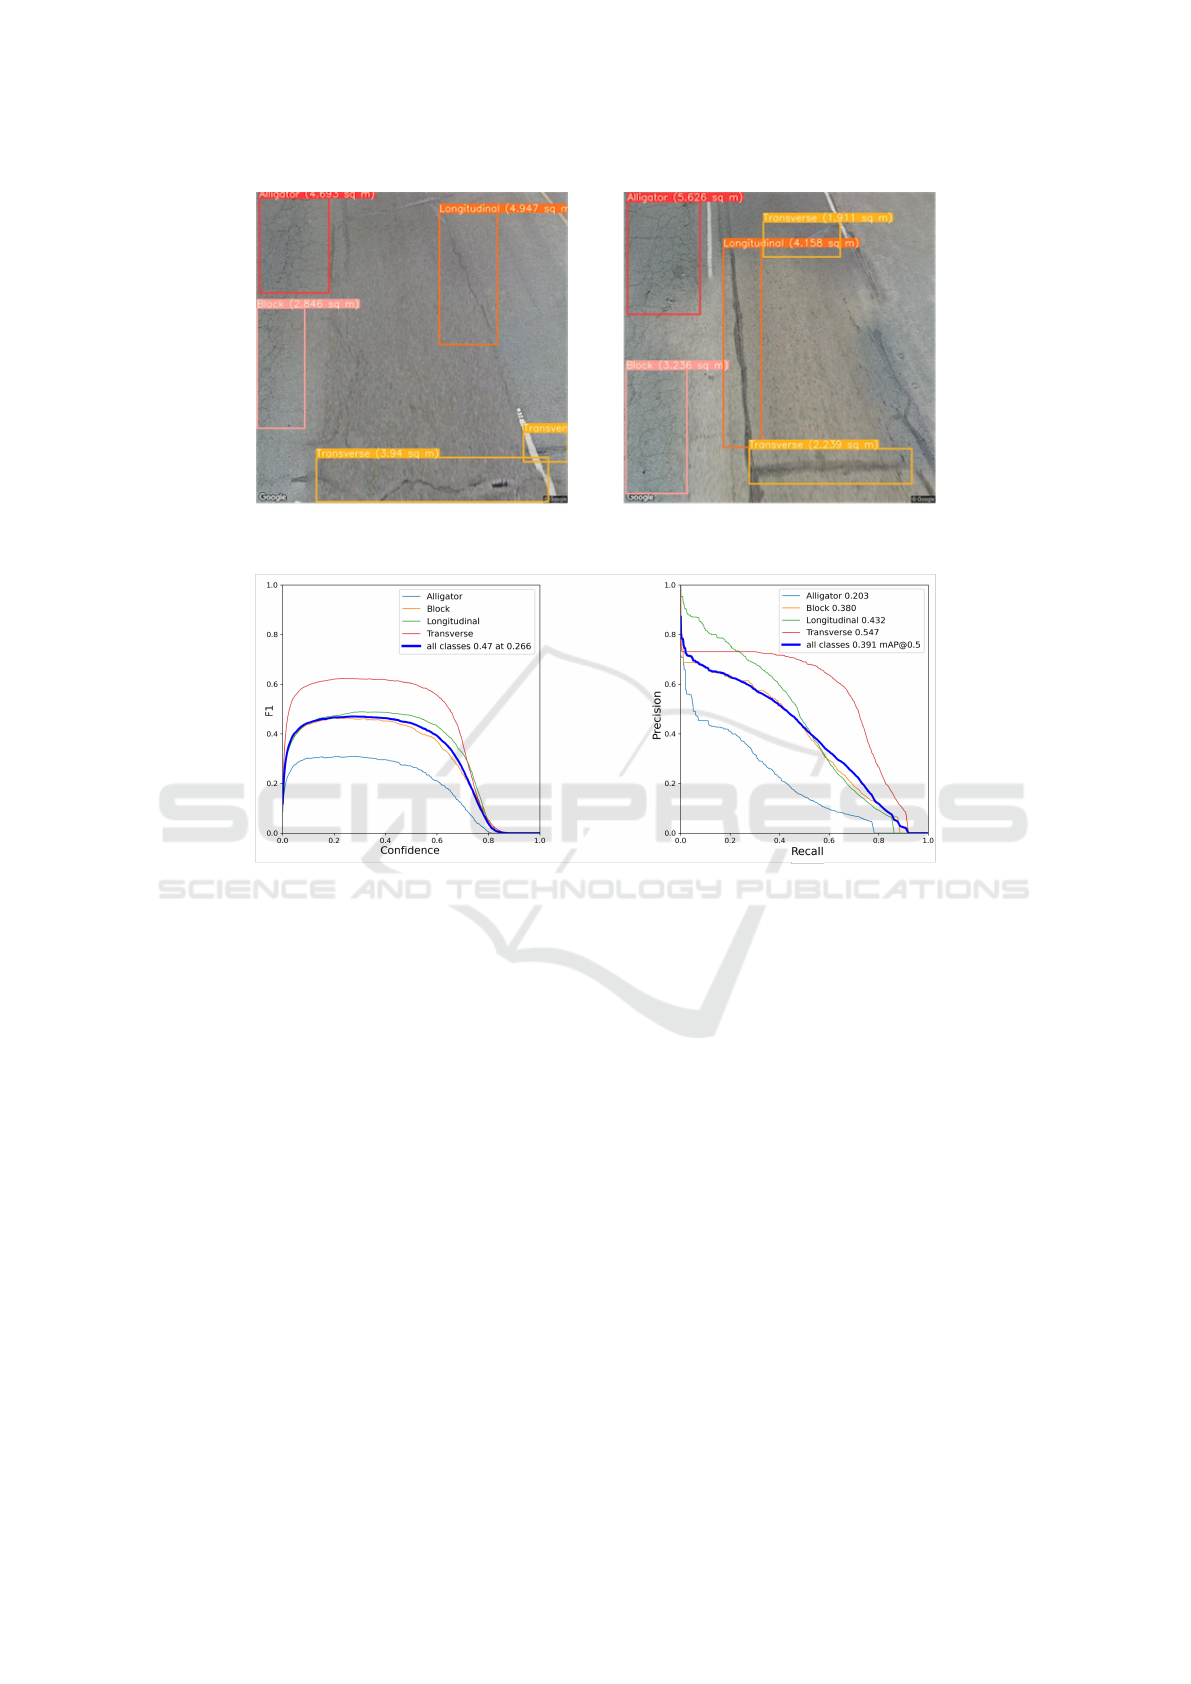
Figure 7: Example model outputs showing the real-world measurements for distress regions in square meters. Pavement
images were obtained from Google Street View panorama using a pitch of -70
◦
and FOV of 90
◦
.
Figure 8: F1 Score (left) and the Precision-Recall Curve (right) for Experiment 1. The maximum overall (blue curve) F1
value of 0.47 was achieved when prediction confidence was 0.27. The mAP@0.5 score for the validation set is the area under
the blue PR Curve.
eralization ability as it is not able to correctly classify
street sidewalks as background.
To effectively estimate the size of a pavement
crack, we have relied on the assumption that image
acquisition would always be conducted under the con-
ditions of -70
◦
pitch, FOV of 90
◦
, and a camera height
of 2.5 m. However, this may not be the case in prac-
tice as drone footage may have been acquired using
the most convenient orientation conditions, depend-
ing on the nature of the permit secured and the road
situation at the point of conducting the exercise. This
limits the kind of pavement distress imagery we can
successfully apply our solution to.
5 CONCLUSIONS
This work proposes a cost-effective method for pave-
ment condition assessment that employs UAVs to ac-
quire road pavement imagery, and an object detector
to detect and measure instances of pavement distress
in oblique images. Although we proposed adopting
UAVs to acquire these images, we suggested an al-
ternative that enables the cost-effective collection of
data associated with initial modeling tasks. We pro-
posed the use of Google Street View images to serve
as a proxy for data collected using a UAV-mounted
camera. In line with this, we also introduced several
constraints that are required for the successful imple-
mentation of such a proposal.
Our proposal represents a preliminary effort in the
application of machine learning to automate costly or
challenging human-dependent processes. This work
can thus be extended by adapting the architecture of
YOLOv5 to the pavement distress data distribution to
create a robust network tailored for distress detection
in images acquired under unconstrained conditions.
ICPRAM 2022 - 11th International Conference on Pattern Recognition Applications and Methods
532

REFERENCES
Badrinarayanan, V., Kendall, A., and Cipolla, R. (2017).
SegNet: A Deep Convolutional Encoder-Decoder Ar-
chitecture for Image Segmentation. IEEE Transac-
tions on Pattern Analysis and Machine Intelligence,
39:2481–2495.
Bochkovskiy, A., Wang, C.-Y., and Liao, H. (2020).
YOLOv4: Optimal Speed and Accuracy of Object De-
tection. ArXiv, abs/2004.10934.
Fan, Z., Wu, Y., Lu, J., and Li, W. (2018). Automatic Pave-
ment Crack Detection Based on Structured Predic-
tion with the Convolutional Neural Network. ArXiv,
abs/1802.02208.
Inzerillo, L., Di Mino, G., and Roberts, R. (2018). Image-
based 3D reconstruction using traditional and UAV
datasets for analysis of road pavement distress. Au-
tomation in Construction, 96:457–469.
Jenkins, M., Carr, T. A., Iglesias, M. I., Buggy, T., and
Morison, G. (2018). A Deep Convolutional Neu-
ral Network for Semantic Pixel-Wise Segmentation
of Road and Pavement Surface Cracks. 2018 26th
European Signal Processing Conference (EUSIPCO),
pages 2120–2124.
Jocher, G., Stoken, A., Borovec, J., NanoCode012, Chaura-
sia, A., TaoXie, Changyu, L., V, A., Laughing,
tkianai, yxNONG, Hogan, A., lorenzomammana,
AlexWang1900, Hajek, J., Diaconu, L., Marc, Kwon,
Y., oleg, wanghaoyang0106, Defretin, Y., Lohia, A.,
ml5ah, Milanko, B., Fineran, B., Khromov, D., Yiwei,
D., Doug, Durgesh, and Ingham, F. (2021). ultralyt-
ics/yolov5: v5.0 - YOLOv5-P6 1280 models, AWS,
Supervise.ly and YouTube integrations.
Li, S., Gu, X., Xu, X., Xu, D., Zhang, T., Liu, Z., and
Dong, Q. (2021). Detection of concealed cracks from
ground penetrating radar images based on deep learn-
ing algorithm. Construction and Building Materials,
273:121949.
Lin, T.-Y., Doll
´
ar, P., Girshick, R., He, K., Hariharan, B.,
and Belongie, S. (2017). Feature pyramid networks
for object detection. In Proceedings of the IEEE Con-
ference on Computer Vision and Pattern Recognition,
pages 2117–2125.
Majidifard, H., Jin, P., Adu-Gyamfi, Y., and Buttlar, W.
(2019). Pavement Image Datasets: A New Benchmark
Dataset to Classify and Densify Pavement Distresses.
Transportation Research Record, 2674:328–339.
Mandal, V., Uong, L., and Adu-Gyamfi, Y. (2018). Au-
tomated Road Crack Detection Using Deep Convo-
lutional Neural Networks. 2018 IEEE International
Conference on Big Data (Big Data), pages 5212–
5215.
Nie, M. and Wang, C. (2019). Pavement Crack Detection
based on YOLO v3. 2019 2nd International Con-
ference on Safety Produce Informatization (IICSPI),
pages 327–330.
Ozyesil, O., Voroninski, V., Basri, R., and Singer, A.
(2017). A survey of structure from motion. arXiv
preprint arXiv:1701.08493.
Redmon, J. and Farhadi, A. (2017). YOLO9000: Better,
Faster, Stronger. 2017 IEEE Conference on Computer
Vision and Pattern Recognition (CVPR), pages 6517–
6525.
Redmon, J. and Farhadi, A. (2018). YOLOv3: An Incre-
mental Improvement. ArXiv, abs/1804.02767.
Ronneberger, O., Fischer, P., and Brox, T. (2015). U-Net:
Convolutional Networks for Biomedical Image Seg-
mentation. ArXiv, abs/1505.04597.
Sarmiento, J. (2021). Pavement Distress Detection and Seg-
mentation using YOLOv4 and DeepLabv3 on Pave-
ments in the Philippines. ArXiv, abs/2103.06467.
Sarsam, S. I., Daham, A. M., and Ali, A. M. (2015). Imple-
mentation of Close Range Photogrammetry to Eval-
uate Distresses at Asphalt Pavement Surface. Inter-
national Journal of Transportation Engineering and
Traffic System, 1(1):1–14.
Tan, Y. and Li, Y. (2019). UAV Photogrammetry-Based 3D
Road Distress Detection. ISPRS Int. J. Geo Inf., 8:409.
Wang, C.-Y., Liao, H.-Y. M., Wu, Y.-H., Chen, P.-Y.,
Hsieh, J.-W., and Yeh, I.-H. (2020). CSPNet: A
new backbone that can enhance learning capability of
CNN. In Proceedings of the IEEE/CVF Conference on
Computer Vision and Pattern Recognition Workshops,
pages 390–391.
Wang, K., Liew, J. H., Zou, Y., Zhou, D., and Feng, J.
(2019). Panet: Few-shot image semantic segmenta-
tion with prototype alignment. In Proceedings of the
IEEE/CVF International Conference on Computer Vi-
sion, pages 9197–9206.
Xu, R., Lin, H., Lu, K., Cao, L., and Liu, Y. (2021). A For-
est Fire Detection System Based on Ensemble Learn-
ing. Forests, 12(2):217.
Zhang, A., Wang, K., Fei, Y., Liu, Y., Chen, C., Yang,
G., Li, J., Yang, E., and Qiu, S. (2019). Automated
Pixel-Level Pavement Crack Detection on 3D Asphalt
Surfaces with a Recurrent Neural Network. Comput.
Aided Civ. Infrastructure Eng., 34:213–229.
Zhang, C. and Elaksher, A. (2012). An Unmanned Aerial
Vehicle-Based Imaging System for 3D Measurement
of Unpaved Road Surface Distresses. Comput. Aided
Civ. Infrastructure Eng., 27:118–129.
Zhang, L., Yang, F., Zhang, Y., and Zhu, Y. (2016). Road
crack detection using deep convolutional neural net-
work. 2016 IEEE International Conference on Image
Processing (ICIP), pages 3708–3712.
Zou, Q., Zhang, Z., Li, Q., Qi, X., Wang, Q., and Wang,
S. (2019). DeepCrack: Learning Hierarchical Convo-
lutional Features for Crack Detection. IEEE Transac-
tions on Image Processing, 28:1498–1512.
Towards a Low-cost Vision System for Real-time Pavement Condition Assessment
533
