
Comparing Closed-loop Control of Drug Infusion using MPC and PID
Tiro Setati
1
, Willem Jacobus Perold
2
, Pieter Rousseau Fourie
3
and Daniel Withey
4
1
Council for Scientific and Industrial Research (CSIR), Pretoria, South Africa
2
Department of Electrical and Electronic Engineering, University of Stellenbosch, Stellenbosch, South Africa
3
innovation4life Intellectual Property (Pty) Ltd., Stellenbosch, South Africa
4
Council for Scientific and Industrial Research (CSIR) Pretoria, South Africa
Keywords:
Control Systems, Model-Predictive Controller (MPC), Proportional-Integral-Derivative (PID) Controller,
Anesthesia, Intravenous Infusion.
Abstract:
Continuous intravenous drug delivery can require careful dosage and the maintenance of consistent blood
plasma concentration levels. Here, the closed-loop control of drug concentration in simulated patients’ blood-
streams was investigated. During the investigation, the closed-loop controller performance of a Proportional-
Integral-Derivative (PID) and a Model Predictive Controller (MPC) were compared. From the simulation
results, the MPC has shown to be a better controller because of its shorter settling time and smaller step-
response overshoot, which are desirable in a clinical setting. However, the MPC has shown to be more
resource-intensive on the controller system. Through the simulations conducted, it can therefore be con-
cluded that a closed-loop controller containing an MPC control block adequately controls the drug infusion to
a simulated patient.
1 INTRODUCTION
The function of human blood is to transport oxygen,
nutrients, sugars and hormones to parts of the hu-
man body that need them the most, and to carry away
waste materials (Felman, 2020). Blood is also used to
carry drugs for medical purposes, some of which re-
quire continuous drug supply and careful monitoring
of blood concentration levels. Methods for analyzing
blood using electrochemical sensors, and also by non-
invasive sensing, exist and are the subject of ongoing
research (Shokrekhodaei and Quinones, 2020).
This paper will be focused on the design of the
closed-loop control system delivering a drug into a
patient intravenously based on a set-point of drug
plasma concentration. Experiments will involve sim-
ulating a closed-loop control system which will be
able to administer the drug to maintain drug plasma
concentrations to the simulated patient. This paper
will also be comparing the use of a PID controller and
an MPC controller to find which controller is more
suited to deliver a drug to a patient autonomously.
For similar drug infusion systems, like insulin in-
fusion systems, it was proven that MPC closed-loop
control systems are more efficient than the standard
open-loop infusion of insulin, and that patients’ in-
sulin levels remained within the set-point range more
often than in the open-loop case (Clarke et al., 2009)
(Bruttomesso et al., 2009). The artificial pancreas
has also been designed and compared with the MPC
and the PID controllers, and it has been shown that
the MPC outperforms the PID in this application, al-
though both controllers provided adequate glucose
control (Pinsker et al., 2016).
Unlike (Clarke et al., 2009) and (Bruttomesso
et al., 2009), which both make use of glucose-insulin
dynamics models, this paper uses the paediatric Paed-
fusor patient model used in anesthesia. Additionally,
the design of the models used in (Pinsker et al., 2016)
were personalized models for the MPC, but for this
paper, a general patient model was designed and ap-
plied for the entire patient group to study the efficacy
of the system controlling the drug infusion based off
of a general model.
There have been a number of studies conducted
making use of closed-loop control strategies in anes-
thesia (Nas¸cu et al., 2014) (De Keyser et al., 2015)
(Padula et al., 2017) (Ntouskas and Sarimveis, 2021).
To detect the level of hypnosis experienced by the pa-
tient, these papers make use of the bispectral (BIS)
index commonly used in practice (Rampil, 1998), al-
though other measures, such as the mid-latency audi-
126
Setati, T., Perold, W., Fourie, P. and Withey, D.
Comparing Closed-loop Control of Drug Infusion using MPC and PID.
DOI: 10.5220/0010783700003123
In Proceedings of the 15th International Joint Conference on Biomedical Engineering Systems and Technologies (BIOSTEC 2022) - Volume 1: BIODEVICES, pages 126-133
ISBN: 978-989-758-552-4; ISSN: 2184-4305
Copyright
c
2022 by SCITEPRESS – Science and Technology Publications, Lda. All rights reserved

tory evoked potentials (MLAEP) could also be used
to form an indication of the depth of anesthesia ex-
perienced by a patient (Mantzaridis and Kenny, 1997)
(Kuhnle et al., 2013).
This paper compares an MPC controller and a
PID controller in controlling the delivery of anesthe-
sia. This is done by comparing the step responses of
both types of control strategies, along with analysing
how both operate in the presence of sensor noise and
comparing the computation time taken by both con-
trollers. This would provide some useful information
in considering the practicality of each controller in a
surgical context.
This paper contains a total of five sections. Sec-
tion 1 is the introduction of the paper, Section 2 con-
tains the background material related to the paper,
Section 3 expands on the methods used to run the ex-
periments, Section 4 gives the experiment results and
discusses the results, and Section 5 is the conclusion.
2 BACKGROUND
2.1 Control Systems in Anesthesia
For the successful implementation of a control sys-
tem in anesthesia, there are a few key components that
must be included. There must be a measurable con-
trol variable used to determine the effect of the drugs
administered, an established set-point for the control
variable, a controller and a control actuator to admin-
ister the drug, and the system must fit the appropriate
pharmacokinetics and pharmacodynamics for the ap-
plication (Struys et al., 2006).
The use of control systems for drug delivery in
medical contexts dates as far back as the 1980s. They
were initially implemented in insulin infusion sys-
tems for people with diabetes (Deckert et al., 1980)
(Doyle et al., 2014) and the applications have ex-
panded to other uses, including the control of neuro-
muscular systems (Solomonow, 1984) and anesthesia
(Westenskow, 1987) (Dumont, 2012).
For medical control systems, especially drug ad-
ministration systems, PID controllers pose stability
risks in the administration. PID controllers need to be
meticulously tuned for specific scenarios and without
proper tuning, they run the risk of oscillating before
reaching, or during, steady state (Struys et al., 2006).
This is because the design of PID controllers does
not incorporate information about drug metabolism,
which could potentially allow the administration of
dangerously high drug concentrations.
Figure 1: The three-compartment mamillary PK model.
2.2 Pharmacokinetics and
Pharmacodynamics
Pharmacokinetics (PK) define the movement of a
drug within a patient. This involves the absorption,
distribution, metabolism and elimination of the drug
and this movement is highly dependent on patient-
specific parameters, such as age, weight, height, and
sex. Pharmacodynamics (PD) define the influence of
the drug on the patient. This involves receptor bind-
ing, post-receptor effects and chemical interactions
(Bibian, 2006).
For intravenous drug infusion, the pharmacoki-
netics of the patient are best described by the three-
compartment mamillary PK model, depicted in Fig-
ure 1. This model consists of three compartments in
which the drug can be distributed. The first compart-
ment (V1) is the blood, where the drug is directly in-
jected. The second compartment (V2) is the fast com-
partment, which is the muscle. Lastly, the third com-
partment (V3) is the slow compartment, which repre-
sents the fat (Hull, 1979).
To simulate the pharmacokinetics of a patient, a
state-space model is commonly used. The state-space
model is defined as:
˙q
1
(t)
˙q
2
(t)
˙q
3
(t)
=
−(k
10
+ k
12
+ k
13
) k
21
k
31
k
12
−k
21
0
k
13
0 −k
31
q
1
(t)
q
2
(t)
q
3
(t)
+
1
0
0
u (1)
C
p
=
1 0 0
q
1
(t)
q
2
(t)
q
3
(t)
+ 0 · u (2)
with q
i
as the mass of the drug in the i−th com-
partment,, and the k
i j
parameters represent the trans-
fer rate constants from compartment i to compartment
j, u is the infusion rate and C
p
is the drug plasma con-
centration in the patient (Hull, 1979).
Comparing Closed-loop Control of Drug Infusion using MPC and PID
127

2.3 Control Strategies
The vast number of controllers all have unique ap-
proaches to the control problem and have varied lev-
els of complexities, but the end goal of each type of
control system is to drive the behaviour of the sys-
tem output. The two controllers used in this study are
listed below.
2.3.1 PID
The Proportional-Integral-Derivative (PID) controller
is one of the most popular control algorithms used
(Kumar et al., 2011). The PID controller is made of
three separate controllers and each controller serves a
specific purpose in the control trajectory of the con-
troller and each of these controllers is dependent on
the system’s error signal e(t), which is the difference
between the measured output and the system’s refer-
ence signal.
The proportional feedback controller, or P-
controller, linearly adjusts the controller’s output to
the error signal. The integral feedback controller,
or I-controller, linearly adjusts the controller propor-
tional to the integral of the error signal. This is
used to decrease the steady-state error signal of the
system between the output and the reference signal.
The derivative feedback controller, or D-controller,
decreases the overshoot of the system step response
and improves the system’s overall stability. The
D-controller’s output is proportional to the rate of
change of the system error. (Gene F. Franklin, 2015).
Therefore, the controller output can be written as
u
PID
= k
P
e(t) + k
I
Z
t
t
0
e(τ)dτ + k
D
˙e(t) (3)
with k
P
as the proportional gain, k
I
as the integral
gain, and k
D
as the derivative gain.
2.3.2 MPC
Model Predictive Control (MPC) is an advanced con-
trol strategy that solves an open-loop optimal control
problem with defined constraints and system-state dy-
namics on-line. A unique feature of the MPC is that
it incorporates a model of the system within the con-
trol algorithm to optimize the control actions that are
determined .
The MPC uses the system model to make predic-
tions of the future behaviour of the system and its dy-
namics over a defined period, called the “prediction
horizon.” From these predictions, the MPC will im-
plement the first few predictions made in the defined,
shorter period called the “control horizon.” Once the
Figure 2: The closed-loop control system.
control manoeuvre is implemented, the MPC will pre-
dict the possible control actions for the next prediction
horizon (Findeisen and Allg
¨
ower, 2002) (Rakovi
´
c and
Levine, 2018).
3 METHODS
The designed closed-loop control system will be sim-
ulated as depicted in Figure 2. The closed-loop con-
trol system is made up of the following elements.
3.1 The Control Loop
The system’s reference defines the value the system
aims to achieve. The reference signal will be the
plasma concentration within the patient. In the simu-
lation, this will be specified by a selected concentra-
tion.
The plant to be used for the system is the patient.
To understand the influence of the drug on the patient,
a thorough understanding of pharmacokinetics (PK)
is needed. For the closed-loop control system, the pa-
tient will be simulated as a three-compartmental state-
space Paedfusor PK model of the patient (Absalom
et al., 2003). The same model used for the plant will
be used as the internal model of the MPC. The mea-
sured output from the simulated patient model will be
the drug concentration in the patient’s plasma. This
output will be fed back into the controller to close the
loop.
The controllers used, the MPC and PID con-
trollers, will be implemented separately to compare
the performance given by each controller.
3.1.1 MPC
To determine a step response with no overshoot and
with the shortest settling time possible, the MPC con-
troller was designed with the parameters listed in Ta-
ble 1.
The sampling time was selected assuming that the
plasma concentration measurements will be taken ev-
ery 10 s, and then the drug will be delivered. The pre-
diction horizon sample number was chosen as a value
that would allow for an adequate amount of future
BIODEVICES 2022 - 15th International Conference on Biomedical Electronics and Devices
128

predictions, without calculating too many future pre-
dictions, saving computational resources. The con-
trol horizon is chosen as 10% of the prediction hori-
zon. The weights were determined by designing the
MPC controller with the MATLAB MPC Designer by
adjusting the robustness of the controller to have no
overshoot and a short settling time (The MathWorks,
a).
Table 1: MPC controller parameters.
Parameter Value
Sample time (T
s
) 10 s
Prediction horizon 20
Control horizon 2
Weights
MV 0
MV Rate 0.146
OV 0.412
MV: Manipulated Variable
OV: Output Variable
3.1.2 PID
The parameters of the PID controller were determined
by using MATLAB’s PID Tuner to automatically de-
termine the parameters based on the desired response
(Xue et al., 2007). The parameters are listed in Ta-
ble 2. Unfortunately, a system response with no over-
shoot was unattainable, therefore a system response
with as small an overshoot as possible was consid-
ered.
Table 2: PID controller parameters.
PID parameter Value
P (proportional term) 2.789
I (integral term) 0.06746
D (derivative term) -5.0887
3.2 Added Measurement Noise
To analyse how the systems will respond in the pres-
ence of noise, measurement noise was added accord-
ing to Table 3. The signal-to-noise ratio (SNR) is the
ratio of the power of a desired signal relative to the
power of the noise within the signal (Kieser et al.,
2005), in decibels (dB). The SNR is defined as:
SNR
dB
= 10log
10
P
Signal
P
Noise
dB (4)
with P
Signal
as the power of the desired signal, re-
spectively.
Table 3: Magnitude of Measurement Noise Added for each
Simulation.
Simulation SNR [dB]
1 40
2 30
3 20
4 15
5 10
6 5
7 0
8 -3
3.3 Patient Group
To analyse the influence that inter-patient variability
would have on the system, the designed system was
tested on a simulated patient group. The 14 simu-
lated patients used in this paper was randomly gener-
ated using the patient characteristic data from (Kuhnle
et al., 2013), which is also listed in Table 4.
Table 4: Simulated Patient Group (Kuhnle et al., 2013).
Patient characteristic data Mean (SD) (range)
Number of patients (n) 14
Age (yr) 8.6 (4.3) (4.0 - 16.5)
Weight (kg) 29.2 (14.6) (15.0 - 60.0)
Height (cm) 125.9 (26.2) (67.0 - 160.0)
3.4 Measuring Plasma Concentration
To measure the anesthetic plasma concentration in
a patient directly is undesirable because it would
be an invasive procedure, where the patient’s blood
would need to be drawn and the anesthetic would
need to be measured in real time. Therefore, mea-
sures of hypnosis have been found that can correlate
the level of anesthesia a patient experiences to the
amount of plasma in a patient’s plasma. These mea-
sures include electroencephalogram (EEG) modelling
(Rampil, 1998), power spectrum analysis (Pichlmayr
et al., 2012), bispectral (BIS) index (Ontario et al.,
2004) and evoked potentials (Walsh et al., 2005).
The work conducted in (Kuhnle et al., 2013) found
a strong correlation between plasma concentration
and mid-latency auditory evoked potentials (MLAEP)
(Plourde, 2006) which suggests that it may be pos-
sible to estimate blood plasma concentration from
MLAEP, in the case of the anesthesia application.
Comparing Closed-loop Control of Drug Infusion using MPC and PID
129
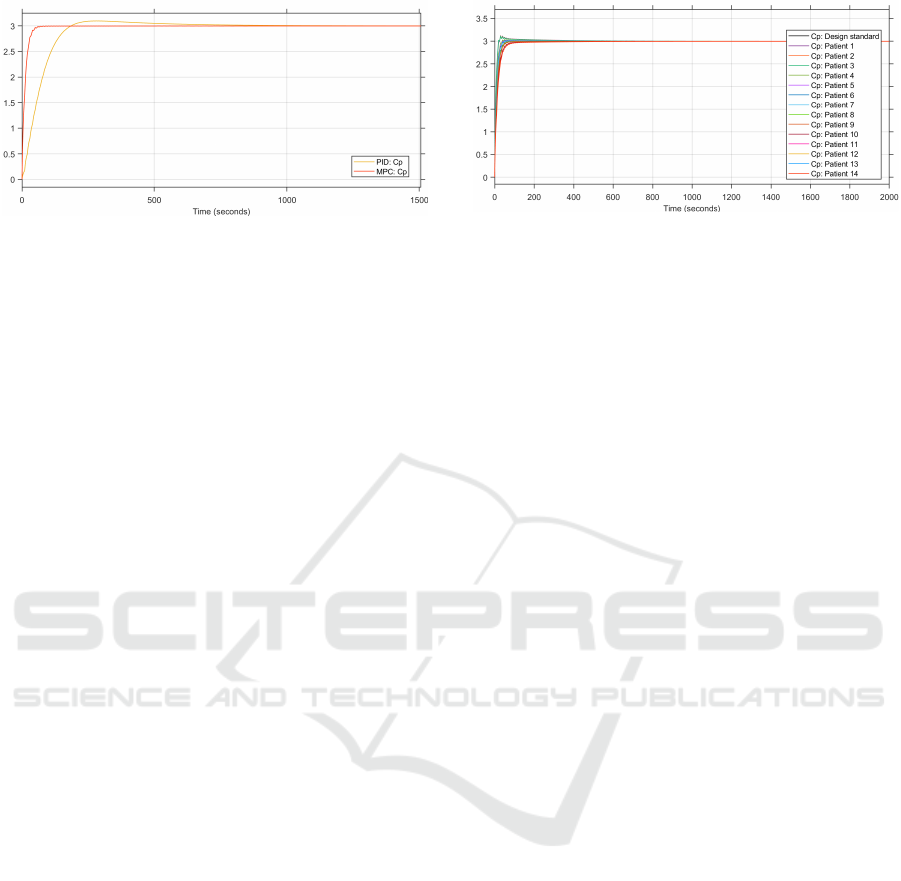
Figure 3: Comparison of the plasma concentrations from
the MPC and PID control loops (in µg.ml
−1
).
4 SIMULATION RESULTS
The following section expands on the results achieved
from the simulations. The simulations were run using
MATLAB and Simulink.
4.1 Step Response
The objective of the control system is to reach the
reference plasma concentration as quickly as possible
without overshooting the reference value because in
a practical system, overshooting the reference value
could lead to complications as a result of drug over-
dose. This will simulate a drug being delivered intra-
venously to a patient to reach a desired plasma con-
centration. The reference plasma concentration is set
to 3 µg.ml
−1
.
To compare the performance of the MPC con-
troller to the PID controller, the step responses of both
controllers are plotted together. The step response
of the plasma concentration from the patient group’s
average patient is depicted in Figure 3. The step re-
sponse of the MPC is better than that of the PID. The
2% settling time of the MPC controller is at 47.9 s and
that of the PID is at 146.2 s. Additionally, the step re-
sponse of the MPC has no overshoot, while that of
the PID has a slight overshoot, reaching a maximum
of 3.04 µg.ml
−1
.
4.2 Inter-patient Variability
To determine how the systems would operate with a
wide variety of patients, it was tested on the patient
group described in Table 4. The results labelled “Cp:
Design standard” are the results of the average patient,
who was used to design the system and whose results
are depicted in Figure 3.
Figure 4: Step responses of the patient groups’ plasma con-
centration with the MPC controller (in µg.ml
−1
).
4.2.1 MPC
The results of the step response of the MPC closed-
loop controller for the patient group is shown in Fig-
ure 4. The results vary according to the age of the
patient. Patients that are younger than the average pa-
tient tend to have shorter settling times and overshoot
the reference plasma concentration. Patients that are
older than the average patient do not overshoot the
reference value, but their 2% settling time is longer
than that of the average patient.
The reason for younger patients overshooting the
reference plasma concentration is likely because they
have more rigorous pharmacokinetics because of their
smaller compartmental models and the same rate
transfer constants as those of older patients.
To analyse the influence of the internal patient
model on the control system, an MPC controller was
implemented with the average patient as the internal
patient model, with an age of 8.6 years, weight of 29.2
kg and height of 125.9 cm. This MPC controller de-
sign was used to control the anesthetic infusion for the
same patient population, and the performance of this
control system is depicted in Figure 5.
From Figure 5, the plasma concentration of the pa-
tients that are younger than the internal patient model
oscillate before reaching steady state. This would be
undesirable in practice as it would result in irregular,
and potentially dangerous, infusion to the patient. It
is therefore better to incorporate an internal patient
model which corresponds to the patient undergoing
anethesia to allow for safer sedation for the patient
population.
4.2.2 PID
The step responses of the patient group simulated
with the PID closed-loop control system are depicted
in Figure 6.
From the results, it is clear to see that there is
also inter-patient variability at play with the PID con-
troller. Patients that are younger than the average pa-
tient have quicker settling times when compared to
BIODEVICES 2022 - 15th International Conference on Biomedical Electronics and Devices
130
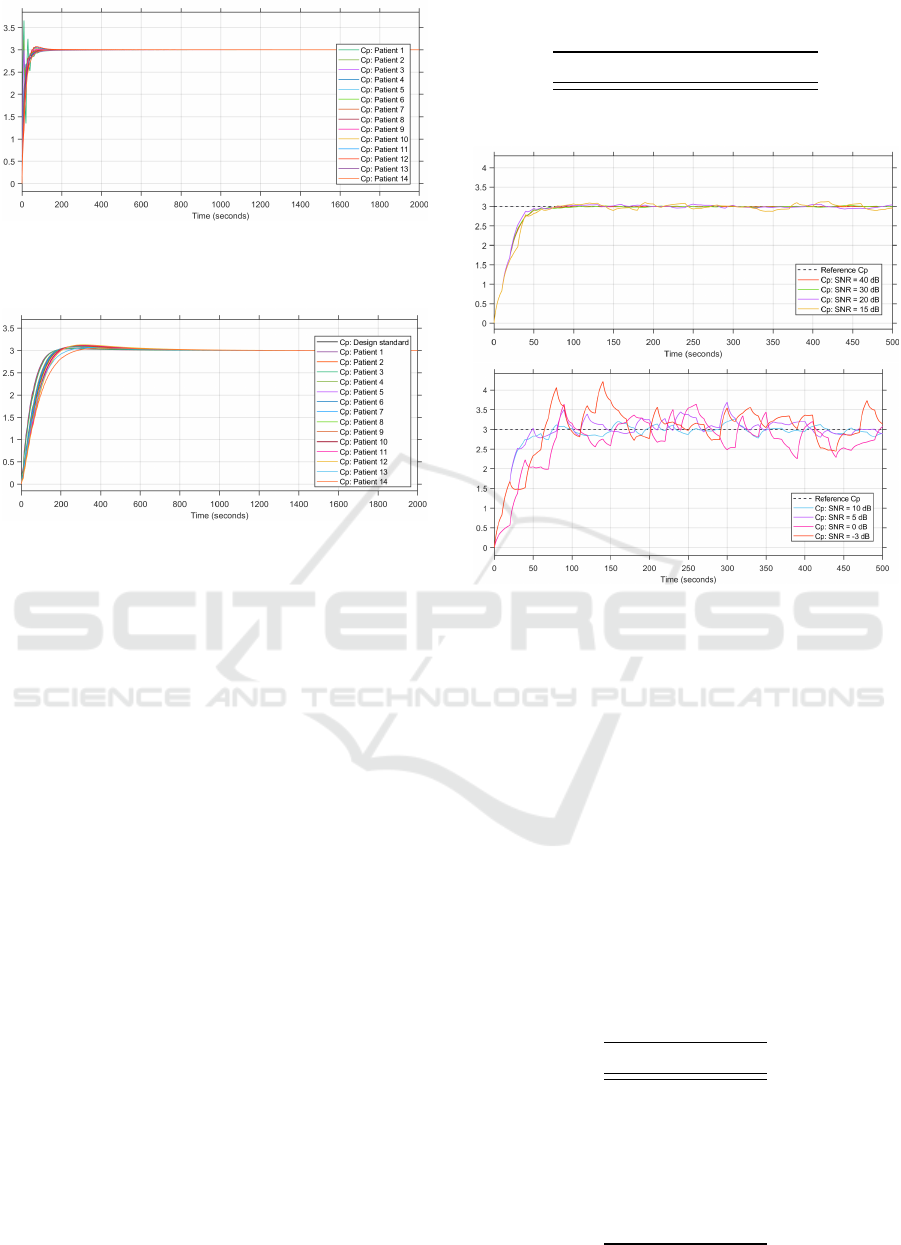
Figure 5: Step responses of the patient groups’ plasma con-
centration for the MPC controller with constant internal
model (in µg.ml
−1
).
Figure 6: Step responses of the patient groups’ plasma con-
centration with the PID controller (in µg.ml
−1
).
the average patient. This could be for the same reason
that younger patients overshoot in the MPC simula-
tions.
4.3 Execution Time
To compare how resource intensive each system is,
the two controller’s execution times were measured
for the simulation of the patient group over a 2000 s
window. Simulink is a model-based design software
package and it is not optimized for real time opera-
tion. However, the simulation times are still useful as
a basis for comparison (The MathWorks, b).
The execution times for each patient and the av-
erage execution time are shown in Table 5. For the
MPC control loop, the average execution time was
6.777 s and the PID control system executed for an
average time of 5.691 s. The execution times also in-
dicate that the PID controller remains more consistent
in terms of computation time when controlling infu-
sion for the different patients with varying PK mod-
els, indicated by a smaller standard deviation. This
indicates that the PID system would be less resource
intensive in a practical setting as it does not need as
much processing power to execute the control loop as
the MPC controller would need.
Table 5: Execution Times for all 14 Patients According to
the MPC or PID Controller used.
MPC [s] PID [s]
Average 6.78 5.69
Standard deviaton 2.25 0.73
Figure 7: Simulated patient’s plasma concentrations with
measurement noise in the MPC control loop (Upper plot:
SNR 40 dB to 15 dB. Lower plot: SNR 10 dB to -3 dB.)
4.4 Measurement Noise
For the measurement noise simulations, the MPC
control system’s performance is depicted in Figure 7
and the PID controller’s performance is depicted in
Figure 8 and the root mean squared error (RMSE) of
the various noise levels for both controllers are listed
in Table 6.
According to Table 6, the MPC controller has bet-
ter noise suppression than the PID controller. In a
real-system, noise is an inevitable factor to consider,
so this justifies that the MPC controller is a better con-
troller to use.
Table 6: RMSE of the MPC and PID controllers at different
SNR.
SNR MPC PID
40 0.711 0.721
30 0.587 0.697
20 0.594 0.580
15 0.555 0.579
10 0.574 0.547
5 0.575 0.582
0 0.585 0.568
-3 0.775 0.588
Comparing Closed-loop Control of Drug Infusion using MPC and PID
131
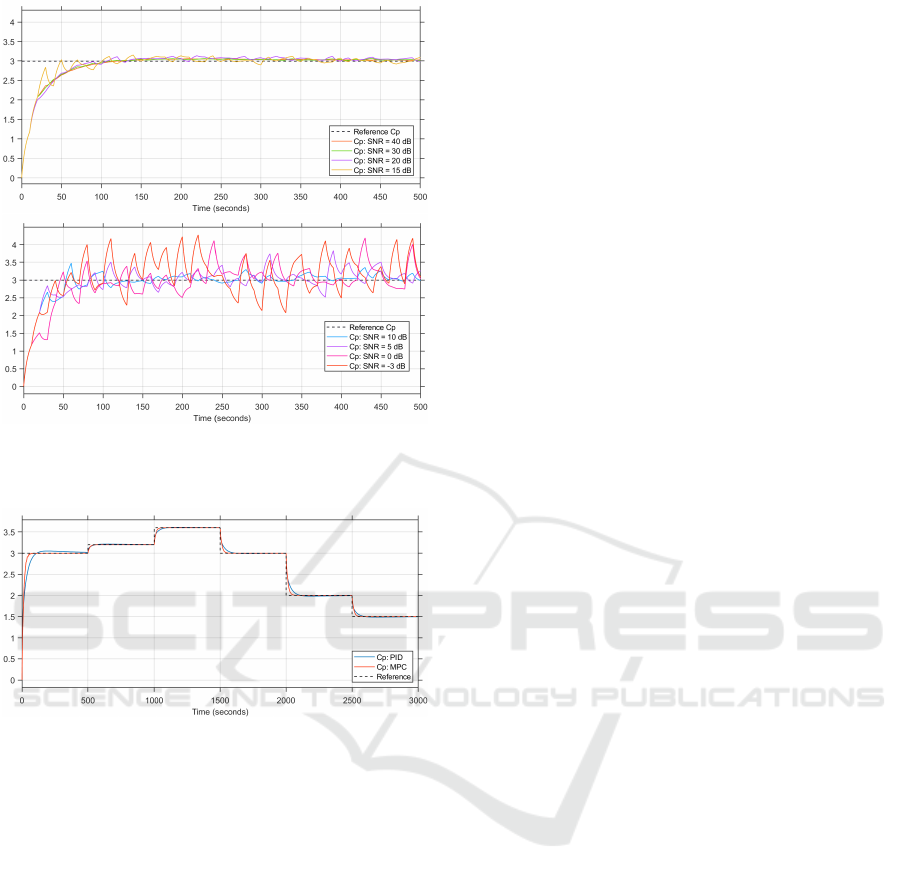
Figure 8: Simulated patient’s plasma concentrations with
measurement noise in the PID control loop (Upper plot:
SNR 40 dB to 15 dB. Lower plot: SNR 10 dB to -3 dB.)
Figure 9: Changing the reference plasma concentrations in
the MPC and the PID controller.
4.5 Changing Reference
To fully demonstrate the set-point following of
closed-loop control, the system is tested under the
condition of changing the reference concentration
during the simulation.
The results of the changing reference are depicted
in Figure 9. The results obtained from these simu-
lations are similar to those in the step response sim-
ulations, with the PID controller’s step response de-
picting longer settling time and slight overshoots. For
larger reference changes, the settling time of the PID
controller is longer than that of the MPC controller
and the overshoot is greater than that of the MPC con-
troller. For smaller reference changes, the MPC and
PID step responses are similar.
5 CONCLUSIONS
From the data gathered from both the MPC and PID
controllers, it can be concluded that the MPC con-
troller is the more suited controller to use in the con-
trol of drug plasma concentration. Even though the
MPC requires more processing power to operate than
the PID, it is more appropriate for this setting because
of its faster settling time, no overshoot, and shows bet-
ter operation in noise. Additionally, based on the re-
sults from the changing reference tests, the MPC con-
troller’s response follows the set point changes more
consistently than that of the PID controller.
For a less costly implementation, the PID control
system could be investigated further as the maximum
overshoot it produces may be within an acceptable
range and it is a less resource intensive control sys-
tem, as shown by of the more consistent computa-
tion time achieved when running the simulations for a
number of patients. However, PID controllers need to
be meticulously tuned for applications such as this be-
cause they run the risk of oscillating before or during
steady state if they are not properly tuned.
As mentioned in (Ntouskas and Sarimveis, 2021)
and (Gonzalez-Cava et al., 2021), for optimal con-
trol, irrespective of the control strategy used, the inter-
patient variability must be considered further as the
patients that lie at the edges of the PK models do not
follow the references given as precisely as the average
patients. This could be done by adapting the patient
models to make more considerations for patients that
lie at the edges of these PK models. Although the
plasma concentrations of these patient models do not
deviate too wildly from the reference points provided,
it would be desirable to have them follow the refer-
ence point as closely as possible for safer and more
predictable plasma concentration levels.
REFERENCES
Absalom, A., Amutike, D., Lal, A., White, M., and Kenny,
G. (2003). Accuracy of the ’paedfusor’in children un-
dergoing cardiac surgery or catheterization. British
Journal of Anaesthesia, 91(4):507–513.
Bibian, S. (2006). Automation in clinical anesthesia. PhD
thesis, University of British Columbia.
Bruttomesso, D., Farret, A., Costa, S., Marescotti, M. C.,
Vettore, M., Avogaro, A., Tiengo, A., Dalla Man, C.,
Place, J., Facchinetti, A., et al. (2009). Closed-loop
artificial pancreas using subcutaneous glucose sensing
and insulin delivery and a model predictive control al-
gorithm: preliminary studies in padova and montpel-
lier.
Clarke, W. L., Anderson, S., Breton, M., Patek, S., Kash-
mer, L., and Kovatchev, B. (2009). Closed-loop artifi-
BIODEVICES 2022 - 15th International Conference on Biomedical Electronics and Devices
132

cial pancreas using subcutaneous glucose sensing and
insulin delivery and a model predictive control algo-
rithm: the virginia experience.
De Keyser, R., Copot, D., and Ionescu, C. (2015). Estima-
tion of patient sensitivity to drug effect during propo-
fol hypnosis. In 2015 IEEE International Conference
on Systems, Man, and Cybernetics, pages 2487–2491.
IEEE.
Deckert, T., Bojsen, J., Christiansen, J. S., Kølendorf, K.,
Svendsen, P. A., and Andersen, A. R. (1980). 24-hour
blood glucose profiles in insulin-dependent diabetics
treated with intravenous insulin infusion systems: A
comparison between closed-and open-loop systems.
Acta Medica Scandinavica, 208(1-6):451–458.
Doyle, F. J., Huyett, L. M., Lee, J. B., Zisser, H. C., and
Dassau, E. (2014). Closed-loop artificial pancreas
systems: engineering the algorithms. Diabetes care,
37(5):1191–1197.
Dumont, G. A. (2012). Closed-loop control of anesthesia-a
review. IFAC Proceedings Volumes, 45(18):373–378.
Felman, A. (2020). Blood: Components, functions, groups,
and disorders. https://www.medicalnewstoday.com/
articles/196001.
Findeisen, R. and Allg
¨
ower, F. (2002). An introduction to
nonlinear model predictive control. In 21st Benelux
meeting on systems and control, volume 11, pages
119–141. Technische Universiteit Eindhoven Veld-
hoven Eindhoven, The Netherlands.
Gene F. Franklin, J. David Powell, A. E.-N. (2015). Feed-
back Control of Dynamic Systems, chapter 4, pages
216–237. Pearson Education Limited, 7 edition.
Gonzalez-Cava, J. M., Carlson, F. B., Troeng, O., Cervin,
A., van Heusden, K., Dumont, G. A., and Soltesz,
K. (2021). Robust pid control of propofol anaesthe-
sia: uncertainty limits performance, not pid structure.
Computer Methods and Programs in Biomedicine,
198:105783.
Hull, C. (1979). Pharmacokinetics and pharmacodynamics.
British Journal of Anaesthesia, 51(7):579–594.
Kieser, R., Reynisson, P., and Mulligan, T. J. (2005). Def-
inition of signal-to-noise ratio and its critical role in
split-beam measurements. ICES Journal of Marine
Science, 62(1):123–130.
Kuhnle, G., Hornuss, C., Lenk, M., Salam, A., Wiepcke, D.,
Edelmann-Gahr, V., Flake, G., Daunderer, M., Ober-
hauser, M., M
¨
uller, H.-H., et al. (2013). Impact of
propofol on mid-latency auditory-evoked potentials in
children. British journal of anaesthesia, 110(6):1001–
1009.
Kumar, V., Nakra, B., and Mittal, A. (2011). A review on
classical and fuzzy pid controllers. International Jour-
nal of Intelligent Control and Systems, 16(3):170–181.
Mantzaridis, H. and Kenny, G. (1997). Auditory evoked
potential index: a quantitative measure of changes in
auditory evoked potentials during general anaesthesia.
Anaesthesia, 52(11):1030–1036.
Nas¸cu, I., Krieger, A., Ionescu, C. M., and Pistikopoulos,
E. N. (2014). Advanced model-based control stud-
ies for the induction and maintenance of intravenous
anaesthesia. IEEE Transactions on biomedical engi-
neering, 62(3):832–841.
Ntouskas, S. and Sarimveis, H. (2021). A robust model pre-
dictive control framework for the regulation of anes-
thesia process with propofol. Optimal Control Appli-
cations and Methods.
Ontario, H. Q. et al. (2004). Bispectral index monitor: an
evidence-based analysis. Ont Health Technol Assess
Ser, 4(9):1–70.
Padula, F., Ionescu, C., Latronico, N., Paltenghi, M., Vi-
sioli, A., and Vivacqua, G. (2017). Optimized pid
control of depth of hypnosis in anesthesia. Computer
methods and programs in biomedicine, 144:21–35.
Pichlmayr, I., Lips, U., and K
¨
unkel, H. (2012). The elec-
troencephalogram in anesthesia: fundamentals, prac-
tical applications, examples. Springer Science &
Business Media.
Pinsker, J. E., Lee, J. B., Dassau, E., Seborg, D. E., Bradley,
P. K., Gondhalekar, R., Bevier, W. C., Huyett, L.,
Zisser, H. C., and Doyle, F. J. (2016). Randomized
crossover comparison of personalized mpc and pid
control algorithms for the artificial pancreas. Diabetes
Care, 39(7):1135–1142.
Plourde, G. (2006). Auditory evoked potentials. Best Prac-
tice & Research Clinical Anaesthesiology, 20(1):129–
139.
Rakovi
´
c, S. V. and Levine, W. S. (2018). Handbook of
model predictive control. Springer.
Rampil, I. J. (1998). A primer for eeg signal processing in
anesthesia. Anesthesiology: The Journal of the Amer-
ican Society of Anesthesiologists, 89(4):980–1002.
Shokrekhodaei, M. and Quinones, S. (2020). Review
of non-invasive glucose sensing techniques: Optical,
electrical and breath acetone. Sensors, 20(5):1251.
Solomonow, M. (1984). External control of the neuromus-
cular system. IEEE transactions on Biomedical Engi-
neering, (12):752–763.
Struys, M. M., Mortier, E. P., and De Smet, T. (2006).
Closed loops in anaesthesia. Best Practice & Research
Clinical Anaesthesiology, 20(1):211–220.
The MathWorks, I. Matlab. https://www.mathworks.com/
products/matlab.html.
The MathWorks, I. Optimize performance.
https://www.mathworks.com/help/simulink/
performance performance.html.
Walsh, P., Kane, N., and Butler, S. (2005). The clinical
role of evoked potentials. Journal of neurology, neu-
rosurgery & psychiatry, 76(suppl 2):ii16–ii22.
Westenskow, D. R. (1987). Closed-loop control of blood
pressure, ventilation, and anesthesia delivery. Interna-
tional journal of clinical monitoring and computing,
4(2):69–74.
Xue, D., Chen, Y., and Atherton, D. P. (2007). Linear
feedback control: analysis and design with MATLAB.
SIAM.
Comparing Closed-loop Control of Drug Infusion using MPC and PID
133
