
Neural Network PET Reconstruction using Scattered Data in
Energy-dependent Sinograms
Gabrielle Fontaine
1
, Peter Lindstrom
1
and Stephen Pistorius
1,2
1
Department of Physics and Astronomy, University of Manitoba, 30A Sifton Road, Winnipeg, MB R3T 2N2, Canada
2
CancerCare Manitoba Research Institute, 675 McDermot Ave, Winnipeg, MB R3E 0V9, Canada
Keywords: Positron Emission Tomography, Medical Imaging, Neural Network, Deep Learning, Scattered Coincidences,
Direct Reconstruction.
Abstract PET image reconstruction largely relies on pre-reconstruction data correction, which may add noise and
remove information. This loss is particularly notable when correcting for scattered coincidences, which are
useful for image reconstruction, though algorithmic scatter reconstructions require a detector energy
resolution that exceeds the current state-of-the-art. Preliminary research has demonstrated the feasibility of
using convolutional neural networks (CNNs) to reconstruct images directly from sinogram data. We have
extended this approach to reconstruct images from data containing scattered coincidences. Monte Carlo
simulations were performed to simulate PET data from digital phantoms. Data were modeled using 15%
FWHM energy resolution detectors. Energy-dependent sinograms (EDSs), containing true and scattered
coincidences, were constructed from the data. After data augmentation, 210,000 sinograms were obtained. A
CNN was trained on the EDS-activity pairs for image reconstruction. A second network was trained on
sinograms containing only photopeak coincidences. Images were also reconstructed using FBP, and MLEM
approaches. The EDS trained network outperformed the photopeak trained network, with a higher mean
structural similarity index (0.69 ± .05 vs. 0.63 ± .05) and lower average mean square error (0.16 ± .04 vs. 0.20
± .04). Our work demonstrates that CNNs have the potential to extract useful information from scattered
coincidences, even for data containing significant energy uncertainties.
1 INTRODUCTION
Typical positron emission tomography (PET) image
reconstruction techniques make corrections to the raw
data prior to image reconstruction. These include
corrections for dead time, attenuation, random and
scattered coincidences, and normalization. Such
corrections are imperfect. As such, they introduce
noise and can remove valuable data (Cherry, 2012;
Bai & Asma, 2016). The former is evident from the
decreased noise equivalent counting rate (NECR) that
results from scatter and random correction (Cherry,
2012, p. 340). Additionally, any alteration of the data
destroys its Poisson nature (Bai & Asma, 2016, p.
266).
Scattered coincidences, in particular, contain
information that is beneficial for image
reconstruction. Such information may increase
sensitivity due to a lower energy window threshold
(Conti et al., 2012), and when used in image
reconstruction, has been shown to improve contrast
recovery and decrease noise (Sun & Pistorius, 2013a,
2013b). Furthermore, scattered coincidences contain
information about the electron density of the
scattering medium, thereby allowing attenuation
maps to be estimated from scatter data (Berker et al.,
2014; Brusaferri et al., 2020; Sun et al., 2015).
To date, scatter reconstruction studies have
primarily focused on iterative approaches. These take
advantage of the physics of Compton scattering to
constrain annihilation positions to within areas or
volumes in a 2-D or 3-D image space. Both time-of-
flight (TOF) (Conti et al., 2012) and non-TOF (Conti
et al., 2012; Sun, 2016; Sun et al., 2015; Sun &
Pistorius, 2013a, 2013b) methods have been
implemented. Though most approaches have focused
on coincidences where only one photon is scattered,
it has also been demonstrated that even when both
photons are scattered, this is sufficient to constrain the
annihilation position (Sun, 2016).
In the absence of high-resolution TOF
information, detector energy resolution must be
Fontaine, G., Lindstrom, P. and Pistorius, S.
Neural Network PET Reconstruction using Scattered Data in Energy-dependent Sinograms.
DOI: 10.5220/0010782100003123
In Proceedings of the 15th International Joint Conference on Biomedical Engineering Systems and Technologies (BIOSTEC 2022) - Volume 2: BIOIMAGING, pages 35-42
ISBN: 978-989-758-552-4; ISSN: 2184-4305
Copyright
c
2022 by SCITEPRESS – Science and Technology Publications, Lda. All rights reserved
35

sufficient to extract useful spatial information (Conti
et al., 2012). Given current detector energy
resolutions, coincidence timing resolution (CTR)
values must be significantly better than 58-80ps,
which is challenging to achieve (Meikle et al., 2021,
p. 22).
1.1 Deep Learning in Image
Reconstruction
Deep-learning (DL) networks have been applied to
PET imaging. To date, most published studies focus
on networks working entirely in image-space, taking
as an input an image, and producing another image as
output. A common application is generating
attenuation-corrected (AC) PET images from non-
attenuation corrected (NAC) PET images (Dong et
al., 2019, 2020; Shiri et al., 2019). These approaches
do not make use of scatter. Another PET image-space
application is the so-called “super-resolution”
problem, wherein a network attempts to derive a high-
resolution image from a low-resolution one. Song et
al. (Song et al., 2020) provide a particularly thorough
example of this technique. Lastly, CNNs have been
employed to denoise images (Tian et al., 2019). A
comprehensive list of PET image-space studies can
be found in (Lee, 2021).
There is an alternative approach. So-called direct
reconstruction approaches perform a domain
transform to reconstruct images directly from binned
data. These typically employ convolutional neural
networks (CNNs). Compared to algorithmic or
combined algorithmic/DL approaches, certain
advantages are present. First, direct reconstruction is
generally simpler. Second, DL approaches offer a
possible solution to the ill-posedness of the PET
inverse problem (Bai & Asma, 2016, p. 269). This
solution takes the form of a non-linear filter that
approximates regularization or image smoothing and
is learned directly from the data. This may be thought
of as similar to maximum a-posteriori (MAP)
estimation where, from among images of similar
likelihood values, one is chosen that is most probable
given the prior (Bai & Asma, 2016, p. 270). As DL
approaches are data-driven, the prior may be
conceptualized as being learned implicitly from
thousands of training examples.
Another probable advantage of direct
reconstruction is the implicit incorporation of point-
spread functions (PSFs). For iterative reconstruction
methods, incorporating PSFs has been shown to
improve image quality (Tong et al., 2010). A DL
network may implicitly learn a spatially variant PSF
from the data, thereby improving image quality.
In earlier work on direct reconstruction
(Häggström et al., 2019; Liu et al., 2019; Zhu et al.,
2018), scatter was not employed. In the present
context, the primary advantage of using direct
reconstruction is—as we demonstrate—the ability of
CNNs to make use of low-energy resolution scatter
data to improve image quality.
2 METHODS
2.1 Simulation Parameters
Twelve XCAT digital phantoms (Segars et al., 2010)
were obtained, ranging in sex, weight, race and age.
Each phantom was modified ten times by varying the
activity uptake ratios, organ scaling and rotation,
yielding a total of 120 phantoms. From each phantom,
250 transverse slices were obtained, spaced every 3
mm. Thus, 30,000 2-D activity distributions (images)
were generated. Slice dimensions were 40 x 40 cm
(71 x 71 pixels).
Monte Carlo simulations were performed on the
XCAT phantoms. The Geant4 Application for
Tomographic Emission (GATE) (Jan et al., 2004) was
used to simulate positron emission and annihilation,
photon propagation, and detection of coincidences. A
three-dimensional cylindrical array of detectors was
created around the phantoms. The dimensions of the
crystal detectors were 3 mm x 3 mm x 20 mm. The
height and radius of the cylinder were set to 750 mm
and 150 mm, respectively, and the coincidence
window was set to 10 ns.
The GATE source code was modified so that
annihilation and scattered photon propagation were
constrained to within the transverse polar plane. As
this study focused on 2-D image reconstruction,
doing so reduced the number of photons that needed
to be simulated and thus reduced computation time.
Although the simulated acquisition was performed in
3D mode, constraining the photons had the effect of
simulating 2D acquisition.
The detector energy resolution was set to 15%
FWHM in order to represent realistic PET photon
detectors.
2.2 Data Acquisition
Data were recorded in list mode. Approximately 10
6
counts were recorded per slice. Scatter fractions ranged
from 30% to 50%, depending upon the size of the slice
(torso, head, etc.). Three bins were established
according to photon energy: 456 – 506 keV (bin 1), 478
– 528 keV (bin 2), and 486 – 536 keV (bin 3). Where,
BIOIMAGING 2022 - 9th International Conference on Bioimaging
36

for a single coincidence, both photon energies fell into
bin 1, the coincidence was assigned to bin 1. Where
one photon energy fell into bin 1, and the other fell into
bin 2, the coincidence was assigned to bin 2. Similarly,
where one photon energy fell into bin 1, and the other
fell into bin 3, the coincidence was assigned to bin 3.
Coincidences that could be placed into two bins, due to
the overlapping energy ranges, were placed into both.
Therefore, the binning of the data was accomplished
via a sliding window.
Coincidences in bin 1, centered about 511 keV,
were more likely true coincidences, relative to those
in bins 2 and 3. Coincidences in bin 2 were likely due
to a singly scattered coincidence. The likely scattered
photons in this bin had energies centered about 503
keV, which corresponds to a 10-degree Compton
scatter. Bin 3 had a central energy of 481 keV, which
corresponds to a 20-degree Compton scatter. The
binning of the data therefore structures it
approximately according to scattering angle, binning
coincidences mainly where only a single photon is
scattered, which constitute most scattered
coincidences (Conti et al., 2012). Due to the energy
uncertainty of the detectors, however, some
coincidences may have been improperly binned.
2.3 Sinogram Construction
Two categories of sinograms were constructed from
the binned data: energy-dependent sinograms (EDSs)
and photopeak sinograms. Photopeak sinograms were
created from bin 1 data only. To construct the EDSs,
individual sinograms were created from the data in
each bin and then combined into a single 3-D array
with dimensions s , ɸ and bin number, where s and ɸ
are the polar coordinates of a 2-D sinogram.
An attenuation correction that assumed that the
simulated phantoms were composed entirely of water
was performed for both types of sinograms. The
average total distance travelled in matter for the
photons in each scattered coincidence was calculated
for all possible singly scattered travel paths. Only the
section of each path which intersected with the
volume of the phantom counted towards the average.
This average distance, together with the Compton
cross-section for water, was used to calculate the
average attenuation coefficient for each scattered
coincidence. Future studies will take an attenuation
map as an additional input to the network to account
for variations in electron density.
As doubly scattered photons were confined to the
transaxial plane by the alteration to the GATE source
code, an attenuated coincidence (that is, one in which
more than one scatter event occurred) could still be
binned, so long as the scattered photon energy was
not below 456 keV (the threshold for bin 3). While
the coincidence would then effectively be counted
twice, we relied on the network to learn corrections
for this. However, it would also be possible to employ
a more sophisticated energy-dependent attenuation
correction factor, which depends on a restricted
Compton cross-section, to deal with this complication
(Sun, 2016, p. 58).
No dead time, random, arc, or normalization
corrections were performed; we relied on the network
to learn these.
Data augmentation was performed to efficiently
increase the number of training examples. Each 2-D
activity image was randomly flipped and rotated, with
the corresponding sinograms modified appropriately.
This was done six times for every image-sinogram
pair, yielding a total of 210,000 image-sinogram pairs.
2.4 Network and Training
A detailed representation of the network we
employed is depicted in Fig. 1. Similar to (Häggström
et al., 2019), we implemented an encoder-decoder
architecture, but as in (Whiteley et al., 2020) we used
fully connected (dense) layers in the center of the
network. These ensured that each pixel in the image
space had as its receptive field the entire input
sinogram, which was desirable due to the presence of
scatter in the data.
Two different networks (which employed the
same network architecture) were trained on the two
different types of sinograms and are referred to as the
EDS network and the photopeak network. Therefore,
the dimensions of the input data—and thus also the
dimensions of the first set of filters—varied
depending upon the sinogram type. EDSs were of size
101 x 180 x 3 (the last digit comes from the three
energy bins), whereas photopeak sinograms were of
size 101 x 180 x 1.
The encoding portion of the network began with a
convolutional layer followed by a ReLu activation.
Next, a max-pooling layer contracted the data. This
was followed by two more convolutional + ReLu
layers. The data were then reshaped (flattened),
passed through two dense layers, and then was
reshaped into an 83 x 83 array. Lastly, the decoding
portion of the network was composed of four
convolutional + ReLu layers and one convolutional +
softmax layer. The output was an image of size 71 x
71 pixels. Due to the final layer of the network being
a softmax layer, each 2D activity image in the training
and test sets was normalized so that the total activity
per slice equaled 1.
Neural Network PET Reconstruction using Scattered Data in Energy-dependent Sinograms
37
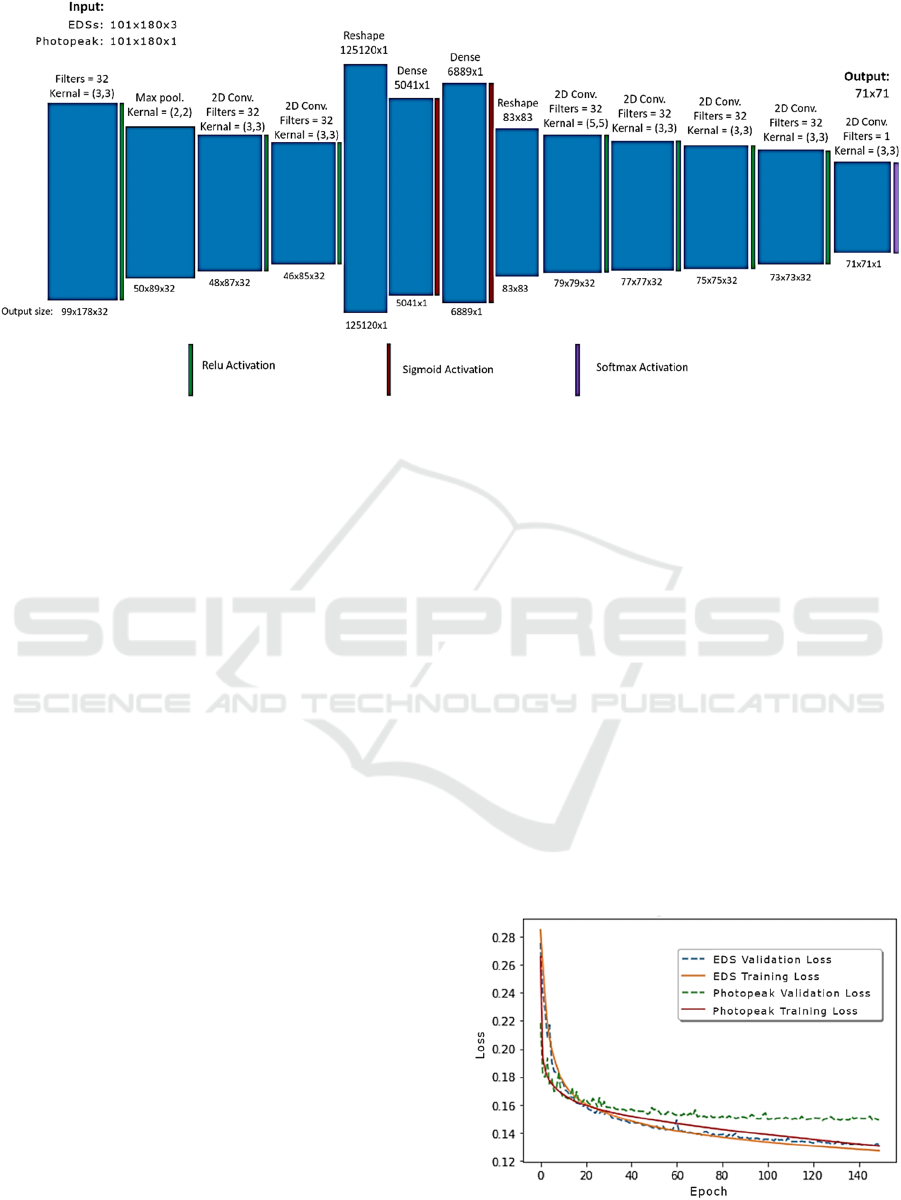
Figure 1: The network takes either energy-dependent sinograms (EDSs) or photopeak sinograms as input. The photopeak
sinograms are 2-D arrays composed of 101 x 108 elements. By contrast, the EDSs have a 3
rd
dimension which contains the
scattered coincidences, arranged according to the energy of the scattered component. Thus, the filter size of the first layer is
different depending upon the input type. Multiple convolutional layers, as well as dense layers in the middle of the network,
ensure that the receptive field for every pixel in the output image comprises the entire input sinogram. This guarantees that
the full scatter data is utilized.
For each 2-D activity image, two sinograms were
created: one energy-dependent, and one photopeak.
From the 210,000 image-sinogram pairs, 180,000
photopeak sinograms and their corresponding activity
distributions were used to train the photopeak
network. The same number of energy-dependent
sinograms (with the same 2-D activity distributions)
were used to train the EDS network. In each case, this
left 30,000 sinogram-image pairs for use as a
validation set. As the validation sets were not used to
tune network parameters, they also functioned as test
sets.
Each network was trained for 150 epochs. During
each epoch, the loss function of the training set and
validation set were computed (Fig 2). Three loss
functions were investigated for network training:
Kullback-Leibler (KL), mean squared error (MSE),
and Poisson. KL was chosen due to the superiority of
images generated; these had less noise than those
generated by a network trained with MSE and had
higher contrast.
Network weights were optimized with an Adam
optimizer using a learning rate equal to 10
-5
. Training
was implemented within Python using the
TensorFlow library.
2.4.1 Transfer Learning
Monte Carlo simulations limit the practical size of
training sets. We, therefore, investigated transfer
learning as a possible method to train the network
more thoroughly.
We began by training a network with sinograms
calculated analytically from the activity distributions
and subsequently corrupted by Poisson noise. The
first 8 layers of the model were then frozen, and the
remainder trained on Monte Carlo-derived data sets.
However, this network underperformed relative to
networks trained only on Monte Carlo data sets, even
though the latter had relatively few training examples.
The authors hypothesize that, as the analytic
sinograms did not include energy-dependent
components, initial network layers did not learn to
take full advantage of the sinogram data and
discarded the scattered components. If transfer
Figure 2: Training and validation losses for the EDS and
photopeak networks.
BIOIMAGING 2022 - 9th International Conference on Bioimaging
38
learning were to be performed in future efforts, the
3rd dimension of the analytically computed
sinograms should represent the energy-dependent
scatter component more accurately.
3 RESULTS
3.1 Network Performance
Once training of the EDS and photopeak networks
was completed, these were tested with separate sets
of 30,000 sinogram-image pairs. For comparison
purposes, reconstructions of the photopeak sinograms
were made using filtered back projection (FBP) and
maximum likelihood expectation maximization
(MLEM). The latter was terminated at 13 iterations.
No additional scatter corrections were performed on
the data before reconstruction. These, therefore, are
illustrative and should not be taken as examples of the
best possible analytic or algorithmic reconstructions.
Rather, the most relevant comparison is between the
EDS network and the photopeak network. Sample
image reconstructions using all four methods may be
found in Fig. 3.
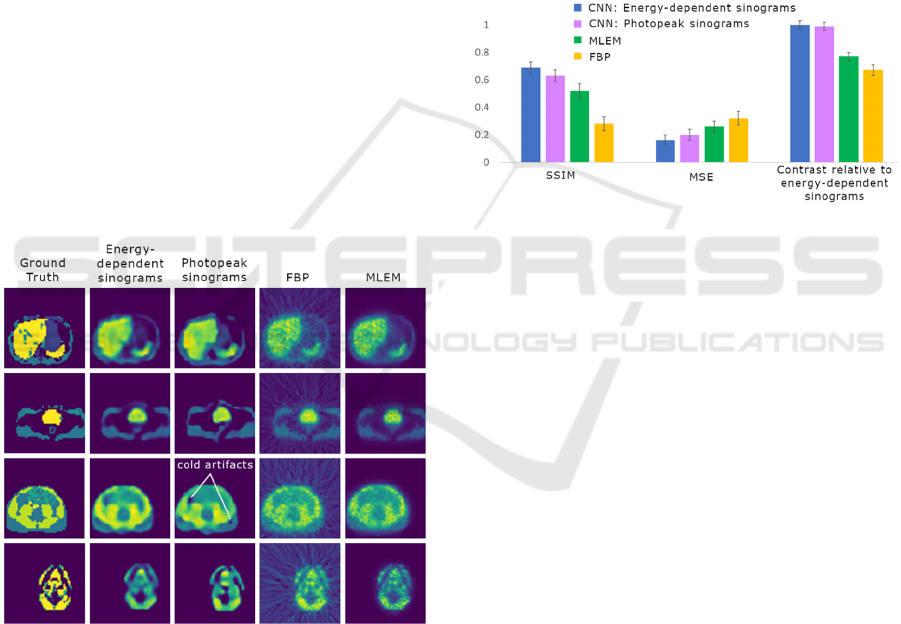
Figure 3: Images for each reconstruction method are shown;
note that the cold artifacts in images reconstructed from
photopeak sinograms are absent or attenuated in the images
reconstructed from EDSs.
The average mean squared error (MSE) and
structural similarity (SSIM) (Zhou Wang et al., 2004)
were determined from the validation set for each
reconstruction method, relative to the ground truth
images. Contrast values were also determined for all
four methods relative to the EDS-network. This was
done by averaging the intensity of a region of interest
of a hot spot feature (I
h
), as well as the background
area (I
b
). The contrast for a single image is then given
by: (I-I
b
)/I
b.
The average contrast value was computed for a
10-image subset for each reconstruction method.
Then the relative contrast values for the photopeak
network, MLEM and FBP were determined relative
to the EDS network. Figure 4 shows the image quality
metrics for each reconstruction method.
The computation times for each reconstruction
method were also determined. The CNN
reconstruction times were approximately 3 and 92
times faster than FBP and MLEM methods,
respectively.
Figure 4: Evaluation metrics are shown for the four
reconstruction methods employed. Of particular interest are
the metrics for the two CNNs. The network trained on
energy-dependent sinograms (EDSs) outperforms the
network trained on photopeak sinograms, as evidenced by
the structural similarity index metric (SSIM) and mean
square error (MSE). However, for both SSIM and MSE, the
difference between the metrics is less than the standard
deviation of the metric values for images generated by each
network; this is apparent from the error bars in the figure.
3.2 Discussion
For each image metric, the mean performance of the
EDS network exceeded that of the photopeak
network, though the difference was within the
uncertainty for all metrics. However, the uncertainties
are given by the standard deviation of the metric
values, and as each metric value depends on the
particular image considered, comparing differences
in the mean metric values with their uncertainties has
limited utility. For example, it may be possible that
every EDS network image has a higher SSIM than the
equivalent photopeak network image, and yet the
uncertainties may overlap. A more thorough analysis,
to be undertaken in future work, will examine this
problem in greater detail.
Differences in the quality of the reconstructed
images can also be observed by visual inspection.
Figure 3 depicts reconstructions of four different 2-D
Neural Network PET Reconstruction using Scattered Data in Energy-dependent Sinograms
39

activity distributions using the four reconstruction
methods. The photopeak network generates distinct
cold artifacts that are less visible or absent in the EDS
network images. Noise within constant-activity areas
is also higher in the photopeak network generated
images. Lastly, the contrast between proximal areas
with different activity levels appears higher in the
EDS network generated images. Both CNN-
reconstructed images share broad agreement with
images reconstructed via FBP and MLEM.
Learning curves for the two CNNs are displayed
in Fig. 3. The training and validation loss of the
photopeak network shows slight overfitting, whereas
the energy-dependent network does not. This may be
due to the training set for the EDS network containing
three times the amount of data as the training set for
the photopeak network, whereas the number of
weights—except for the first layer—was equal. This
indicates that the EDS network was appropriately
sized, given the size of its training set.
4 APPLICATIONS AND
IMPROVEMENTS
4.1 3D and Total-body PET
Improved image metrics demonstrate that including
the information contained in the scatter has the
potential to increase image quality, even with 15%
FWHM energy resolution detectors. Given this,
image reconstruction with data containing higher
scatter fractions, such as occurs with 3-D acquisition
or with large patients, is likely to benefit most.
However, 3-D PET rebinning approaches, such as the
Fourier rebinning algorithm (Defrise et al., 1997),
typically only consider true coincidences. To make
full use of scatter data, either fully 3-D reconstruction
must be pursued, or else rebinning algorithms must be
developed which accurately rebin scattered
coincidences. The former approach will require a
much larger CNN with many more weights, which
will require many more training examples. The
computational requirements for such an approach are
likely to be prohibitive. The authors believe the latter
approach to be more reasonable.
The highest scatter fractions occur with total-
body PET (TB-PET). Due to the increased sensitivity
possible with TB-PET, reducing injected activity by
a factor of 20 or more is attainable. However, if a CT
scan must be performed for the purpose of attenuation
correction, this offsets the benefit. Attenuation
corrected emission maps may be constructed with
deep learning methods, even in the absence of CT,
though this may be difficult using the sparse data
from low-dose scans (Meikle et al., 2021, p. 25). In
such cases, using scattered data for attenuation
correction and/or activity estimation looks promising,
especially as scatter fractions—and thus the
information contained in the scatter—are increased
for total-body PET.
4.2 Additional Data Types
If attenuation maps are available, these have the
potential to increase the utility of scatter imaging.
Photons are more likely to be scattered in volumes
with high electron density. Therefore, attenuation
maps contain statistical information about likely
scattering locations. The use of attenuation maps as
prior information for determining scatter locations
may therefore increase the available spatial
information scatter coincidences provide for
determining annihilation positions. Similarly, TOF
information also increases the spatial information that
can be gleaned from scattered coincidences, as
demonstrated by Conti et al. (Conti et al., 2012).
Therefore, networks that use attenuation or TOF data,
together with scatter data, seem promising.
4.3 Future Work
The current study focused on a single network. Future
work will explore various network configurations,
including CycleGan, which often outperforms Unet-
type architectures. In this network type, a cycle-
consistent loss is added, which penalizes projection
functions for not being injective (Wang et al., 2020).
Different binning schemes may also be compared.
Lastly, verification of the reconstruction method
using physical phantoms is necessary to guarantee
that the improvements seen in simulations translate to
real-world applications.
5 CONCLUSION
Two convolutional neural networks sharing the same
network architecture were trained and tested with two
different sets of data: one with coincidences where
both photons fell within a 511(±25) keV photopeak
window, and one which also included coincidences
where one of the photons had a lower detected
energy. The network trained with the energy-
dependent scatter sinograms was observed to have a
lower mean-square-error and larger structural
similarity index than the network trained with only
BIOIMAGING 2022 - 9th International Conference on Bioimaging
40

the photopeak sinograms. Images generated by the
photopeak network also contained more severe
artifacts.
These results suggest that including scattered
coincidences in the data has the potential to increase
image quality. The authors hypothesize that by
utilizing coincidences outside the photopeak energy
bin, the patient dose may be lowered while
maintaining the same image quality, thus improving
patient care.
ACKNOWLEDGEMENTS
This work is supported by the Natural Sciences and
Engineering Research Council of Canada,
CancerCare Manitoba Foundation, and the University
of Manitoba.
REFERENCES
Bai, B., & Asma, E. (2016). PET Image Reconstruction:
Methodology and Quantitative Accuracy. In M. M.
Khalil (Ed.), Basic Science of PET Imaging (pp. 259–
284). Springer International Publishing.
https://doi.org/10.1007/978-3-319-40070-9_11
Berker, Y., Kiessling, F., & Schulz, V. (2014). Scattered
PET data for attenuation‐map reconstruction in
PET/MRI. Medical Physics (Lancaster), 41(10),
102502-n/a. https://doi.org/10.1118/1.4894818
Brusaferri, L., Bousse, A., Emond, E. C., Brown, R., Tsai,
Y.-J., Atkinson, D., Ourselin, S., Watson, C. C., Hutton,
B. F., Arridge, S., & Thielemans, K. (2020). Joint
Activity and Attenuation Reconstruction From Multiple
Energy Window Data With Photopeak Scatter Re-
Estimation in Non-TOF 3-D PET. IEEE Transactions
on Radiation and Plasma Medical Sciences, 4(4), 410–
421. https://doi.org/10.1109/TRPMS.2020.2978449
Cherry, S. R. (2012). Physics in nuclear medicine (4th ed.).
Elsevier/Saunders.
Conti, M., Hong, I., & Michel, C. (2012). Reconstruction of
scattered and unscattered PET coincidences using TOF
and energy information. Physics in Medicine &
Biology, 57(15), N307–N317. https://doi.org/10.1088/
0031-9155/57/15/N307
Defrise, M., Kinahan, P. E., Townsend, D. W., Michel, C.,
Sibomana, M., & Newport, D. F. (1997). Exact and
approximate rebinning algorithms for 3-D PET data.
IEEE Transactions on Medical Imaging, 16(2), 145–
158. https://doi.org/10.1109/42.563660
Dong, X., Lei, Y., Wang, T., Higgins, K., Liu, T., Curran,
W. J., Mao, H., Nye, J. A., & Yang, X. (2020). Deep
learning-based attenuation correction in the absence of
structural information for whole-body positron
emission tomography imaging. Physics in Medicine &
Biology, 65(5), 055011–055011. https://doi.org/
10.1088/1361-6560/ab652c
Dong, X., Wang, T., Lei, Y., Higgins, K., Liu, T., Curran,
W. J., Mao, H., Nye, J. A., & Yang, X. (2019).
Synthetic CT generation from non-attenuation
corrected PET images for whole-body PET imaging.
Physics in Medicine & Biology, 64(21), 215016–
215016. https://doi.org/10.1088/1361-6560/ab4eb7
Häggström, I., Schmidtlein, C. R., Campanella, G., &
Fuchs, T. J. (2019). DeepPET: A deep encoder–decoder
network for directly solving the PET image
reconstruction inverse problem. Medical Image
Analysis, 54, 253–262. https://doi.org/10.1016/
j.media.2019.03.013
Jan, S., Santin, G., Strul, D., Staelens, S., Assié, K., Autret,
D., Avner, S., Barbier, R., Bardiès, M., Bloomfield, P.
M., Brasse, D., Breton, V., Bruyndonckx, P., Buvat, I.,
Chatziioannou, A. F., Choi, Y., Chung, Y. H., Comtat,
C., Donnarieix, D., Morel, C. (2004). GATE: A
simulation toolkit for PET and SPECT. Physics in
Medicine & Biology, 49(19), 4543–4561.
https://doi.org/10.1088/0031-9155/49/19/007
Lee, J. S. (2021). A Review of Deep-Learning-Based
Approaches for Attenuation Correction in Positron
Emission Tomography. IEEE Transactions on
Radiation and Plasma Medical Sciences, 5(2), 160–
184. https://doi.org/10.1109/TRPMS.2020.3009269
Liu, Z., Chen, H., & Liu, H. (2019). Deep Learning Based
Framework for Direct Reconstruction of PET Images.
In D. Shen, T. Liu, T. M. Peters, L. H. Staib, C. Essert,
S. Zhou, P.-T. Yap, & A. Khan (Eds.), Medical Image
Computing and Computer Assisted Intervention –
MICCAI 2019 (pp. 48–56). Springer International
Publishing. https://doi.org/10.1007/978-3-030-32248-
9_6
Meikle, S. R., Sossi, V., Roncali, E., Cherry, S. R., Banati,
R., Mankoff, D., Jones, T., James, M., Sutcliffe, J.,
Ouyang, J., Petibon, Y., Ma, C., Fakhri, G. E., Surti, S.,
Karp, J. S., Badawi, R. D., Yamaya, T., Akamatsu, G.,
Schramm, G., … Dutta, J. (2021). Quantitative PET in
the 2020s: A roadmap. Physics in Medicine & Biology,
66(6), 06RM01. https://doi.org/10.1088/1361-6560/
abd4f7
Segars, W. P., Sturgeon, G., Mendonca, S., Grimes, J., &
Tsui, B. M. W. (2010). 4D XCAT phantom for
multimodality imaging research. Medical Physics
(Lancaster), 37(9), 4902–4915. https://doi.org/
10.1118/1.3480985
Shiri, I., Ghafarian, P., Geramifar, P., Leung, K. H.-Y.,
Ghelichoghli, M., Oveisi, M., Rahmim, A., & Ay,
M. R. (2019). Direct attenuation correction of brain
PET images using only emission data via a
deep convolutional encoder-decoder (Deep-DAC).
European Radiology, 29(12), 6867–6879.
https://doi.org/10.1007/s00330-019-06229-1
Song, T.-A., Chowdhury, S. R., Yang, F., & Dutta, J.
(2020). PET image super-resolution using generative
adversarial networks. Neural Networks, 125, 83–91.
https://doi.org/10.1016/j.neunet.2020.01.029
Neural Network PET Reconstruction using Scattered Data in Energy-dependent Sinograms
41

Sun, H. (2016). An improved positron emission tomography
(PET) reconstruction of 2D activity distribution using
higher order scattered data [Masters]. University of
Manitoba.
Sun, H., & Pistorius, S. (2013a). Evaluation of the
Feasibility and Quantitative Accuracy of a Generalized
Scatter 2D PET Reconstruction Method. ISRN
Biomedical Imaging, 2013, 1–11. https://doi.org/
10.1155/2013/943051
Sun, H., & Pistorius, S. (2013b). Evaluation of Image
Quality Improvements When Adding Patient Outline
Constraints into a Generalized Scatter PET
Reconstruction Algorithm. ISRN Biomedical Imaging,
2013, 1–8. https://doi.org/10.1155/2013/326847
Sun, H., Teimoorisichani, M., McIntosh, B., Zhang, G.,
Ingleby, H., Goertzen, A., & Pistorius, S. (2015).
Simultaneous estimation of the radioactivity
distribution and electron density map from scattered
coincidences in PET: A project overview. In D. A.
Jaffray (Ed.), World Congress on Medical Physics and
Biomedical Engineering, June 7-12, 2015, Toronto,
Canada (pp. 150–153). Springer International
Publishing. https://doi.org/10.1007/978-3-319-19387-
8_36
Tian, C., Xu, Y., Fei, L., & Yan, K. (2019). Deep Learning
for Image Denoising: A Survey. In Genetic and
Evolutionary Computing (pp. 563–572). Springer
Singapore. Https://arxiv.org/abs/1810.05052
Tong, S., Alessio, A. M., & Kinahan, P. E. (2010). Noise
and signal properties in PSF-based fully 3D PET image
reconstruction: An experimental evaluation. Physics in
Medicine & Biology, 55(5), 1453–1473.
https://doi.org/10.1088/0031-9155/55/5/013
Wang, T., Lei, Y., Fu, Y., Curran, W. J., Liu, T., & Yang,
X. (2020). Machine Learning in Quantitative PET
Imaging. https://arxiv.org/abs/2001.06597
Whiteley, W., Luk, W. K., & Gregor, J. (2020). DirectPET:
Full-size neural network PET reconstruction from
sinogram data. Journal of Medical Imaging, 7(3).
https://doi.org/10.1117/1.JMI.7.3.032503
Zhou Wang, Bovik, A. C., Sheikh, H. R., & Simoncelli, E.
P. (2004). Image quality assessment: From error
visibility to structural similarity. IEEE Transactions on
Image Processing, 13(4), 600–612. https://doi.org/
10.1109/TIP.2003.819861
Zhu, B., Liu, J. Z., Cauley, S. F., Rosen, B. R., & Rosen,
M. S. (2018). Image reconstruction by domain-
transform manifold learning. Nature (London),
555(7697), 487–492. https://doi.org/10.1038/nature25
988
BIOIMAGING 2022 - 9th International Conference on Bioimaging
42
