
ERQA: Edge-restoration Quality Assessment for Video Super-Resolution
Anastasia Kirillova
a
, Eugene Lyapustin
b
, Anastasia Antsiferova
c
and Dmitry Vatolin
d
Lomonosov Moscow State University, Moscow, Russia
Keywords:
Video Super-Resolution, Quality Assessment, Video Restoration.
Abstract:
Despite the growing popularity of video super-resolution (VSR), there is still no good way to assess the quality
of the restored details in upscaled frames. Some VSR methods may produce the wrong digit or an entirely
different face. Whether a method’s results are trustworthy depends on how well it restores truthful details.
Image super-resolution can use natural distributions to produce a high-resolution image that is only somewhat
similar to the real one. VSR enables exploration of additional information in neighboring frames to restore
details from the original scene. The ERQA metric, which we propose in this paper, aims to estimate a model’s
ability to restore real details using VSR. On the assumption that edges are significant for detail and character
recognition, we chose edge fidelity as the foundation for this metric. Experimental validation of our work is
based on the MSU Video Super-Resolution Benchmark, which includes the most difficult patterns for detail
restoration and verifies the fidelity of details from the original frame. Code for the proposed metric is publicly
available at https://github.com/msu-video-group/ERQA.
1 INTRODUCTION
As a fundamental image- and video-processing task,
super-resolution remains a popular research topic.
It has a wide range of applications, from low-
complexity encoding
1
to old-film restoration and
medical-image enhancement. Trends in quality as-
sessment of upscaled videos and images are favoring
estimation of statistical naturalness in combination
with fidelity. But restoration fidelity is much more
important than statistical naturalness for some tasks:
small-object recognition (e.g., license-plate numbers)
in CCTV recordings, text recognition, and medical-
image reconstruction.
With the development of deep-learning-based ap-
proaches, many super-resolution models produce vi-
sually natural frames but lose important details. For
example, the rightmost image in Figure 2, upscaled by
TDAN (Tian et al., 2020), is perceptually better than
the leftmost one, upscaled by RRN-10L (Isobe et al.,
2020), but the shape of the shiny thread in the left-
most image is closer to ground truth (GT, center). Oc-
casionally, such models can even change the context
a
https://orcid.org/0000-0002-0799-3135
b
https://orcid.org/0000-0002-2515-9478
c
https://orcid.org/0000-0002-1272-5135
d
https://orcid.org/0000-0002-8893-9340
1
https://www.lcevc.org/
Figure 1: Example of changing context in an upscaled
video: two characters from source frame (GT, leftmost) mix
to yield a new one during video upscaling.
Figure 2: Example of upscaled images that vary in detail-
restoration quality. The rightmost image is visually more
natural, but the shape of the details in the leftmost image is
closer to the original.
in an image by, for example, producing an incorrect
number, character, or even human face without de-
creasing traditional-metric values. In Figure 1, Real-
ESRGAN (Wang et al., 2021) mixed two letters from
low-resolution images to form a completely different
letter (center). In Figure 4, RPBN (Haris et al., 2019)
added horizontal lines to the bottom-right character,
but all three models score the same on traditional met-
Kirillova, A., Lyapustin, E., Antsiferova, A. and Vatolin, D.
ERQA: Edge-restoration Quality Assessment for Video Super-Resolution.
DOI: 10.5220/0010780900003124
In Proceedings of the 17th International Joint Conference on Computer Vision, Imaging and Computer Graphics Theory and Applications (VISIGRAPP 2022) - Volume 4: VISAPP, pages
315-322
ISBN: 978-989-758-555-5; ISSN: 2184-4321
Copyright
c
2022 by SCITEPRESS – Science and Technology Publications, Lda. All rights reserved
315
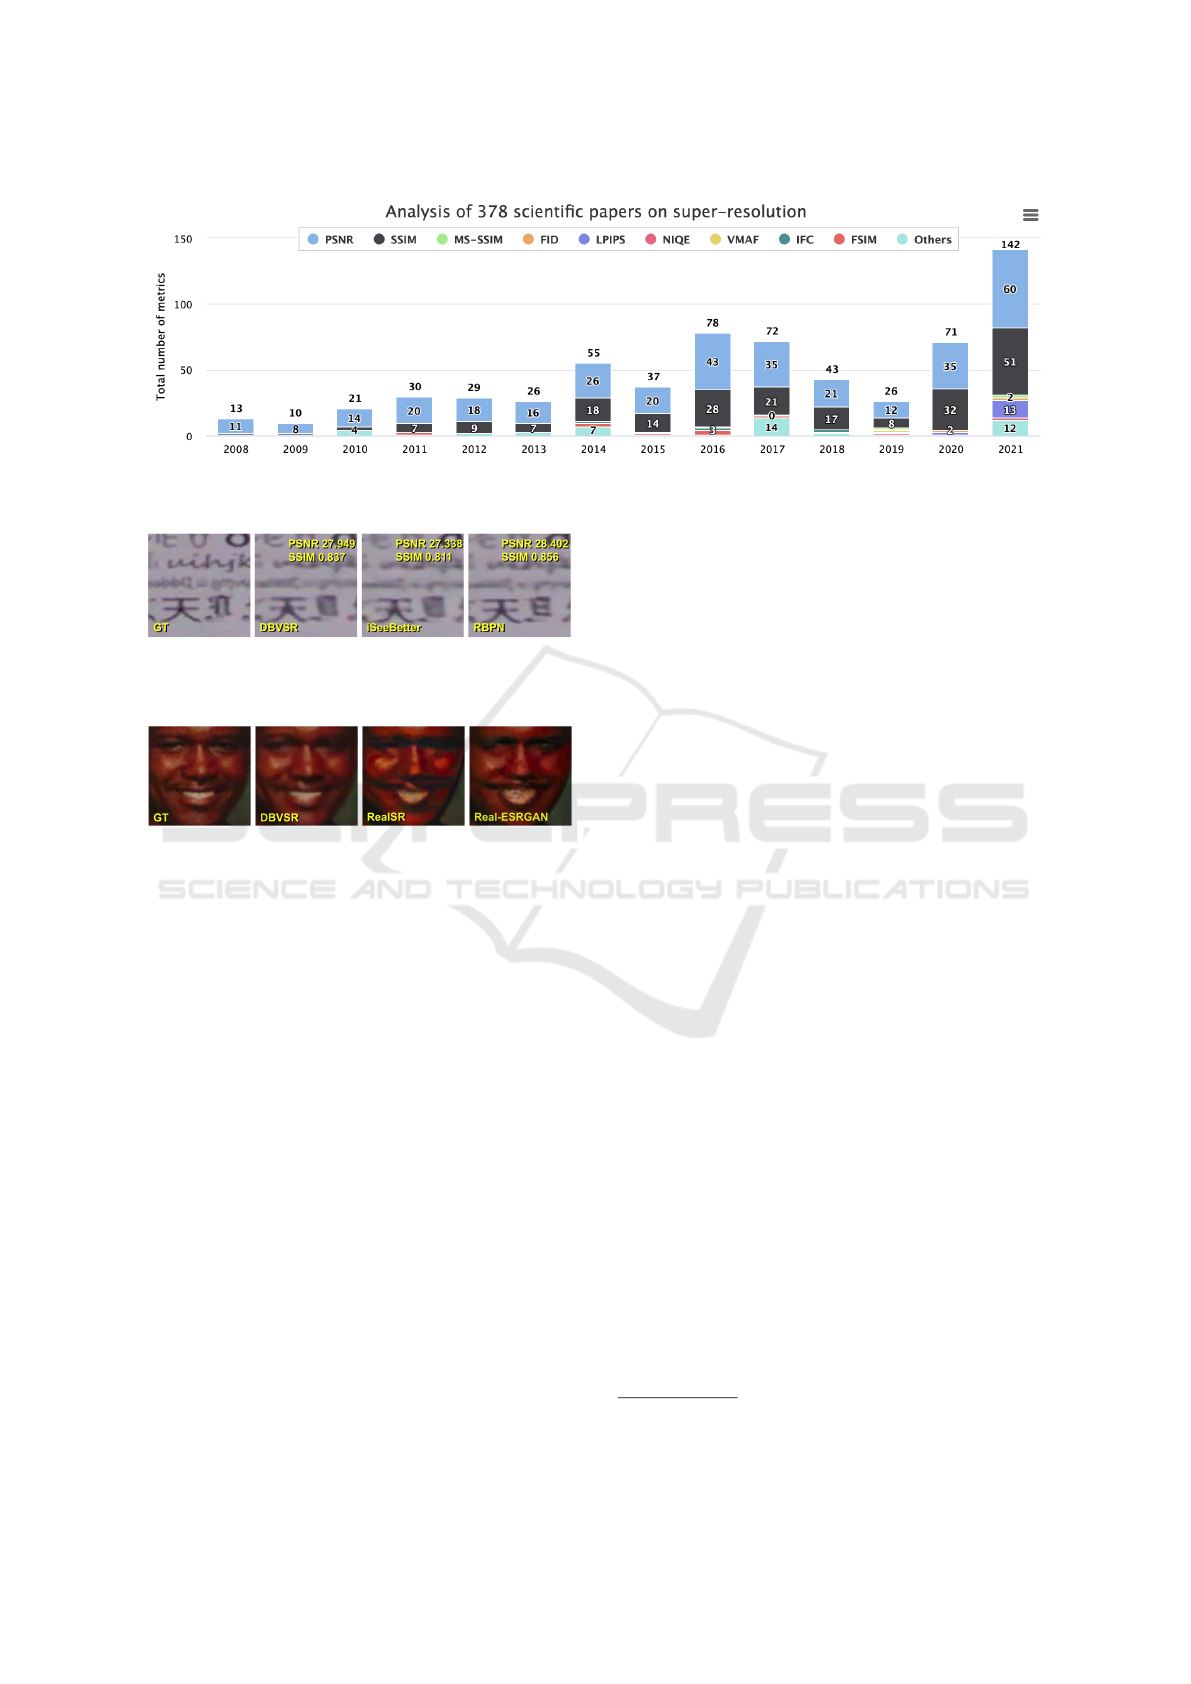
Figure 3: Metrics for estimating super-resolution quality cited in papers proposing new methods, by year. PSNR and SSIM
(Wang et al., 2004) are the most popular; LPIPS (Zhang et al., 2018) saw wide use in 2020 and 2021.
Figure 4: Example of changing context in an upscaled
video: RBPN (Haris et al., 2019) has changed a character
in the rightmost image.
Figure 5: Example of changing context in an upscaled
video: unnatural faces are the result here, differing consid-
erably from the source one (GT, leftmost).
rics. In Figure 5, Real-ESRGAN (Wang et al., 2021)
and RealSR (Ji et al., 2020) produced unnatural faces
that greatly differ from the source one.
The examples in Figures 1–2, 4–5 demonstrate
that assessment of detail-restoration quality for image
and video super-resolution is difficult. The best way
to estimate restoration fidelity is to conduct a subjec-
tive comparison; it’s the most precise approach but is
time consuming and expensive. Another way involves
reference quality metrics. Traditional similarity met-
rics such as PSNR and SSIM (Wang et al., 2004) are
often used to evaluate super-resolution models, but
they yield poor results and are unstable when deal-
ing with shifts and other common super-resolution ar-
tifacts. LPIPS (Zhang et al., 2018) is increasingly
popular for this task, but it originally aimed to as-
sess perceptual similarity rather than fidelity. The new
DISTS (Ding et al., 2020a) metric is an improvement
on LPIPS, but it also focuses on perceptual similarity.
Our research focuses on analyzing super-
resolution algorithms, particularly their restoration
fidelity. When we started working on a benchmark
for video super-resolution
2
, including a test for
restoration-quality assessment, we discovered that
existing metrics work fine for other tests (restoration
naturalness and beauty) but have a low correlation
with subjective detail-quality estimation. In this
paper, therefore, we introduce a new method for
evaluating information fidelity. Experiments reveal
that our metric outperforms other super-resolution
quality metrics in assessing detail restoration.
The main contributions of our work are the fol-
lowing:
1. A video-super-resolution benchmark based on a
new dataset containing the most difficult patterns
for detail restoration.
2. A subjective comparison examining the fidelity of
details from the original frame, instead of tradi-
tional statistical naturalness and beauty.
3. A new metric for assessing the detail-restoration
quality of video super-resolution.
2 RELATED WORK
PSNR and SSIM (Wang et al., 2004) are common
metrics for assessing super-resolution quality. We an-
alyzed 378 papers that propose super-resolution meth-
ods and found that since 2008, PSNR and SSIM have
remained the most popular metrics. But both have
been shown to exhibit a low correlation with subjec-
tive scores. LPIPS (Zhang et al., 2018) has grown in
popularity over the last two years; other metrics re-
main less popular (Figure 3).
Several full-reference metrics for assessing super-
resolution visual quality have emerged. (Wan et al.,
2018) used four features (gradient magnitude, phase
congruency, anisotropy, and directionality complex-
2
https://videoprocessing.ai/benchmarks/video-super-
resolution.html
VISAPP 2022 - 17th International Conference on Computer Vision Theory and Applications
316

Table 1: A comparison of datasets using for testing super-resolution quality assessment approaches.
Dataset # references # SR images # SR algorithms Subjective type
C. Ma et al.’s (Ma et al., 2017) 30 1620 9 MOS
QADS (Zhou et al., 2019) 20 980 21 Pairwise comparison
SupER (K
¨
ohler et al., 2019) 14 3024 20 Pairwise comparison
SRIJ (Beron et al., 2020) 32 608 7 MOS
SISRSet (Shi et al., 2019) 15 360 8 MOS
ECCV (Yang et al., 2014) 10 540 6 MOS
SRID (Wang et al., 2017) 20 480 8 MOS
ity) to calculate the perceptual structure measure-
ment (PFSM) in both the upscaled and original high-
resolution frames. Similarity function applied to PF-
SMs showed more-consistent results than previous
approaches with regard to visual perception on their
dataset. (Zhou et al., 2021) calculated structural fi-
delity and statistical naturalness, fused these coeffi-
cients into a weighted sum, and achieved good cor-
relation on the QADS image database(Zhou et al.,
2019).
Another popular approach is to extract structure or
texture features from LR and upscaled (SR) images,
compare them separately, and fuse the resulting simi-
larity indices (Yeganeh et al., 2015; Fang et al., 2019).
Metrics based on this idea achieve a Spearman rank
correlation coefficient (SRCC) coefficient of 0.69 to
0.85 on various datasets. (Yang et al., 2019) trained
a regression model using statistical features extracted
from LR and SR images, obtaining a correlation simi-
lar to that of other top metrics on the dataset from (Ma
et al., 2017). (Shi et al., 2019) proposed another ap-
proach for reduced-reference assessment that uses the
visual-content-prediction model to measure the struc-
ture of the reference and SR images. This method out-
performs previous ones on the SISRSet dataset (Shi
et al., 2019).
A number of no-reference metrics are also used
for video super-resolution. (Ma et al., 2017) trains
regression models on statistical features extracted
from upscaled frames, achieving high value of SRCC
on their dataset. (Zhang et al., 2021) proposed a
no-reference metric, based on features extracted us-
ing a pretrained neural network—VGGNet. (Wang
et al., 2018) trained SVM using extracted features
and obtained results similar to those of other met-
rics. (Greeshma and Bindu, 2020) proposed the
SRQC metric, which estimates structure changes and
quality-aware features. This metric exhibits good re-
sults, but they consider only a few images and four
SR methods for the test dataset.
Edges have a strong influence on the human vi-
sual system. Furthermore, edge fidelity is a base cri-
terion for assessing detail-restoration quality. Sev-
eral methods thus consider edge features as the ba-
sis for quality assessment. Some calculate edge fea-
tures, including number, length, direction, strength,
contrast, and width, and compare them using the sim-
ilarity measure to estimate image or video quality (At-
tar et al., 2016; Ni et al., 2017). Nevertheless, these
metrics achieve on their datasets almost the same cor-
relation as traditional PSNR and SSIM. In (Xue and
Mou, 2011), the authors detected edges in both ref-
erence and distorted images and compared them by
calculating recall. (Chen et al., 2011) used histogram
analysis for edge comparison. These metrics deliver
a slightly greater correlation than PSNR and SSIM.
Liu et al. (Liu et al., 2019) proposed using the F1
score to evaluate edge fidelity, but they declined to
conduct a comparison with other metrics and kept
their code under wraps. Our method is based on the
same edge-comparison idea, but it’s robust for small
local and global edge shifts, which appear during
super-resolution but are unessential for detail recogni-
tion. It yielded much better results than other quality-
assessment approaches.
A number of datasets are used for testing super-
resolution quality assessment (Table 1), but not for
detail restoration, because they lack difficult patterns
for that task as in Figure 6 (text, numbers, QR codes,
faces, complex textures). Therefore, we built a dataset
for assessing super-resolution quality that includes the
most challenging content for detail restoration.
Summarizing the above analysis, few metrics
aim to assess and compare detail-restoration quality.
Some that use edge features have emerged, but no one
uses them for super-resolution, which involves pecu-
liar artifacts. Therefore, it’s important to obtain an
objective metric that correlates highly with human es-
timation of detail-restoration quality and that allows
comparison of super-resolution models, not only for
naturalness but also for information fidelity.
ERQA: Edge-restoration Quality Assessment for Video Super-Resolution
317

3 PROPOSED METHOD
3.1 Dataset
To analyze a VSR model’s ability to restore real de-
tails, we built a test stand containing patterns that are
difficult for video restoration (Figure 6).
To calculate metrics for particular content types
and to verify how a model works with different inputs,
we divide each output frame into parts by detecting
crosses:
Part 1. “Board” includes a few small objects and pho-
tos of human faces
3
. Our goal is to obtain re-
sults for the model operating on textures with
small details. The striped fabric and balls of
yarn may produce a Moire pattern (Figure 7).
Restoration of human faces is important for
video surveillance.
Part 2. “QR” comprises multiple QR codes of differ-
ing sizes; the aim is to find the size of the
smallest recognizable one in the model’s out-
put frame. A low-resolution frame may blend
QR-code patterns, so models may have diffi-
culty restoring them.
Part 3. “Text” includes two kinds: handwritten and
typed. Packing all these difficult elements into
the training dataset is a challenge, so they are
each new to the model as it attempts to restore
them.
Part 4. “Metal paper” contains foil that was vigor-
ously crumpled. It’s an interesting example
because of the reflections, which change peri-
odically between frames.
Part 5. “Color lines” is a printed image with numer-
ous thin color stripes. This image is diffi-
cult because thin lines of similar colors end
up mixing in low-resolution frames.
Part 6. “License-plate numbers” consists of a set of
car license plates of varying sizes from differ-
ent countries
4
. This content is important for
video surveillance and dashcam development.
Part 7. “Noise” includes difficult noise patterns.
Models cannot restore real ground-truth
noise, and each one produces a unique pattern.
Part 8. “Mira” contains a resolution test chart with
patterns that are difficult to restore: a set of
straight and curved lines of differing thick-
nesses and directions.
3
Photos were generated by https://
thispersondoesnotexist.com/
4
The license-plate numbers are generated randomly and
printed on paper.
Figure 6: Test stand for the proposed VSR benchmark. The
size of the stand 3, 456 × 3, 456 pixels in a source video and
1, 280 × 1, 280 pixels in a ground truth video.
Figure 7: Example of a Moire pattern on the “Board.” There
is a zoomed result on the right.
We captured the dataset using a Canon EOS 7D
camera. We quickly took a series of 100 photos and
used them as a video sequence. The shots were from
a fixed point without a tripod, so the video contains
a small amount of random motion. We stored the
video as a sequence of frames in PNG format, con-
verted from JPG. The camera’s settings were ISO
4000, aperture 400, and resolution 5184 × 3456.
The source video also has a resolution of 5184 ×
3456 and was stored in the sRGB color space. We
degraded it using bicubic interpolation to generate a
ground truth of resolution 1920 × 1280. This step is
essential because many open-source models lack the
code to process a large frame; processing large frames
is also time consuming. We further degraded the input
video from ground truth, again using bicubic interpo-
lation, to 480 × 320 to test the models for 4× upscal-
ing. The output of each model is also a sequence of
frames, which we compare with the ground-truth se-
quence to verify the model’s performance.
VISAPP 2022 - 17th International Conference on Computer Vision Theory and Applications
318

3.2 Subjective Comparison
We used 21 super-resolution algorithms in our quality
assessment. We also added a ground-truth video, so
the experimental validation involves 22 videos. We
cut the sequences to 30 frames and converted them
to 8 frames per second (fps). This length allows sub-
jects to easily consider details and decide which video
is better. We then cropped from each video 10 snip-
pets that cover the most difficult patterns for restora-
tion and conducted a side-by-side pairwise subjective
evaluation using the Subjectify.us service, which en-
ables crowd-sourced comparisons.
To estimate information fidelity, we asked partici-
pants in the subjective comparison to avoid choosing
the most beautiful video, but instead choose the one
that shows better detail restoration. Participants are
not experts in this field thus they do not have profes-
sional biases. Each participant was shown 25 paired
videos and in each case had to choose the best video
(“indistinguishable” was also an option). Each pair of
snippets was shown to 10-15 participants until con-
fidence interval stops changing. Three of pairs for
each participant are for verification, so the final re-
sults exclude their answers. All other responses from
1400 successful participants are used to predict sub-
jective scores using the Bradley-Terry (Bradley and
Terry, 1952).
3.3 Edge Restoration Quality
Assessment Method
On the basis of the hypothesis that edges are signif-
icant for detail restoration, we developed the edge-
restoration quality assessment (ERQA) metric, which
estimates how well a model can restore edges in a
high-resolution frame. Our metric compensates for
small global and local edge shifts, assuming they
don’t complicate detail recognition.
Figure 8: The content part ”Board” cropped from a GT
frame (left) along with edges of this frame highlighted with
the Canny algorithm (Canny, 1986) with chosen parameters
(right).
First, we find edges in both the output and ground-
truth frames. Our approach uses an OpenCV imple-
Figure 9: Crop from an upscaled frame (left), crop from
the source frame (right) and visualization of ERQA metric
(center). White = true positive, blue = false negative, red =
false positive.
mentation
5
of the Canny algorithm (Canny, 1986).
The threshold for initially identifying strong edges is
200, and the threshold for linking edges is 100. These
coefficients allow us to highlight the edges of all ob-
jects, even small ones, while skipping lines, which are
unimportant (Figure 8).
Having found the edges in the ground-truth and
distorted frames as binary masks, we compare them
using the F1 score:
precision =
T P
T P + FP
, recall =
T P
T P + FN
, (1)
F
1
= 2
precision · recall
precision + recall
, (2)
where TP (True Positive) is a number of pixels de-
tected as edge in both ground-truth and distorted
frames, FP (False Positive) is a number of pixels de-
tected as edges only in distorted frame, FN (False
Negative) is a number of pixels detected as edges only
in ground-truth frame (Figure 9).
Some models can generate frames with a global
pixel shift relative to ground truth, so we checked the
integer pixel shifts [−3, 3] along both axes and chose
the one with the maximum PSNR value. Compensat-
ing for this global shift aids our metric considerably
(Table 4).
During an upscaling, models may also shift edge
pixels locally, which in many cases is insignificant to
human perception of information. To compensate for
local single-pixel edge shifts, we consider as true pos-
itive any pixels on the output edges, which are not on
the ground-truth edges but are near (on the difference
of one pixel) with the edge of GT.
We then noticed that some models produce a
wider edge compared with the ground truth, and our
method with local compensation (ERQAv1.0) marks
these edges as fully true positive. To correct this
shortcoming, ERQAv1.1 considers each point on a
ground-truth edge as corresponding to true positive
only once. The overall pipeline of Edge Restoration
Quality Assessment method:
5
https://docs.opencv.org/3.4/dd/d1a/group imgproc
feature.html#ga04723e007ed888ddf11d9ba04e2232de
ERQA: Edge-restoration Quality Assessment for Video Super-Resolution
319

Edge Restoration Quality Assessment pipeline
Input: GT, image
Algorithm: shifted img = global compensation
(GT, image)
GT edge = Canny(GT)
edge = Canny(shifted img)
TP, FP, FN = local compensation
(GT edge, edge)
Output: ERQA = F1 score(TP, FP, FN)
4 EXPERIMENTAL VALIDATION
4.1 Ablation Study
To verify the significance of the global- and local-
shift compensation, we conducted a basic edge com-
parison without compensation, with only global com-
pensation, with both global and local compensation
(v1.0), and with penalization of wide edges (v1.1).
All consistently increased both the PLCC and SRCC
(Table 4).
We also tried our compensation scheme with
Sobel, Robert(Roberts, 1963), and Prewitt(Prewitt,
1970) operators. Although there are some exceptions,
in general ERQA shows a better correlation when us-
ing the Canny operator. Different thresholds for the
Canny algorithm give metrics with high correlation
with each other. Thus to avoid overfitting we empir-
ically chose the theresholds 100 and 200 to highlight
only important edges.
We also verified our metric on the QADS dataset
(Zhou et al., 2019). Although the mean correlation
is lower than that of a few other metrics, the reason
is that this dataset was developed for another test case
(visual perception). In some situations, an image with
lower visual perception looks more like the original
one than does an image with higher visual perception.
At the same time, working with images closer to our
test-case ERQA yields good results.
4.2 Comparison with Other Metrics
We conducted a study of existing metrics for video-
quality assessment and found that some work well
for naturalness and beauty, but none works well for
restoration. We calculated several well-known met-
rics on a new dataset: PSNR, SSIM (Wang et al.,
2004), MS-SSIM (Wang et al., 2003), VMAF
6
, the
recently developed LPIPS (Zhang et al., 2018), which
6
https://github.com/Netflix/vmaf
showed good results when assessing super-resolution
imaging, its improvement DISTS (Ding et al., 2020b)
and metric for SR assessment (Ma et al., 2017).
Our metric outperforms all others in both the PLCC
and SRCC. LPIPS places second. A popular met-
ric for video-quality assessment, VMAF, exhibits
poor results even compared with the traditional SSIM
for this case. Multiscale structural similarity (MS-
SSIM), which usually delivers better results than sim-
ple structural similarity (SSIM), ranked last on super-
resolution.
We tried our global-shift-compensation scheme in
an attempt to improve the performance of these met-
rics. Nearly all metrics (except VMAF) were better
as a result (Table 3).
Because metrics can work differently on different
content types, we separately considered the correla-
tion of metric values with subjective assessment on
all crops and then calculated the mean correlation.
Despite its simple and straightforward construction,
ERQA delivers more-consistent results with subjec-
tive assessment and outperforms all other metrics in
both the PLCC and SRCC (Table 2) coefficients when
assessing information fidelity.
5 CONCLUSION AND FUTURE
WORK
In this paper, we proposed a new full-reference ERQA
metric for assessing detail restoration by video super-
resolution. It compares edges in reference and target
videos to analyze how well a VSR model restores the
source structure and details. We also created a spe-
cial dataset for assessing VSR quality and used it to
analyze our metric through subjective comparisons.
ERQA shows a high correlation with human detail
perception and overall better results than traditional
as well as state-of-the-art VQA methods. It approved
that edge restoration are significant for human percep-
tion of detail restoration. The concept underlying our
metric allows it to serve for similar restoration tasks,
such as deblurring, deinterlacing, and denoising.
ACKNOWLEDGEMENTS
Dataset preparation and subjective comparison were
supported by Russian Foundation for Basic Re-
search under Grant 19-01-00785 a. Metric devel-
opment was supported by Foundation for Assistance
to Small Innovative Enterprises under Grant UMNIK
16310GU/2021. Anastasia Antsiferova and Eugene
VISAPP 2022 - 17th International Conference on Computer Vision Theory and Applications
320

Table 2: Spearman rank correlation coefficient (SRCC) of metrics with subjective assessment on all test cases. Metrics
calculated on each test case compared with subjective score on the same test case. Mean value of correlation coefficients is
also presented.
Metric Lego Toy Faces Yarn QRs Text-1 Text-2 Car-1 Car-2 Mira Mean
ERQAv1.0 0.87 0.72 0.85 0.85 0.66 0.85 0.89 0.86 0.79 0.38 0.77
ERQAv1.1 0.87 0.66 0.89 0.84 0.65 0.85 0.91 0.92 0.88 0.41 0.79
SSIM* 0.68 0.20 0.81 0.33 0.52 0.57 0.63 0.86 0.86 0.29 0.58
PSNR* 0.36 -0.05 0.66 0.14 0.40 0.40 0.54 0.82 0.72 0.06 0.41
LPIPS 0.70 0.79 0.52 0.79 0.68 0.88 0.63 0.67 0.67 0.75 0.71
LPIPS* 0.78 0.81 0.56 0.84 0.69 0.88 0.65 0.72 0.71 0.75 0.74
DISTS 0.6 0.35 0.69 0.65 0.54 0.84 0.79 0.74 0.72 0.58 0.65
DISTS* 0.6 0.35 0.72 0.71 0.58 0.86 0.88 0.87 0.81 0.56 0.694
MS-SSIM 0.38 0.30 0.59 0.20 0.32 0.48 0.47 0.56 0.59 0.39 0.43
MS-SSIM* 0.77 0.19 0.68 0.35 0.48 0.53 0.6 0.82 0.81 0.25 0.55
VMAF 0.36 0.35 0.61 0.33 0.36 0.52 0.53 0.55 0.60 0.48 0.47
VMAF* 0.33 0.36 0.57 0.38 0.34 0.52 0.48 0.56 0.58 0.47 0.46
VMAF (clip) 0.36 0.35 0.60 0.33 0.36 0.52 0.53 0.55 0.59 0.49 0.47
VMAF (clip)* 0.33 0.36 0.56 0.38 0.34 0.52 0.48 0.56 0.57 0.47 0.46
Ma et al. 0.47 0.88 -0.28 0.62 0.71 — — — — — 0.48
Table 3: Performance comparison of all metrics with and without global compensation shifts.
Metric
Without compensation With global pixel shift compensation
PLCC SRCC PLCC SRCC
LPIPS 0.8103 0.7077 0.8352 (+0.0249) 0.7377 (+0.0300)
DISTS 0.8094 0.6513 0.8278 (+0.0184) 0.6931 (+0.0418)
MS-SSIM 0.2796 0.4282 0.5992 (+0.3196) 0.5484 (+0.1202)
VMAF 0.2998 0.4692 0.2644 (-0.0354) 0.4572 (-0.012)
VMAF(not clipped) 0.3428 0.4706 0.2999 (-0.0429) 0.4586 (-0.012)
Table 4: An ablation study of the proposed method.
Stage PLCC SRCC
Without compensation (baseline) 0.5035 0.4745
+ Compensation of global shift 0.7395 (+0.2360) 0.6342 (+0.1597)
+ Compensation of local shift (v1.0) 0.8243 (+0.0848) 0.7383 (+0.1041)
+ Penalize false wide edges (v1.1) 0.8316 (+0.0540) 0.7519 (+0.0486)
Lyapustin were supported by the Fellowship from
Non-commercial Foundation for the Advancement of
Science and Education INTELLECT.
REFERENCES
Attar, A., Shahbahrami, A., and Rad, R. M. (2016). Image
quality assessment using edge based features. Multi-
media Tools and Applications, 75(12):7407–7422.
Beron, J., Benitez-Restrepo, H. D., and Bovik, A. C. (2020).
Blind image quality assessment for super resolution
via optimal feature selection. IEEE Access, 8:143201–
143218.
Bradley, R. A. and Terry, M. E. (1952). Rank analysis of in-
complete block designs: I. the method of paired com-
parisons. Biometrika, 39(3/4):324–345.
Canny, J. (1986). A computational approach to edge de-
tection. IEEE Transactions on Pattern Analysis and
Machine Intelligence, PAMI-8(6):679–698.
Chen, X., Zhang, R., and Zheng, S. (2011). Image quality
assessment based on local edge direction histogram.
In 2011 International Conference on Image Analysis
and Signal Processing, pages 108–112. IEEE.
Ding, K., Ma, K., Wang, S., and Simoncelli, E. P. (2020a).
Image quality assessment: Unifying structure and tex-
ture similarity. arXiv preprint arXiv:2004.07728.
Ding, K., Ma, K., Wang, S., and Simoncelli, E. P. (2020b).
Image quality assessment: Unifying structure and tex-
ture similarity. CoRR, abs/2004.07728.
Fang, Y., Liu, J., Zhang, Y., Lin, W., and Guo, Z. (2019).
Reduced-reference quality assessment of image super-
resolution by energy change and texture variation.
Journal of Visual Communication and Image Repre-
sentation, 60:140–148.
Greeshma, M. and Bindu, V. (2020). Super-resolution qual-
ERQA: Edge-restoration Quality Assessment for Video Super-Resolution
321

ity criterion (srqc): a super-resolution image quality
assessment metric. Multimedia Tools and Applica-
tions, 79(47):35125–35146.
Haris, M., Shakhnarovich, G., and Ukita, N. (2019).
Recurrent back-projection network for video super-
resolution. In Proceedings of the IEEE/CVF Con-
ference on Computer Vision and Pattern Recognition,
pages 3897–3906.
Isobe, T., Zhu, F., Jia, X., and Wang, S. (2020). Revisiting
temporal modeling for video super-resolution. arXiv
preprint arXiv:2008.05765.
Ji, X., Cao, Y., Tai, Y., Wang, C., Li, J., and Huang, F.
(2020). Real-world super-resolution via kernel esti-
mation and noise injection. In Proceedings of the
IEEE/CVF Conference on Computer Vision and Pat-
tern Recognition Workshops, pages 466–467.
K
¨
ohler, T., B
¨
atz, M., Naderi, F., Kaup, A., Maier, A., and
Riess, C. (2019). Toward bridging the simulated-to-
real gap: Benchmarking super-resolution on real data.
IEEE transactions on pattern analysis and machine
intelligence, 42(11):2944–2959.
Liu, S., Peng, X., and Liu, Z. (2019). Image quality as-
sessment through contour detection. In 2019 IEEE
28th International Symposium on Industrial Electron-
ics (ISIE), pages 1413–1417. IEEE.
Ma, C., Yang, C.-Y., Yang, X., and Yang, M.-H. (2017).
Learning a no-reference quality metric for single-
image super-resolution. Computer Vision and Image
Understanding, 158:1–16.
Ni, Z., Ma, L., Zeng, H., Chen, J., Cai, C., and Ma, K.-K.
(2017). Esim: Edge similarity for screen content im-
age quality assessment. IEEE Transactions on Image
Processing, 26(10):4818–4831.
Prewitt, J. M. (1970). Object enhancement and extraction.
Picture processing and Psychopictorics, 10(1):15–19.
Roberts, L. G. (1963). Machine perception of three-
dimensional solids. PhD thesis, Massachusetts Insti-
tute of Technology.
Shi, G., Wan, W., Wu, J., Xie, X., Dong, W., and Wu, H. R.
(2019). Sisrset: Single image super-resolution subjec-
tive evaluation test and objective quality assessment.
Neurocomputing, 360:37–51.
Tian, Y., Zhang, Y., Fu, Y., and Xu, C. (2020). Tdan:
Temporally-deformable alignment network for video
super-resolution. In Proceedings of the IEEE/CVF
Conference on Computer Vision and Pattern Recog-
nition, pages 3360–3369.
Wan, W., Wu, J., Shi, G., Li, Y., and Dong, W. (2018).
Super-resolution quality assessment: Subjective eval-
uation database and quality index based on perceptual
structure measurement. In 2018 IEEE International
Conference on Multimedia and Expo (ICME), pages
1–6. IEEE.
Wang, G., Li, L., Li, Q., Gu, K., Lu, Z., and Qian, J.
(2017). Perceptual evaluation of single-image super-
resolution reconstruction. In 2017 IEEE International
Conference on Image Processing (ICIP), pages 3145–
3149. IEEE.
Wang, G., Zhu, F., Lu, Z., Yuan, X., and Li, L.
(2018). No-reference quality assessment of super-
resolution reconstructed images by incorporating do-
main knowledge. J. Inf. Hiding Multim. Signal Pro-
cess., 9(2):496–505.
Wang, X., Xie, L., Dong, C., and Shan, Y. (2021).
Real-esrgan: Training real-world blind super-
resolution with pure synthetic data. arXiv preprint
arXiv:2107.10833.
Wang, Z., Bovik, A. C., Sheikh, H. R., and Simoncelli, E. P.
(2004). Image quality assessment: from error visi-
bility to structural similarity. IEEE transactions on
image processing, 13(4):600–612.
Wang, Z., Simoncelli, E. P., and Bovik, A. C. (2003). Mul-
tiscale structural similarity for image quality assess-
ment. In The Thrity-Seventh Asilomar Conference on
Signals, Systems & Computers, 2003, volume 2, pages
1398–1402. Ieee.
Xue, W. and Mou, X. (2011). An image quality assessment
metric based on non-shift edge. In 2011 18th IEEE
International Conference on Image Processing, pages
3309–3312. IEEE.
Yang, C.-Y., Ma, C., and Yang, M.-H. (2014). Single-image
super-resolution: A benchmark. In European confer-
ence on computer vision, pages 372–386. Springer.
Yang, L., Sheng, Y., and Chai, L. (2019). A machine
learning based reduced-reference image quality as-
sessment method for single-image super-resolution.
In 2019 Chinese Control Conference (CCC), pages
3571–3576. IEEE.
Yeganeh, H., Rostami, M., and Wang, Z. (2015). Ob-
jective quality assessment of interpolated natural im-
ages. IEEE Transactions on Image Processing,
24(11):4651–4663.
Zhang, K., Zhu, D., Li, J., Gao, X., Gao, F., and Lu, J.
(2021). Learning stacking regression for no-reference
super-resolution image quality assessment. Signal
Processing, 178:107771.
Zhang, R., Isola, P., Efros, A. A., Shechtman, E., and Wang,
O. (2018). The unreasonable effectiveness of deep
features as a perceptual metric. In Proceedings of
the IEEE conference on computer vision and pattern
recognition, pages 586–595.
Zhou, F., Yao, R., Liu, B., and Qiu, G. (2019). Visual qual-
ity assessment for super-resolved images: Database
and method. IEEE Transactions on Image Process-
ing, 28(7):3528–3541.
Zhou, W., Wang, Z., and Chen, Z. (2021). Image
super-resolution quality assessment: Structural fi-
delity versus statistical naturalness. arXiv preprint
arXiv:2105.07139.
VISAPP 2022 - 17th International Conference on Computer Vision Theory and Applications
322
