
Improving Graph Classification by Means of Linear Combinations of
Reduced Graphs
Anthony Gillioz
1 a
and Kaspar Riesen
1,2 b
1
Institute of Computer Science, University of Bern, Bern, Switzerland
2
Institute for Informations Systems, University of Appl. Sci. Northwestern Switzerland, Olten, Switzerland
Keywords:
Structural Pattern Recognition, Graph Matching, Genetic Algorithm, Multiple Classifier Systems.
Abstract:
The development and research of graph-based matching techniques that are both computationally efficient
and accurate is a pivotal task due to the rapid growth of data acquisition and the omnipresence of structural
data. In the present paper, we propose a novel framework using information gained from diversely reduced
graph spaces to improve the classification accuracy of a structural classifier. The basic idea consists of three
subsequent steps. First, the original graphs are reduced to different size levels with the aid of node centrality
measures. Second, we compute the distances between the reduced graphs in the corresponding graph sub-
spaces. Finally, the distances are linearly combined and fed into a distance-based classifier to produce the
final classification. On six graph datasets we empirically demonstrate that classifiers clearly benefit from the
combined distances obtained in the graph subspaces.
1 INTRODUCTION
Graph classification is a prominent task in structural
pattern recognition (e.g., community classification of
social groups (Liu et al., 2015) or the determination
whether or not molecular compounds are toxic (Jin
et al., 2010), to name only two examples). From a
very broad perspective, structural pattern classifica-
tion is relatively similar to supervised statistical ma-
chine learning. Both approaches aim to extract use-
ful formal representations out of given data and map
those extracted representations to one of the available
categories. Unfortunately, due to the inherent rela-
tional structure of graphs, one cannot directly apply
methods, originally developed for statistical data, to
graph data.
A prominent way to deal with this problem is to
embed graphs into a vector space and eventually ap-
ply a standard machine learning framework on the
embedded graphs. Yet, it is not a trivial task to
find an embedding function that respects the inher-
ent relations that may exist between the elements of
a graph. Graph embedding approaches range from
spectral methods (Caelli and Kosinov, 2004; Qiu and
Hancock, 2006), to Graph Kernels (Kriege et al.,
a
https://orcid.org/0000-0001-7352-3708
b
https://orcid.org/0000-0002-9145-3157
2020), Dissimilarity Embeddings (Riesen and Bunke,
2010), and Graph Neural Networks (GNN) (Wu
et al., 2021).
Research in the field of graph embedding has
made great progress over the past few years. How-
ever, there is still a risk of loosing discriminating
power during the embedding process. Moreover,
some of the mentioned approaches still rely on graph
matching, while others (e.g. GNN) suffer from their
non-interpretability.
The present paper is focused on graph match-
ing methods for graph classification (Conte et al.,
2004), and in particular, on Graph Edit Dis-
tance (GED) (Bunke and Allermann, 1983; Sanfe-
liu and Fu, 1983). Actually, distance-based clas-
sifiers coupled with GED have shown reasonable
classification accuracy on numerous classification
tasks (Maergner et al., 2018; Fuchs and Riesen,
2021). The present paper aims to improve the clas-
sification accuracy of a distance-based classifier us-
ing GED. To achieve this goal, we propose a novel
framework that gains extra information out of various
subgraphs extracted from the original graphs.
More formally, the basic idea of our approach
consists of mapping the graphs into various reduced
graph spaces, where each graph space contains graphs
that consist of the most important nodes only. Node
centrality measures are employed for this graph re-
Gillioz, A. and Riesen, K.
Improving Graph Classification by Means of Linear Combinations of Reduced Graphs.
DOI: 10.5220/0010776900003122
In Proceedings of the 11th International Conference on Pattern Recognition Applications and Methods (ICPRAM 2022), pages 17-23
ISBN: 978-989-758-549-4; ISSN: 2184-4313
Copyright
c
2022 by SCITEPRESS – Science and Technology Publications, Lda. All rights reserved
17

duction. Next, we compute the GED between the
graphs in each reduction level and combine the dis-
tances or predictions obtained. The meta-parameters,
viz. the weight coefficients for the linear combination,
are either optimized via grid-search or by means of a
genetic algorithm. Finally, the combined distances or
predictions are used as basis for the final classifica-
tion.
The remainder of this paper is organized as fol-
lows. In Section 2, we formally introduce the notion
of graphs and give a brief review of graph matching
methods. In Section 3, we describe in detail our novel
method to produce differently sized graphs and com-
bine the distances or predictions obtained in the re-
duced graph spaces. In Section 4, we present and dis-
cuss the results of our experimental evaluation, and in
Section 5, we conclude the paper and discuss some
future research ideas.
2 RELATED WORK
In this section, we provide a formal definition of
graph structures and briefly review common graph-
based matching methods (including the one actually
used).
2.1 Graph Structure
A graph G = (V, E) in a graph space G is defined as a
set of nodes V and a set of edges E ⊂ (V ×V ) between
these nodes. In case of directed graphs, an edge starts
at node u ∈ V and ends at node v ∈ V and is denoted
by (u, v) ∈ E. If the graph is undirected, an edge is de-
fined as (u, v) ∈ E ↔ (v, u) ∈ E. A node (and/or edge)
labeling function µ : V 7→ L
V
(and/or ν : E 7→ L
E
) is
defined in the case of labeled nodes (and/or labeled
edges). In the remainder of this paper, we limit our
work to simple, undirected graphs, i.e., graphs that
have at most one edge between each pair of nodes and
no edge between a node and itself. The size of a graph
is commonly defined as the cardinality of its node set
|V |.
2.2 Graph Matching Methods
We focus our research on structural methods in pat-
tern recognition using inexact graph matching algo-
rithms. In this scenario, the matching constraints are
generally relaxed such that matchings between arbi-
trary graphs are possible. Inexact matching is par-
ticularly useful when (small) errors appear in the in-
put graphs or when one wants to derive a numerical
degree of similarity/dissimilarity between two graphs
(rather than checking for (sub-)graph isomorphism
only).
Actually, various inexact graph matching meth-
ods have been proposed over the years (Conte et al.,
2004). The authors of (Escolano et al., 2011), for in-
stance, proposed an inexact graph matching that de-
pends on spectral features that represent a graph as a
bag of partial node coverages. (Kashima et al., 2003)
introduced a probabilistic method for defining graph
matching based on sequences of node indices and a
random walk. (Escolano et al., 2017) proposed a new
similarity measure that computes the mutual infor-
mation between graphs with a combination of copula
functions to perform graph comparison.
In the present paper, we employ Graph Edit Dis-
tance (GED) (Bunke and Allermann, 1983; Sanfeliu
and Fu, 1983) as basic matching paradigm. GED is
a well known graph matching technique with great
adaptability power. It has gained interest as a dis-
similarity measure on a broad range of problems and
applications (Riesen and Bunke, 2010; Cort
´
es and
Serratosa, 2015). GED defines the dissimilarity be-
tween two graphs G and G
0
by computing the least
amount of transformation (i.e., edit operations) re-
quired to convert G into G
0
. Three edit operations on
both nodes and edges are typically defined, viz. in-
sertion, deletion, and substitution. Each of those edit
operations can have a custom cost that emphasizes the
severity of the given graph transformation. This cost
is typically formalized by means of a cost function
c(·). The goal of GED is to find an edit path between
G and G
0
, i.e., a set {e
1
, ..., e
k
} of k edit operations
e
i
, that transforms G into G
0
, while minimizing the
overall transformation cost.
In order to compute the optimal edit path, GED
computations are typically based on combinatorial
search methods with exponential complexity, which
makes GED actually unfeasible on large graphs.
However, different GED approximations (Riesen and
Bunke, 2009; Fischer et al., 2014) have been pro-
posed allowing us to find a reasonable approxima-
tion of GED in polynomial time. In the present pa-
per we actually employ the approximation proposed
in (Riesen and Bunke, 2009).
As discussed in the next section, we propose to
compute GED on differently sized graphs and eventu-
ally combine the outcome. Hence, our novel method
is somehow related to the recently proposed hierar-
chical framework for inexact graph matching (Riba
et al., 2020). They use a community detection method
to construct a hierarchy of compressed graphs. The
matching is then performed in a coarse-to-fine fash-
ion. Starting the matching at the lowest level (i.e., the
level where the graphs are the most compressed) and
ICPRAM 2022 - 11th International Conference on Pattern Recognition Applications and Methods
18
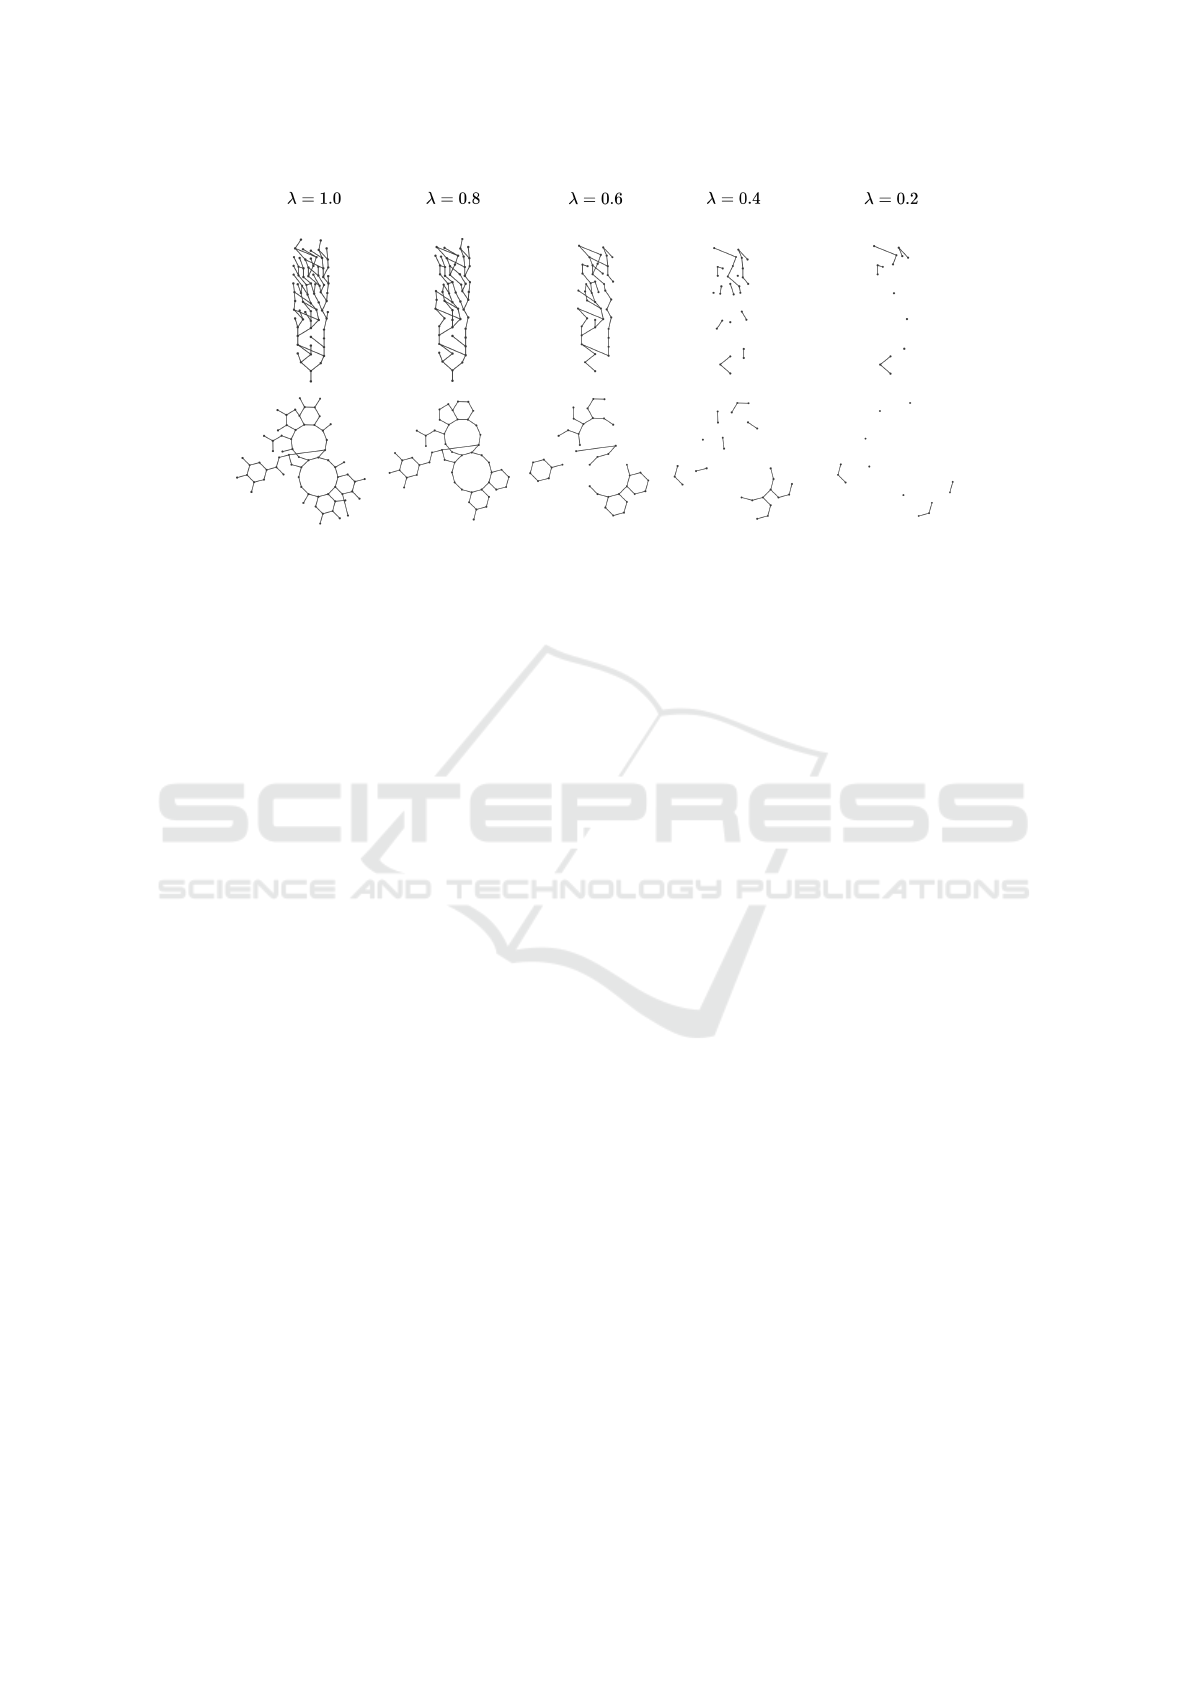
Figure 1: Example of our graph reduction method with different levels of λ on two molecular graphs from the AIDS dataset.
going up level by level if necessary.
3 OUR NOVEL METHOD
In the present paper we want to research the benefits
and limitations of the multi-level information gained
from reduced graphs in a multiple classifier scenario.
That is, we investigate whether or not the simultane-
ous use of this extra information improves the classifi-
cation performance of a distance-based classifier. The
basic idea is to combine the information gained at dif-
ferent reduction levels and perform the classification
on this combination.
3.1 Graph Reduction
Our approach depends on graph subspaces. Hence,
we conduct a fast yet deterministic mapping of our
graphs to different graph subspaces. Our reduction
method is based on centrality measures for nodes in a
network.
In the present paper, we use the PageRank central-
ity score (Brin and Page, 1998). Note, however, that
any other node centrality measure could be used as
well (Newman, 2018). The basic concept of PageR-
ank relies on the fact that a node’s influence increases
if it is connected to other influential nodes. To avoid
that the most prestigious nodes in a graph widespread
its high-centrality score too all its neighbors, the influ-
ence of a node is diluted proportionally to the number
of neighbors.
Given the centralities for each node, we sort them
according to their respective centrality score from the
least to the most influential one. Given a reduction
factor λ ∈ [0, 1] we then keep the λ|V | most influential
nodes in the graph while the other nodes (including
their edges) are discarded.
The reduction factor λ roughly corresponds to the
percentage of remaining nodes of the original graphs
(i.e., if we set λ = 0.6, approximately 60% of the
nodes remain in the reduced version of the graph). We
vary the reduction factor such that it takes the follow-
ing values λ ∈ {1.0, 0.8, 0.6, 0.4, 0.2}, where λ = 1.0
represents the full graphs (i.e., graphs where no nodes
are removed).
In Fig. 1 we show two examples of graph reduc-
tions with different levels of λ on two graphs from the
AIDS dataset (the datasets are described in the next
Section).
From now on, we describe a reduced graph (with
reduction factor λ) as G
λ
= (V
λ
, E
λ
). Reducing the
N graphs of a dataset for a given λ gives us a re-
duced graph space G
λ
= {G
(1)
λ
, . . . , G
(N)
λ
}. Repeating
this procedure for all possible values of λ we produce
multiple reduced graph spaces.
In each graph subspace G
λ
we are now able
to compute graph dissimilarities between pairs of
graphs. Formally, for each graph G
(i)
λ
we produce a
distance vector d
i
= [d
i,1
, d
i,2
, ..., d
i,N
] between itself
and all other graphs and combine them to create a dis-
tance matrix D
λ
.
Given these distance matrices for different levels,
we pursue two different strategies of combining them
to come up with a final classification. Both strategies
are briefly described in the next two subsections. In
both scenarios a distance based classifier, viz. a K-
nearest-neighbor classifier (KNN), is employed. The
KNN has the clear advantage that it directly oper-
ates on the resulting distances without any additional
training and can thus be used as indicator for the qual-
ity of the underlying distance.
Improving Graph Classification by Means of Linear Combinations of Reduced Graphs
19

Table 1: Statistics of the graph datasets. We show the number of graphs (|G|) with the size of the training, validation and test
set (tr, va, te), the number of classes (|Ω|) and the average number of nodes and edges (
/
0|V |,
/
0|E|) per dataset.
Dataset |G| (tr, va, te) |Ω|
/
0 |V |
/
0 |E|
AIDS 2,000 (250, 250, 1,500) 2 9.5 10.0
Mutagenicity 4,337 (1,500, 500, 2,337) 2 30.3 30.8
NCI1 4,110 (1,500, 500, 2,110) 2 29.9 32.3
Proteins 1,113 (660, 220, 223) 2 39.1 72.8
Enzymes 600 (360, 120, 120) 6 32.6 62.1
IMDB Binary 1,000 (600, 200, 200) 2 19.8 96.5
3.2 Combination of the Distances
The first idea is to linearly combine the given distance
matrices D
λ
with λ ∈ {1.0, 0.8, 0.6, 0.4, 0.2} into a
meta-distance matrix
D =
∑
λ
ω
λ
D
λ
(1)
Eventually, we use this matrix D to perform the
classification with a KNN. Note the parameter ω
λ
∈
[0, 1] which is used to weight the relative importance
of the reduced graph space at level λ.
3.3 Combination of the Predictions
The second combination idea is defined as follows.
Instead of combining the distances, we combine the
predictions obtained at each reduced graph subspace.
Formally, we retrieve the class prediction of a
KNN for each graph sample at level λ. Thus, we
have a prediction vector p
λ
= [p
1
, p
2
, ..., p
n
]
T
for each
graph subspace where p
i
corresponds to the predic-
tion of the i-th graph. We now linearly combine the
weighted prediction vectors with
P =
∑
λ
ω
λ
p
λ
(2)
That is, we conduct a weighted majority voting
(Kittler, 2002).
3.4 Optimization of the Parameters ω
The parameter vector ω
ω
ω = (ω
λ
1
, . . . , ω
λ
t
) contains the
t parameters ω
λ
i
for all reduction factors λ
i
where t
corresponds to the graph subspaces actually available.
That is, this parameter weights the importance of each
reduced graph space. We aim for a linear combina-
tion of the reduced graph subspaces, and we add a
constraint on ω
ω
ω such that the sum of the parameters
equals 1. Formally, we have
∑
λ
i
ω
λ
i
= 1 and ω
λ
i
∈ [0, 1] (3)
Our goal is now to optimize the linear coefficients
to obtain ω
ω
ω
∗
such that the meta-distance matrix D or
the combined predictions P achieve the best classifi-
cation accuracy. The optimization is performed with
two different methods.
The first method is to use a grid search over the
parameter space. Note, however, that the search space
has a size of O(D
t
), where D is the number of possi-
ble values for ω
λ
i
and t is the total number of sub-
spaces to be combined. In order to have a reason-
able search time, we use five reduction levels only
(λ ∈ {1.0, 0.8, 0.6, 0.4, 0.2}) and 11 possible weight-
ing factors (ω
λ
i
∈ {1.0, 0.9, . . . , 0.1, 0.0} leading to
11
5
= 161, 051 different possibilities. To reduce the
risk of overfitting during the grid search optimization
method, we apply a 5-fold cross-validation.
The second optimization method is to use a Ge-
netic Algorithm (GA) (Eiben and Smith, 2015). Each
ω
λ
i
represents a gene in the chromosome ω
ω
ω. The fit-
ness function of each chromosome is the classifica-
tion accuracy of the KNN coupled with correspond-
ing weighted combination. This score defines how
well a given weighting vector solves the optimization
problem. The first step of a genetic algorithm is to
randomly generate a set of chromosomes. Then, GA
evaluates those chromosomes with the fitness func-
tion, selects the best performing chromosomes and
combines them with a crossover operation to create
the next generation of chromosomes. The crossover
is done uniformly among the genes of the parents.
Each newly created chromosome has a chance to mu-
tate with probability p
m
= 0.1. These three steps are
repeated until a specified criterion is reached. In the
present paper we use a fixed number of optimization
iterations. GAs allow a more efficient search pro-
cedure over the parameter space compared to grid
search. On the other hand, it is more prone to overfit-
ting without offering well-defined regularization tech-
niques to prevent it.
ICPRAM 2022 - 11th International Conference on Pattern Recognition Applications and Methods
20

Table 2: Classification accuracy [%] obtained on the test set with linear combinations of reduced graphs. We present the results
obtained by a KNN for the baseline and our two combination methods that are Combination of Distance Matrices (CoDM)
and Combination of Predictions (CoP). The best result per dataset is shown in boldface. (◦/•: statistically significantly
better/worse than the baseline on a 5% level using a Z-test.).
Method \ Dataset AIDS Mutagenicity NCI1 Proteins Enzymes IMDB-Binary
Baseline KNN 98.53 71.33 70.33 73.82 41.67 66.00
CoDM - Grid Search 99.13◦ 71.84 72.09 73.39 45.83 64,50
CoDM - Genetic Algorithm 99.13◦ 72.66 73.22◦ 75.54 48.33◦ 66.00
CoP - Grid Search 99.33◦ 72.32 70.52 73.82 41.67 70.00
CoP - Genetic Algorithm 99.13◦ 71.84 70.52 76.39◦ 37.50• 70.00
4 EXPERIMENTAL EVALUATION
4.1 Datasets
We evaluate our novel procedure on six datasets in to-
tal. Two datasets are retrieved from the IAM graph
repository (Riesen and Bunke, 2008)
1
(AIDS, Muta-
genicity) and the four others from TUDataset (Morris
et al., 2020)
2
(NCI1, Proteins, Enzymes, IMDB Bi-
nary).
Table 1 shows some graph properties such as the
number of graphs, the number of classes, and the av-
erage number of nodes and edges per dataset. The
first three datasets (AIDS, Mutagenicity, and NCI1)
represent small molecular compounds. The AIDS
dataset contains molecules from two categories, viz.
molecules that have an effect against the HI virus or
not. Graphs in Mutagenicity dataset represent chemi-
cal compounds that can be classified as mutagen/non-
mutagen. The graphs in the NCI1 dataset (Wale and
Karypis, 2006) represent chemical compounds that
are positive or negative lung cancerous cells. The Pro-
teins graphs represent proteins that are categorized as
enzymes/non-enzymes, while the graphs in Enzymes
correspond to tertiary protein structures compiling 6
enzymes (Borgwardt et al., 2005). The graphs from
IMDB-Binary (Yanardag and Vishwanathan, 2015)
represent individual movies from two categories.
The split of the datasets into training, validation,
and test sets is done as follows. The graphs from the
IAM datasets are divided according to the provided
splitting. The partitioning of the NCI1 dataset is done
to match the size of the splitting of the Mutagenicity
dataset. The remaining datasets are split according to
the 60-20-20% split rule for the training, validation,
and test set, respectively.
1
www.iam.unibe.ch/fki/databases/iam-graph-database
2
http://www.graphlearning.io/
4.2 Experimental Setup
In our experiment we want to verify whether or not
using extra information gained from the reduced ver-
sions of the graphs can help improving the overall
classification accuracy. To this end, we first run a ba-
sic KNN classifier on all datasets using the original
graphs (i.e., λ = 1.0). This actually builds the baseline
of our evaluation. We individually optimize KNN’s
hyperparameters on the validation set. The optimized
parameters consist of k that designate the number of
neighbors used by the KNN and α that ponders the
relative importance of node and edge edit operation
costs during GED computation. The obtained param-
eters are presented for each dataset in Table 3.
Table 3: Optimal k and α obtained during the hyperparam-
eter optimization on the validation set.
Dataset k
k
k α
α
α
AIDS 1 0.7
Mutagenicity 5 0.6
NCI1 5 0.7
Proteins 3 0.9
Enzymes 1 0.9
IMDB Binary 5 0.9
For the experiments with the reduced graphs, we
set the reduction factors to λ ∈ {1.0, 0.8, 0.6, 0.4, 0.2}.
We reused the hyperparameters k and α found dur-
ing the individual optimization. Eventually, we com-
pute all distance matrices D
λ
between training and
validation graphs, and perform the optimization of
the linear coefficicients with both grid search and ge-
netic algorithm. The optimized parameters (using ei-
ther grid search or a genetic algorithm) are finally
used to classify the test graphs. In Fig. 2, we plot
the optimized weights ω
ω
ω∗ found during optimization.
The plot shows the importance of the reduced graph
spaces for all experiments conducted. We observe
that, in general, the original graph space tends to have
Improving Graph Classification by Means of Linear Combinations of Reduced Graphs
21

a strong impact in the majority of the tested settings.
However, it is also clearly observable that all other
graph subspaces significantly contribute to the final
distance and/or prediction.
Figure 2: Importance of each reduced graph space in the lin-
ear combination for all optimization methods, combination
methods, and datasets.
4.3 Results
In Table 2, we present the classification accuracy ob-
tained by our combination methods on the test set.
Our two combination methods (Combination of Dis-
tance Matrices (CoDM) and Combination of Predic-
tions (CoP)) are optimized with both grid search and
GA.
In general, we observe that combining the dis-
tances or the predictions of the reduced graphs im-
proves the classification accuracy when compared to
the baseline on all datasets. That is, on all datasets the
overall best result (shown in boldface) is achieved by
one of the combination methods.
On half of the datasets (Mutagenicity, NCI1, En-
zymes) the classifier that relies on the combination of
the distances (CoDM) optimized with GA achieves
the overall best accuracies. We observe statistically
significant improvements over the baseline on NCI1
and Enzymes by nearly 3% and 7%, respectively. On
the three other datasets, the classifier that uses the
combination of the predictions (CoP) on the reduced
graphs leads to the overall best classification accura-
cies. The improvements on the AIDS and Proteins
dataset compared to our reference system are actually
statistically significant.
In general, the optimization using the GA pro-
duces better results than the grid search for both com-
bination methods (CoDM and CoP). In 9 out of 12
comparisons the GA achieves the same or better clas-
sification accuracies as the grid search. However, the
drawback of this optimization technique is the risk
of overfitting that clearly appears on the Enzymes
dataset using CoP.
5 CONCLUSION
In present paper, we propose a novel framework that
combines multi-level information computed on re-
duced versions of graphs. More specifically, we pro-
duce multiple reduced graph spaces and use GED to
compute the distances between the graphs in those re-
duced graph spaces. In order to reduce the original
graphs we evaluate the importance of each node by
means of PageRank and discard the least important
nodes in an iterative procedure. We linearly com-
bine the weighted distances or the weighted predic-
tions obtained in the various reduced graph subspaces.
We optimize the linear combinations using two strate-
gies, viz. a grid search and a genetic algorithm. By
performing an empirical evaluation on a wide range
of applications, we demonstrate the benefit of using
extra information gained from reduced graphs. Par-
ticularly, we show that combining distances or pre-
dictions of multi-level graphs assists a distance-based
classifier and improves its classification power. That
is, on all data sets at least one of the combinations
outperforms the reference system. On four out of six
datasets we observe statistically significant improve-
ments over the reference system.
In future work we plan to improve the perfor-
mance of the distance-based classifier by using other
graph reduction methods. In particular, we aim at in-
vestigating methods that keep more coherent topolog-
ical information of the graphs and would summarize
the inner information of the nodes during the reduc-
tion process. Non-linear combinations of the dissim-
ilarities or predictions could also be a rewarding av-
enue to be pursued. Finally, further empirical analy-
sis can be done with our novel method. Specifically,
we can compare the computational complexity of our
multi-level framework to the baseline KNN. Addi-
tionally, a comparison of our method to other state-
of-the-art methods can be conducted.
ACKNOWLEDGEMENTS
This material is based upon work supported by the
Swiss National Science Foundation (SNSF) under
Grant Nr. 200021 188496.
REFERENCES
Borgwardt, K. M., Ong, C. S., Sch
¨
onauer, S., Vish-
wanathan, S. V. N., Smola, A. J., and Kriegel, H.-P.
(2005). Protein function prediction via graph kernels.
Bioinformatics, 21(suppl 1):i47–i56.
ICPRAM 2022 - 11th International Conference on Pattern Recognition Applications and Methods
22

Brin, S. and Page, L. (1998). The anatomy of a large-scale
hypertextual Web search engine. Computer Networks
and ISDN Systems, 30(1):107–117.
Bunke, H. and Allermann, G. (1983). Inexact graph match-
ing for structural pattern recognition. Pattern Recogn.
Lett., 1(4):245–253.
Caelli, T. and Kosinov, S. (2004). An eigenspace projection
clustering method for inexact graph matching. IEEE
Transactions on Pattern Analysis and Machine Intel-
ligence, 26(4):515–519. Conference Name: IEEE
Transactions on Pattern Analysis and Machine Intel-
ligence.
Conte, D., Foggia, P., Sansone, C., and Vento, M. (2004).
Thirty Years Of Graph Matching In Pattern Recogni-
tion. IJPRAI, 18:265–298.
Cort
´
es, X. and Serratosa, F. (2015). Learning graph-
matching edit-costs based on the optimality of the ora-
cle’s node correspondences. Pattern Recognition Let-
ters, 56:22–29.
Eiben, A. E. and Smith, J. E. (2015). Introduction to Evo-
lutionary Computing. Springer Publishing Company,
Incorporated, 2nd edition.
Escolano, F., Bonev, B., and Lozano, M. A. (2011).
Information-Geometric Graph Indexing from Bags of
Partial Node Coverages. In Jiang, X., Ferrer, M., and
Torsello, A., editors, Graph-Based Representations in
Pattern Recognition, Lecture Notes in Computer Sci-
ence, pages 52–61, Berlin, Heidelberg. Springer.
Escolano, F., Hancock, E. R., Lozano, M. A., and Curado,
M. (2017). The mutual information between graphs.
Pattern Recognition Letters, 87:12–19.
Fischer, A., Plamondon, R., Savaria, Y., Riesen, K., and
Bunke, H. (2014). A Hausdorff Heuristic for Effi-
cient Computation of Graph Edit Distance. In Fr
¨
anti,
P., Brown, G., Loog, M., Escolano, F., and Pelillo,
M., editors, Structural, Syntactic, and Statistical Pat-
tern Recognition, Lecture Notes in Computer Science,
pages 83–92, Berlin, Heidelberg. Springer.
Fuchs, M. and Riesen, K. (2021). Matching of Matching-
Graphs - A Novel Approach for Graph Classifica-
tion. In 2020 25th International Conference on Pat-
tern Recognition (ICPR), pages 6570–6576. ISSN:
1051-4651.
Jin, N., Young, C., and Wang, W. (2010). GAIA: graph
classification using evolutionary computation. In Pro-
ceedings of the 2010 ACM SIGMOD International
Conference on Management of data, pages 879–890,
Indianapolis Indiana USA. ACM.
Kashima, H., Tsuda, K., and Inokuchi, A. (2003). Marginal-
ized kernels between labeled graphs. In Proceedings
of the Twentieth International Conference on Interna-
tional Conference on Machine Learning, ICML’03,
pages 321–328, Washington, DC, USA. AAAI Press.
Kittler, J. (2002). Multiple Classifier Systems. In Soft Com-
puting Approach to Pattern Recognition and Image
Processing, volume 53 of Series in Machine Percep-
tion and Artificial Intelligence, pages 3–22. WORLD
SCIENTIFIC.
Kriege, N. M., Johansson, F. D., and Morris, C. (2020). A
survey on graph kernels. Appl Netw Sci, 5(1):1–42.
Number: 1 Publisher: SpringerOpen.
Liu, G., Yang, Q., Wang, H., Wu, S., and Wittie, M. P.
(2015). Uncovering the mystery of trust in an online
social network. In 2015 IEEE Conference on Com-
munications and Network Security (CNS), pages 488–
496.
Maergner, P., Pondenkandath, V., Alberti, M., Liwicki, M.,
Riesen, K., Ingold, R., and Fischer, A. (2018). Offline
Signature Verification by Combining Graph Edit Dis-
tance and Triplet Networks. arXiv:1810.07491 [cs],
11004:470–480. arXiv: 1810.07491.
Morris, C., Kriege, N. M., Bause, F., Kersting, K., Mutzel,
P., and Neumann, M. (2020). TUDataset: A collec-
tion of benchmark datasets for learning with graphs.
arXiv:2007.08663 [cs, stat]. arXiv: 2007.08663.
Newman, M. (2018). Networks. Oxford University Press.
Google-Books-ID: YdZjDwAAQBAJ.
Qiu, H. and Hancock, E. R. (2006). Graph matching and
clustering using spectral partitions. Pattern Recogni-
tion, 39(1):22–34.
Riba, P., Llad
´
os, J., and Forn
´
es, A. (2020). Hierarchical
graphs for coarse-to-fine error tolerant matching. Pat-
tern Recognition Letters, 134:116–124.
Riesen, K. and Bunke, H. (2008). IAM Graph Database
Repository for Graph Based Pattern Recognition and
Machine Learning. In da Vitoria Lobo, N., Kasparis,
T., Roli, F., Kwok, J. T., Georgiopoulos, M., Anag-
nostopoulos, G. C., and Loog, M., editors, Structural,
Syntactic, and Statistical Pattern Recognition, Lecture
Notes in Computer Science, pages 287–297, Berlin,
Heidelberg. Springer.
Riesen, K. and Bunke, H. (2009). Approximate graph
edit distance computation by means of bipartite graph
matching. Image and Vision Computing, 27(7):950–
959.
Riesen, K. and Bunke, H. (2010). Graph Classification and
Clustering Based on Vector Space Embedding. World
Scientific Publishing Co., Inc., USA.
Sanfeliu, A. and Fu, K. (1983). A distance measure be-
tween attributed relational graphs for pattern recogni-
tion. IEEE Transactions on Systems, Man, and Cy-
bernetics, SMC-13(3):353–362. Conference Name:
IEEE Transactions on Systems, Man, and Cybernet-
ics.
Wale, N. and Karypis, G. (2006). Comparison of Descriptor
Spaces for Chemical Compound Retrieval and Classi-
fication. In Sixth International Conference on Data
Mining (ICDM’06), pages 678–689. ISSN: 2374-
8486.
Wu, Z., Pan, S., Chen, F., Long, G., Zhang, C., and Yu,
P. S. (2021). A Comprehensive Survey on Graph
Neural Networks. IEEE Transactions on Neural Net-
works and Learning Systems, 32(1):4–24. Conference
Name: IEEE Transactions on Neural Networks and
Learning Systems.
Yanardag, P. and Vishwanathan, S. (2015). Deep Graph
Kernels. In Proceedings of the 21th ACM SIGKDD In-
ternational Conference on Knowledge Discovery and
Data Mining, pages 1365–1374. Association for Com-
puting Machinery, New York, NY, USA.
Improving Graph Classification by Means of Linear Combinations of Reduced Graphs
23
