
ConText: Supporting the Pursuit and Management of Evidence in
Text-based Reporting Systems
Tabassum Kakar
1
, Xiao Qin
1
, Elke Rundensteiner
1
, Lane Harrison
1
, Sanjay Sahoo
2
, Suranjan De
2
and Thang La
2
1
Worcester Polytechnic Institute, Worcester, MA, U.S.A.
2
U.S. Food and Drug Administration, Silver Spring, MD, U.S.A.
Keywords:
Pharmacovigilance, Visual Analytics, Evidence Collection and Management.
Abstract:
Instance-based Incident Analysis (IIA) – a labor intensive and error-prone task – requires analysts to review
text-based reports of incidents, where each may be evidence of a larger problem that requires regulatory
action. Given the rise of reporting systems in many organizations, there is a need to explore tools that may aid
IIA analysts in exploring, evaluating, and generalizing findings across a large set of independently produced
reports in a unified workflow – currently not supported by existing tools. In this work, we contribute a design
study conducted in collaboration with Pharmacovigilance experts at the US Food and Drug Administration.
Following a series of interviews and discussions focused on workflows and toolsets, we develop a prototype,
ConText, which combines domain-informed computational methods with interactive visual displays to support
evidence identification, collection, and management for IIA. We evaluate ConText via case studies and
follow-up semi-structured interviews, depicting its effectiveness in performing IIA tasks of evidence collection
and monitoring. We discuss insights derived from the design and evaluation of ConText that may be valuable
for designing future interactive analytic systems for life-critical IIA workflows.
1 INTRODUCTION
Text-based reporting systems are prevalent across
a wide sector of regulatory organizations. In
Pharmacovigilance, the U.S. Food and Drug
Administration (FDA) monitors adverse event
reports submitted by patients to identify adverse
drug reactions or medication errors (H
¨
armark and
Van Grootheest, 2008). In the aviation industry,
the US Federal Aviation Administration (FAA) is
mandated to investigate service difficulty reports
to better identify ongoing maintenance issues with
aircraft (SDR, 2021; Marais and Robichaud, 2012).
Similarly, the US Consumer Financial Protection
Bureau (CFPB, 2021) is responsible for collecting
and analyzing consumer complaints about unfair, or
deceptive financial practices.
We refer to these reports as incident reports,
and the activities analysts perform in these critical
text-based reporting systems as Instance-based
Incident Analysis (IIA). A common goal for IIA
is to analyze and then organize incoming reports
such that the relevant incident reports serving as
evidence for a particular issue are captured within
one coherent collection (Kakar et al., 2019b). This
report collection can then be used as evidence for
regulatory decision-making on products or services.
IIA activities require analysts’ judgement throughout
the process to make decisions on the importance
and relevance of each report to an investigation,
hence making IIA a suitable candidate for interactive
analytics approaches.
In this work, we focus on Pharmacovigilance as
a case domain for IIA, where robust detection of
adverse reactions and medication errors represents a
life-critical task, as adverse reactions are one of the
leading causes of death worldwide (Lazarou et al.,
1998). Given this criticality, drug safety analysts must
perform due diligence on hundreds of incident reports
on a daily basis, with the aim of identifying reports as
evidence to a suspected drug safety problem.
When these analysts find an incident of concern
with a particular drug or medical treatment, they
tend to pivot their analyses toward finding and
organizing similar incidents to build a case for
action (Kakar et al., 2019b). These cases need
continuous management as instances of evidence
are received over time. Cases may take longer to
38
Kakar, T., Qin, X., Rundensteiner, E., Harrison, L., Sahoo, S., De, S. and La, T.
ConText: Supporting the Pursuit and Management of Evidence in Text-based Reporting Systems.
DOI: 10.5220/0010768500003124
In Proceedings of the 17th International Joint Conference on Computer Vision, Imaging and Computer Graphics Theory and Applications (VISIGRAPP 2022) - Volume 3: IVAPP, pages 38-50
ISBN: 978-989-758-555-5; ISSN: 2184-4321
Copyright
c
2022 by SCITEPRESS – Science and Technology Publications, Lda. All rights reserved

conclude as enough evidence is needed to confirm
a potential problem. Thus, analysts continuously
monitor multiple cases and add evidence to them as
reports are received weekly.
In this paper, we present a design study
involving a prototype tool, ConText, designed in
collaboration with FDA analysts that aims to support
them in Instance-based Incident Analysis (IIA).
ConText assists an analyst to interactively examine
individual text narratives aided by domain-informed
NLP-generated interest points to identify evidential
information within a report. ConText then realizes
a systematic approach for assisting analysts in finding
instances of evidence to build and strengthen a case
supporting the occurrence of a critical incident, and
interactively managing multiple ongoing cases by
leveraging analysts’ knowledge and findings. We
evaluate the effectiveness of ConText for IIA via case
studies and interviews.
Contributions of this work include:
• Characterization of the Instance-based Incident
Analysis (IIA) workflow and ongoing challenges
through in-depth analysis of IIA practices via
a series of interviews and follow-up discussions
with domain experts at the FDA.
• ConText, an iteratively designed IIA-focused
prototype that includes a composition
of visualization and domain-informed
computational elements designed to aid analysts
in evidence collection and management by
providing a unified workflow.
• Recommendations following insights gained
during the development and evaluation
of ConText that opens opportunities in
human-computer interaction and visualization for
designing future systems supporting IIA.
2 BACKGROUND AND RELATED
WORK
2.1 Incident Report Analysis
Much of the existing work in Pharmacovigilance
has focused on applying computational techniques
on incident reports to detect potential drugs causing
reactions (Karimi et al., 2015). Extensive work
developing natural language processing (NLP)
techniques to extract key information from clinical
notes and incident reports (Wunnava et al., 2020)
also exists. These techniques alone, however, are not
sufficient due to the analysts’ judgement being core
to IIA, making it a viable candidate for interactive
analytics.
On the other hand, publicly available online tools
such as OpenFDAVigil (B
¨
ohm et al., 2016) allow
the general public explore incident reports and get
basic statistics about the reports. Other approaches
have visualized relationships between drugs and their
reported reactions (Jian-Xiang et al., 2015; Kakar
et al., 2019b). These works do neither characterize
nor support the broader scope of IIA activities
performed by the analysts. Apart from this, we
are not aware of studies to understand IIA tasks or
approaches that use interactive analytics to support
such tasks performed in other domains, such as,
aviation (SDR, 2021) and financial services (CFPB,
2021).
2.2 Visual Document Analytics
The majority of the existing visualization techniques
for text analysis center around designing summaries
of a set of documents using topic analysis,
word-clouds or meta information from text (Liu et al.,
2018; G
¨
org et al., 2013; Kakar et al., 2019a).
These overviews may be potentially applied to
screen a particular problem represented by a set of
reports. Our goal instead is to support evidence
identification and collection for a potential problem,
screened using one of these overview techniques
(Kakar et al., 2019a; G
¨
org et al., 2013).
Extensive research work has been done to design
visual tools for ‘close reading’ of literary texts, such
as books and poems (J
¨
anicke et al., 2015). These tools
help in understanding the structure and content of the
literary documents. Literary texts are different than
incident reports in the sense that the later corresponds
to problem-centric documents to be investigated with
the sole purpose to assess the reported incidents.
In the medical domain, visual analytics tools
target the analysis and summarization of electronic
health records (EHR) and clinical notes (Shneiderman
et al., 2013; Sultanum et al., 2018). The majority
of these tools display overviews of patient’s medical
history consisting of multiple events to help the
medical professionals with diagnosis or treatment.
Conversely, in IIA, analysts identify an issue that is
happening to multiple patients and build a case by
collecting evidence about similar incidents to take a
regulatory action.
2.3 Analytics Record Keeping Tools
Extensive research has been conducted to manage
and annotate insights during exploration (Chen et al.,
ConText: Supporting the Pursuit and Management of Evidence in Text-based Reporting Systems
39

2010; Gotz et al., 2006) which resembles our case
management task. Harvest (Shrinivasan et al.,
2009) provides a mixed-initiative based approach to
automatically recommend notes and concepts from
past analyses that are relevant to the current analysis.
Sandbox (Wright et al., 2006) is a gesture-based
editor for collecting and managing insights and
discoveries on a visualization. Click2annotate
(Chen et al., 2010) provides automatically computed
editable templates for interpreting outliers and
clusters. Jigsaw’s successor (Liu et al., 2010) supports
insight capturing using text-diagramming, that allows
an investigator to sketch their findings on a timeline.
These systems target the design of interactive
techniques to allow analysts frame relevant
information together and clarify connections between
data points. Our goal instead is to use analysts’
captured insights to support evidence collection for
ongoing investigations to assist the IIA workflow.
2.4 Investigative Tools
Investigative tools such as Jigsaw (Stasko et al.,
2008; G
¨
org et al., 2013) focus on finding
relationships among data entities within and across
documents, constructing visualizations around these
relationships. While like Jigsaw, we extract key
information from the text narratives, one difference
is that exploration in JigSaw ends with reading the
individual documents (Stasko et al., 2008), while
ConText’s workflow starts with the analysis of
individual report and mainly focuses on collecting
independent instances of evidences for similar
problem. Moreover, ConText supports interactive
tracking of multiple simultaneous cases required
for IIA. For IIA, Jigsaw can be used to screen a
certain problem, while ConText supports the tasks of
evidence identification, collection, and management
for the screened problem.
On the other hand, bug tracking tools aim to
resolve bugs related to software or issues related
to products or services (Serrano and Ciordia, 2005;
Avnon and Boggan, 2010). The majority of such
tools (Serrano and Ciordia, 2005) aim to resolve
software bugs by assigning the problem tickets
to respective agents and track the status of their
resolution. In contrast, our goal is to support the
intermediate steps, i.e., the evidence identification
and collection to be able to initiate an action to be
taken towards the resolution of a problem. Similarly,
in cybersecurity, tools have been designed to help
operators quickly identify and address network
intrusions and incidents (Amershi et al., 2011). Like
cybersecurity, our goal of finding critical issues
remains, but the data, challenges, and workflows
of security and drug incident response domains
vary— requiring thorough design, development, and
evaluation of incident management and response tools
for Pharmacovigilance.
3 UNDERSTANDING THE IIA
WORKFLOW AT THE FDA
This work is part of our over two and a half years
collaboration with the FDA to design visual analytics
to improve their drug safety review process.
3.1 Methodology
For this project, we conducted a series of
semi-structured in-person interviews and follow-up
discussions with five (5) domain experts who
were drug safety analysts, to understand their
IIA workflow, tools, and challenges. In our
preliminary interviews, we observed the drug
safety analysts performing their routine review
tasks in a think-aloud manner. We recorded these
interviews and transcribed them to get concrete
design requirements for ConText.
After these preliminary interviews we had
biweekly remote meetings and email discussions with
three of these experts to get more feedback initially on
the requirements and validation of our understanding
of the review process, and eventually on the design of
ConText during the later stages of the project. Overall
the project took about eight months from requirement
analysis to development detailed in Section 6.
3.2 Background on Incident Reports
Based on our interviews we learned that the U.S.
Food and Drug Administration (FDA) regularly
receives medical incident reports about medication
errors and adverse reactions through their adverse
event reporting system know as FAERS (FDA,
2021). These reports are submitted by consumers,
health-care professionals and drug manufacturers.
Each report has structured information such as
demographics of the patients and therapy related
information and an unstructured narrative describing
the details of the adverse event suspected to be caused
by the drug.
3.3 Current IIA Practices at the FDA
Based on our extensive analysis and discussions with
the domain experts, we express our understanding of
IVAPP 2022 - 13th International Conference on Information Visualization Theory and Applications
40
Start
Incident
Reports
Database
(FAERS)
Weekly
Reports
Batch
Potential
Critical
Incident
Case
Triaged
Reports
Set
Request
New Set
Search For More Evidential Reports
Regulatory
Action
External data
sources to
confirm a
problem
Analyze
Searched
Reports
Reports
Triage
Report
Narrative
Analysis
Case Building
and
Management
E W F
Microsoft Excel Microsoft Word
(FBIS) FDA Business
Intelligence System
A
Microsoft Access
Tools Cur re nt ly Use d for
Accomplishing Tasks:
A
FE
W
FE
F
a b c d
Additional
Evaluation
E
W
Structured Data:
Reporters info,
Demographics,
Drugs, Reactions,
History, etc.
Case
repository
to manage
evidence
Unstructured Text:
… a 61 year old male
took Zometa 4mg for
3 weeks and felt
extremely dizzy …
Original
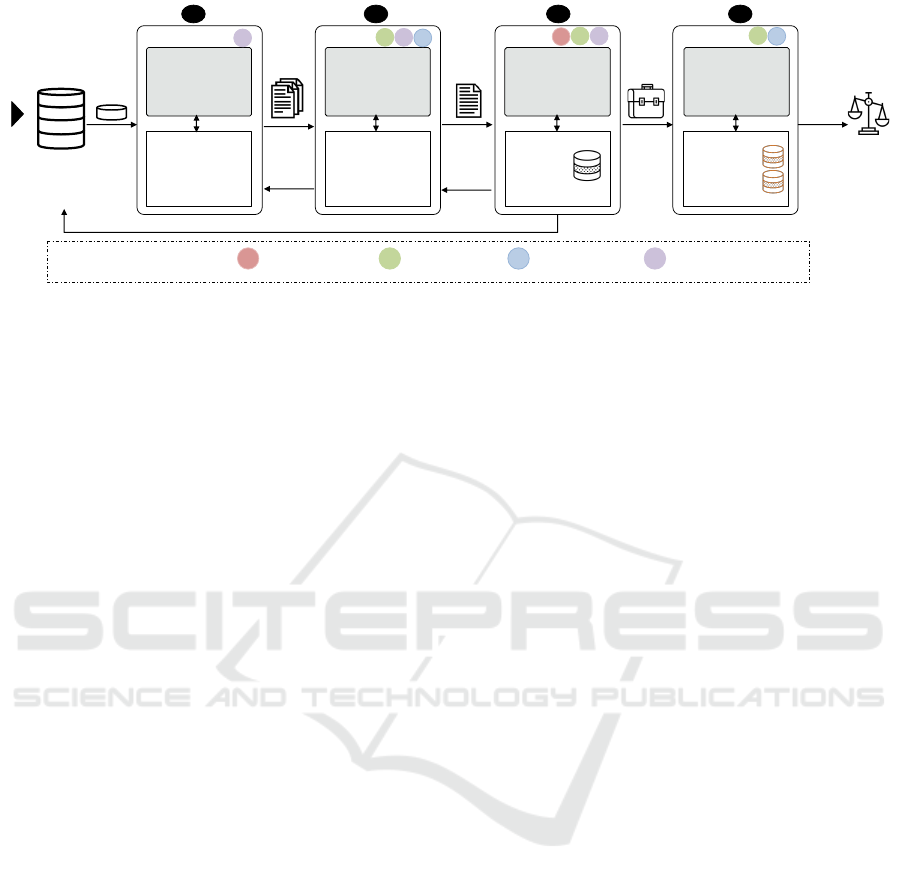
Figure 1: Instance-based Incident Analysis (IIA) workflow in the FDA with tools supporting each task. Tasks (a & d) are out
of the scope of this work.
the current IIA workflow at the FDA as depicted in
Fig. 1. Incident reports about suspected drug-safety
problems are investigated every week in a batch-wise
manner to find potential reactions and errors caused
by medical products. The goal of the analysts is
to find if any of these reports is discussing a real
potential problem and indeed is worthy of further
investigation and ultimately warranting regulatory
action.
Teams of drug safety analysts review these reports
based on the medical products assigned to them to
detect potential critical incidents. The analysts triage
reports related to a suspected drug-safety problem
based on structured information associated with each
report in the FAERS, such as severity of the incidents
(Fig. 1a). If the analysts find a report indicative of
a problem, they examine the text narratives of the
triaged report to analyze the details of the incident
and identify if the narrative has enough information
and can serve as evidence to the reported problem
(Fig. 1b).
Once an incident is identified as evidence to
a suspected problem, other reports that could
potentially further corroborate the incident, are
collected to build a case to be presented to the
management for further evaluation (Fig. 1c). Once
sufficient evidence is compiled that can confirm the
problem then regulatory actions are taken (Fig. 1d).
These actions include adding warnings to the drug
label or in worst case removing the product from the
market (H
¨
armark and Van Grootheest, 2008). In this
paper, we only focus on narrative analysis to identify
evidential reports and case building and management
to collect and monitor evidence (Fig. 1b & c).
Next we describe a real example of IIA revealing
its importance and the challenges involved.
3.4 Motivating Real World IIA Scenario
from FDA
In 2012, the FDA analysts were conducting their
routine review of reports to find drug safety problems.
During the analysis of one of the report’s narrative
(Fig. 1b), the analyst observed that a patient using
steroid injection was hospitalized due to a rare
adverse reaction “fungal meningitis”. This was an
unexpected and critical adverse event. The analyst
thus decided to open an investigation about this
incident and searched through the database to see if
other similar incidents had been reported (Fig. 1c).
After exhaustively searching and collecting other
evidential reports, they built a case and found
that these patients received steroid injections from
the New England Compounding Center (Fig. 1d).
The investigation was concluded with an order of
inspection of the facility. Later, it was revealed that
the product was contaminated due to the violation
of safety standards. Thus regulatory actions were
taken (FDA, 2018). This incident corresponds to
the well-known fungal meningitis outbreak scandal in
Massachusetts that killed 64 people and hospitalized
700 nationwide (FDA, 2018).
Clearly, the more effectively we can support the
tasks of such investigative process (Fig. 1b & c), the
faster we can solve potentially life threatening health
issues, such as the crisis described above.
3.5 Challenges in Current IIA Practices
Analysts currently perform IIA tasks manually
using a variety of tools to analyze the narratives
(Fig. 1b) and collect further evidence to build
a case (Fig. 1c) if the report is indicative of
investigation. For instance, analysts use FAERS
Business Intelligence System (FBIS) (BIFACT, 2019)
ConText: Supporting the Pursuit and Management of Evidence in Text-based Reporting Systems
41

to compose SQL-based search queries to retrieve
relevant reports from the FAERS database using the
structured information. Analysts use Microsoft (MS)
Excel and MS Access to keep track of their ongoing
investigations by manually recording reports evidence
to these investigations. Similarly, MS Word is used to
search through the narratives text when investigating
a particular incident.
These current practices utilise tools and
techniques that require a manual trawl through
the reports, which is time-consuming, laborious and
error prone. Moreover, in IIA, evidence is collected
over time as reports are reviewed every week,
manually keeping track of the open investigations
and adding evidence as they are received, solely
relies on the analysts’ memory. This becomes even
challenging for the investigations that are open for
a longer period of time, i.e., months even years.
While, analysts are the drivers of the IIA process –
their judgment and perspective is crucial to make
decision on a report’s importance and opening
an investigation – a unified tool is needed that
leverages computational and interactive features to
help them efficiently achieve their goals of evidence
identification, collection, and management.
4 IIA TASKS AND DESIGN
REQUIREMENTS
Below we describe the core tasks derived from our
interactions (Section. 3) with the domain experts.
T1 Identify Evidential Information within a
Report. Analysts review every report to make
sure not to miss any potential problem that
is critical to the organization. The goal is
to identify if any of the reports can serve as
evidence to the problem. Analysts seek specific
information within a report to assess if the report
has evidential information. This key information
includes the demographics of the patient, the
drugs taken by the patient and the observed
reactions. Other factors such as medical history
and symptoms etc. are also assessed.
T2 Collect Evidence and Build Case-series. Once
a suspected problem is escalated, substantial
evidence (reports) is needed to support that a
drug might be causing the reaction. When the
first report serving evidence to a problem, is
discovered, reports are searched over a longer
period of time to see if further evidence exists.
Analysts formulate queries and refine them
continuously to get all the relevant reports that
represent additional evidence.
T3 Track Multiple Case-series. Due to a
high number of potential suspected problems
(thousands of drugs and reactions), a large
number of case-series may be opened
simultaneously for ongoing investigations
of multiple problems, as investigations for
drug-safety problems generally take longer to be
concluded. In addition, due to recurrence, new
case-series are formed as new reports are received
and analyzed every week. Thus, keeping track
of all active case-series and collecting relevant
evidence for them while keeping an eye on the
new batch of reports to not miss an alarming
problem is extremely challenging.
As opposed to doing these tasks manually and
with no guidance, ConText combines them into
a single workflow and provides interactive views
and features to augment the analysis. To formally
justify the design components and features discussed
throughout the rest of this paper, we define a set of
guidelines that ConText should adhere to:
DG1 Highlight Evidential Information within
Report. The key information within a text
narrative that can be used as evidence to
confirm the suspected problem should be easily
identifiable.
DG2 Support Instance-based Evidence Search.
Analysts extensively formulate and refine queries
based on keywords from an identified evidential
report to find other similar reports that can serve
as evidence to the suspected problem. The system
should compose such queries automatically and
allow analysts to interactively curate them.
DG3 Facilitate Automatic Tracking of Multiple
Cases. The system should keep track of
the open cases (investigations) by automatically
identifying instances of reports evidence to these
cases as they are received every week and notify
the analysts to validate such findings.
ConText contains three visual components
to fulfill these requirements. For DG1, the
Incident Analysis View is designed to help
analysts identify evidential information within a
report. In consideration of DG2 and DG3, the
Case Management Dashboard is designed to help
in evidence collection to build and monitor cases,
respectively.
IVAPP 2022 - 13th International Conference on Information Visualization Theory and Applications
42

5 DESIGNING ConText FOR IIA
ConText is designed to achieve the IIA tasks to
identify, collect, and monitor evidence for ongoing
investigations in a unified manner. ConText has two
main components, the Incident Analysis View (Fig. 2)
and the Case Management Dashboard View (Fig. 4).
5.1 Incident Analysis View
The incident analysis view provides the line-listing
of the reports (Fig. 2-Left) along with the Content
analysis panel (Fig. 2-Right) for narrative analysis.
An analyst can select a report from the line-listing
and analyze its text narrative to interactively identify
evidential information using the features below.
Domain-informed Access Points. Analysts need
to identify the evidential information in the text
narratives that can help them assess if the report
indeed necessitates the opening of an investigation.
ConText aids analysts to locate the important
relevant information (access points) within the text
quickly via natural language processing (NLP).
These domain-informed access points include the
data elements requested by the analysts to be
extracted such as drugs, reactions and demographics.
Though various techniques to extract name entities
from biomedical text exist (Allahyari et al., 2017;
Wunnava et al., 2017), we leverage the MEFA
framework, that uses a combination of rule-based
and machine-learning-based name-entity recognition
techniques to extract the key information from the
FAERS reports narratives (Wunnava et al., 2017).
Fig. 2 depicts a text narrative with highlighted
access points extracted using NLP to guide the
analyst. We provide an option to interactively correct
or update any inaccurate extracted information using
the annotation menu (Fig. 2f). Further, these access
points can be toggled on or off based on the analyst’s
preference. Options to search within the narrative are
also provided (Fig. 2e).
User Driven Annotations. Besides the access points,
ConText also provides the analyst with the ability
to add free-form comments linked with an evidential
report or mark interesting keywords or phrases while
reading and analyzing a document. Such direct
annotations from the analyst are very useful. First,
analysts can remember their insights and findings
when the document is reviewed again at a later time.
Second, these annotations can be helpful in capturing
the information that is important to the analysts for
assessing an incident, and thus can be leveraged to
facilitate the next steps of investigation as discussed
below.
5.2 Case Management Dashboard
To provide an interactive approach to build and
monitor case-series, we have designed the incident
case management dashboard (Fig. 4) that provides the
following features.
Case Creation. At any time during the analysis if an
analyst considers a report important enough to open
an investigation, ConText allows her to interactively
create a case ((Fig. 2c) and add the report into the case
((Fig. 2d). The analyst can also select if a report is
primary (strong evidential information) or supportive
evidence (weak information) to the case (Fig. 2d).
Case Building. When a case is created, ConText
recommends other reports with similar evidential
information to assist the analyst in building a case.
For this we leverage the keywords marked within
the report, either using NLP or explicitly annotated
by the analyst as they convey important information
about the reports — therefore are conduits towards
constructing descriptors of a case. These case
descriptors are used to automatically recommend
reports that are most similar to the reports within a
a case. A similar approach is taken by Cheng et
al. (Cheng and Gotz, 2009) to recommend relevant
web pages based on user’s notes. More advanced
document recommendation techniques using word
embeddings (Berger et al., 2016) can also be plugged
into ConText.
An analyst can interactively update the
domain-informed “recommendation query” by
modifying the descriptors as well as operation
(Fig. 3). We leverage the well-known Okapi
BM25 (Robertson et al., 2009) information retrieval
model with the inverted index built upon incident
reports to implement such recommendation (using
Apache Lucene). The reports that match the query
descriptors are ranked based on the proportion of the
matched descriptors from the query represented as
glyph (Fig. 4b).
Case Summary. ConText provides an overview
of the reports collected within a case-series by
displaying a summary of the key information
including the phrases marked by the analyst during
the analysis of the narratives (Fig. 4d). For the
analysts annotations, we display each keyword as
a bar with its length mapped to the frequency of
the keyword. The count of reports associated with
a keyword is also displayed to help analysts in
composing their query.
An analyst can also view the distribution of the
reports marked as strong and supportive evidence,
along with the comments added to reports within a
case. This helps the analyst to quickly review the
ConText: Supporting the Pursuit and Management of Evidence in Text-based Reporting Systems
43
(10) (8) (2) (2)
(5)
a/b NLP On/Off Ab
a"
CLEAR
b"
d"
e"
f"
c"
ACTIVE CASES: 1
INACTIVE CASES: 0
Zoom In/Out
243 Reports
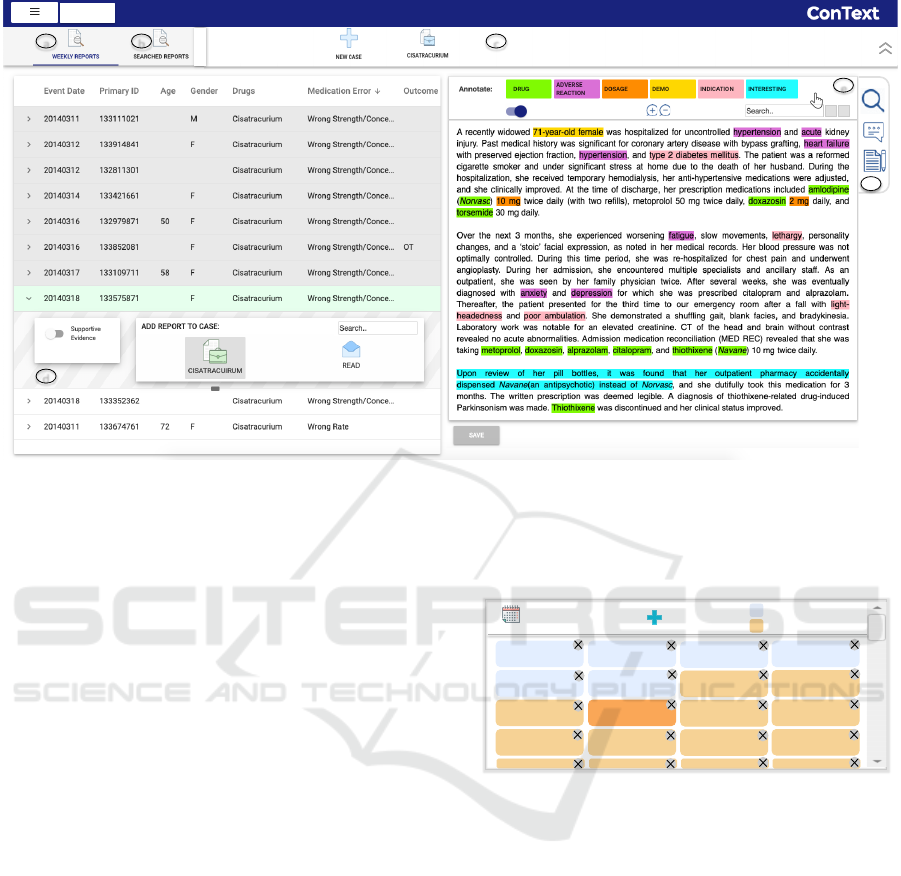
Figure 2: The Incident Analysis View allows analyst to identify evidential reports with line-listing of reports on the left and
Content Analysis Panel on the right. (a) Current weeks reports. (b) Panel to view searched reports. (c) The dashboard panel
with active cases. (d) To add a report to a case. (e) Menu to correct and control the annotations in the narrative. (f) Option
to search across the reports and creating notes on a report. Due to privacy concerns, a FAERS-like publicly available safety
report narrative (Da Silva and Krishnamurthy, 2016) is shown in the Content Panel.
important details of their case especially when a case
is open for a longer time.
Case Monitoring. An analyst might be working
with many active cases, with some new and others
older ones. Therefore, ConText provides an alerting
feature to notify analysts about the arrival of new
evidential reports that are relevant to any existing
active case-series. Every week new reports are
added to the existing unread reports, thus creating
a new batch. When new reports are received that
match an existing case-series in terms of the specified
recommendation query, then analysts are alerted on
their dashboard (Fig. 4e). By default the alert
operation uses the case descriptors from the case
summary to recommend the relevant reports. When
desired, the analyst can customize the alert criteria by
modifying the query (Fig. 3).
6 DEVELOPMENT PROCESS
AND INSIGHTS
As previously mentioned, ConText is part of our over
two years of collaboration with the FDA. In this
section, we discuss some of the main steps of the
design and development process during this period.
Our goal is to highlight some of the challenges we
faced during this time – this will be the basis for some
Cisatracurium*
Wrong*strength*
concentration*
diazepam*
Dispensing*
Domperidone*
Male*
confusion*
history*
label*
increased*
disease*
bleed*
serious*
anemia*
package*
******
Add keywords
Selected Date Range
03/17/2014 – 03/21/2014
NLP Keywords
User Annotations
Figure 3: The Recommendation Query Panel with both
NLP and user generated descriptors to allow analysts steer
investigations by finding relevant evidential reports.
of the lessons we present in Section 8.
Though our design study does not explicitly
follow the nine stages suggested by Sedlmair et
al. Sedlmair et al. (2012), we did naturally progress
through the main stages of the process. Due to our
ongoing collaboration, we had observed that evidence
collection and management were one of the core
and most frequently performed tasks. Thus our first
stage started with the core phase to discover and
characterize the problem Sedlmair et al. (2012), that
is, requirement analysis as discussed in Section 3.
During the design phase, we iteratively refined
our designed features, visualizations and interface
based on the feedback from the experts. As design
alternatives, we presented sketches of tag-clouds
with tf-idf and topic clusters using Latent Dirichlet
IVAPP 2022 - 13th International Conference on Information Visualization Theory and Applications
44

Allocation Blei et al. (2003) for report analysis. The
experts, however, found these approaches suitable
for someone unfamiliar with these reports to get
general insights. Analysts instead emphasized on
keeping the raw reports intact as they seek certain
information within these reports for decision making.
For the recommended documents our initial designs
included 2D representations (tiles) of the most similar
documents with score mapped to visual cues, but
analysts wanted to access the actual report along with
the score right away without additional mouse clicks
(Fig. 4b).
During the implement phase, after ConText
was developed and tested in lab for usability, we
conducted a pilot test with these three experts,
which highlighted a few usability issues as well as
suggestions on improving ConText features. For
instance, experts suggested to let analysts choose
which keywords they want to use for search in the
Recommendation Query, and allowing them to set a
customized alert for case monitoring as the criteria for
evidence might vary from incident to incident. Other
suggestions included using visual cues to differentiate
between NLP-based keywords and user annotations
for efficient query editing. After including these
features in the final version of ConText presented
in Section 5, we evaluated the system by conducing
case-studies and interviews with ten analysts that
were not involved in the design process and discuss
it in detail in Section 7. Finally, the insights we
gained during the design and development of ConText
in Section 8 corresponds to the write and reflect stages
of writing design studies Sedlmair et al. (2012).
7 EVALUATING ConText FOR IIA
IN PHARMACOVIGILANCE
To demonstrate the effectiveness of ConText for
IIA, we conducted case studies (Lam et al., 2011)
followed by semi-structured interviews with ten
domain experts (˜20% of the workforce). These
experts (9 females, 1 male, average age = 37.1 years)
were drug safety analysts at the FDA. They were not
involved in the design process of ConText and were
familiar with basic visualizations such as bar charts.
These evaluation sessions were each 1.25 hour
long. During the first 15 minutes, we demonstrated
the ConText prototype to these experts. After
getting familiar to ConText (˜10 minutes), we asked
these experts to explore the system to perform
IIA tasks by analyzing their reports set in a
think-aloud manner for about 30 minutes, while
the follow-up semi-structured interviews including
a survey and discussions took approximately 20
minutes. The FAERS data from 2014 was used during
the evaluation. We took notes and recorded their
feedback during these sessions and later transcribed
them for analysis.
7.1 Case Studies
To illustrate the workflow of ConText and how it
supports the Instance-based Incident Analysis (IIA)
tasks, we only present the following case studies
conducted with one of the analysts here due to
space limitation. However, other analysts were
able to derive similar findings. One of the analyst
volunteered for follow-ups regarding the evidence
alert feature of the system (illustrated below). The
names of the analysts in these case studies are
pseudo-anonymized.
Amy, a drug safety analyst responsible for
medication error detection starts exploration of the
reports using the Incident Analysis View (Fig. 2a).
She has received 243 reports for this week that she
needs to analyze one by one. From the line-listing,
she observes that the drug ‘Cisatracurium’ is reported
to have a serious outcome, thus she filters the reports
for this drug and opens the narrative of the first report
to read it (Fig. 2). The first thing she notices are the
highlighted drug names and medication errors. She
immediately reads the sentence that has the mention
of the drugs. It says “Pharmacist called stating
that they may be experiencing potency issues with
Cisatracurium and Padilaxel, but they are not sure..”.
Skimming through the rest of the narrative,
she comments “this narrative does not give much
information about the incident, so i will not read it
further”. She marks the report as ‘read’. It turns
grey in the reports panel (Fig. 2-Left) to allow quick
recognition of its ‘read’ state. She next opens the
second narrative. While reading through the narrative,
she finds the term ‘internal bleeding’ and highlights it
using the interesting marking on the annotation menu
(Fig. 2e). She marks the narrative as read, and adds
the comment “insufficient information”.
She repeats the same process for the next five
narratives and keeps highlighting the interesting
words in each narrative and adds comments where
needed. She states, “this is our routine, most of
the reports are false alarms and usually don’t get
investigated further”.
For the next report’s narrative, she reads the
sentence “several ICU nurses were having difficulty
in reading the commercially labeled concentration
of Cisatracurium vials” with ‘Cisatracurium’
highlighted. She says, “Cisatracurium is a muscle
ConText: Supporting the Pursuit and Management of Evidence in Text-based Reporting Systems
45
Caser&Reports&
ACTIVE CASES: 3
INACTIVE CASES: 0
3
2
2
3
3
2
1
1
1
1
1
1
1
1
1
1
1
1
1
1
1
1
1
1
1
1
2
1
1
1
3
2 1
RECOMMEND
ACTIVE
CISATRACURIUM
User Defined Keywords Summary
Comments: 2
Difficulty reading the commercially labeled concentration of Cisatracurium
vials, both font size and color contrast on the label.
Pharmacist having trouble differentiating between two strengths due to similar
looking carton labels
CASE REPORTS (3)
Last Updated: 03/02/2019
RECOMMENDED REPORTS (13)
1-12 of 13
Share
a&
e&
b&
c&
d&
133542671
139 Reports
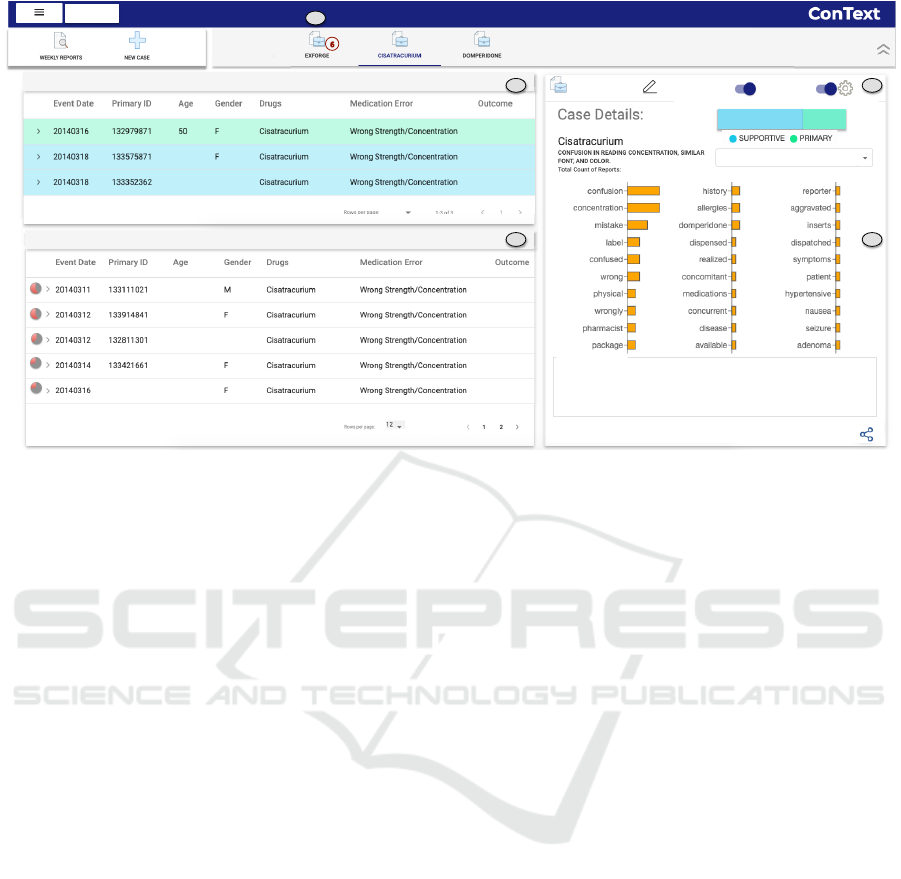
Figure 4: Dashboard view for the Case ‘Cisatracurium’. (a) Reports within the case. (b) Recommended reports for the case.
(c) Controls for recommendation query. (d) Case summary. (e) Alert of getting new evidential reports for the case Exforge.
paralyzing agent used on patients before surgery, if
the concentration is mistaken then it can have critical
health consequences”. She is now suspicious and is
reading the full narrative from start to end. As she
is reading, she highlights other phrases of interest
to her. She seems interested in this narrative and
explains, “this narrative can be describing a potential
medication error with the drug Cisatracurium having
similar labels for different concentrations” (T1). She
adds “Difficulty reading the commercially labeled
concentration of Cisatracurium vials, both font size
and color contrast on the label” as a summary of
the narrative by clicking on the comment button on
the Content Analysis view (Fig. 2f). She clicks on
the ‘Create New Case’ icon (Fig. 2c) and names it
‘Cisatracurium’ and add the description. By clicking
the case name, she includes the report in this case as
strong evidence (Fig. 2d). She can see the details of
this newly created case in the dashboard (Fig. 4).
She now investigates if there are other evidential
reports in the database with similar characteristics.
She clicks on the “recommendation setting” button
(Fig. 4c) and uses the default option of selecting all
keywords in the query (Fig. 3). In a few seconds,
she sees 13 reports in the recommended reports panel
(Fig. 4b) that match the search criteria which she
needs to investigate further one by one (T2).
She repeats the same process the next two weeks.
At that time, she has identified two new reports for
this case. She also has created two more cases
‘Domperidone’ and ‘Exforge’ through her findings
during these past two weeks. She again is curious
about the reports inside the ‘Cisatracurium’ case. By
clicking on her ‘Cisatracurium’ case under her list of
active cases (Fig. 4), she reads the description and
remembers that this case was about some confusion
in reading different concentrations of Cisatracurium.
She also sees on the summary panel, that one of
the three reports is a strong evidence while two are
supportive.
Now, she is curious about the most important
keywords in this case that she has been marking
during her analysis. Using the drop-down menu
(Fig. 4d), she selects “User-defined keywords”
and sees a distribution of the most frequently
words marked by her. She observes that the most
frequent terms in all these cases are “confusion” and
“concentration”. Reading through the comments, she
says “I remember, these reports were talking about
confusion in reading the concentration information”.
She now goes back to her routine report analysis.
Case Monitoring. One week later, when Amy
logs into ConText, she gets a notification of six
newly received reports on her ‘Exforge’ case in her
dashboard (Fig. 4e). She opens the case and sees the
list of recommended reports (T3). Upon skimming
their narratives one by one, she comments “Although
these reports discuss issues with Exforge, none of
these reports however have sufficient information, so
I will just mark them as read”. Amy then proceeds to
this week’s routine analysis. At any time during her
analysis, she can go back to investigate a particular
case.
In this way, ConText allows Amy to efficiently
IVAPP 2022 - 13th International Conference on Information Visualization Theory and Applications
46

perform her IIA tasks in identifying evidential
information within the reports, guiding her towards
further evidence to build and monitor multiple
investigations.
7.2 Expert Interviews
As part of the evaluation, after the aforementioned
case-studies, we conducted semi-structured
interviews with these 10 experts to get further
feedback on the strengths and weaknesses of the
system. We asked participants to rate the importance
of ConText’s main features on a 5 point likert-scale,
and discuss the reasons for their importance. Overall,
the feedback was encouraging. Fig. 5 depicts the
features that were considered the most important
for the workflow by the majority of our participants
(avg rating > 3.0). From Fig. 5 we see that
‘analysts annotations’ supported by current tools is
comparatively rated lower than the novel features that
are not supported.
Justifications for the lower ratings (3-score)
provided by the majority of participants included
concerns about the accuracy of the computational
techniques, that is, recommending the relevant
evidence and identifying key information within the
narratives using NLP. One participant mentioned
“The highlights in the text [pointing towards
NLP-generated access points] were not always
correct, an adverse reaction was highlighted as an
indication. It would be great if these mistakes are
not that often”. Four participants mentioned that if
the system consistently guides them towards the true
evidential reports, then they would trust these features
and ConText would be beneficial for their tasks. Other
minor features including ‘marking a report strong or
supportive evidence’ and ‘being able to search within
the narrative’ received an average rating of < 2.3.
Analysts evidently considered the main features of
the system to be important for their IIA workflow.
Regarding the highly rated features (Q2), some
of analysts comments are summarized next. P3:
“Sometimes these reports are very lengthy and
looking for a drug or error can be tedious. This
(domain-informed access points) can save us a lot
of time” (DG1). P6: “Currently, we have to check
our list of monitored drugs and match it with current
reports to see if we have got a new report, or rely on
our memory. Having an alert system that notifies us
about new possibly relevant reports can be helpful”
(DG3). P10: “Searching for reports that are similar
in content is very hectic currently, the recommend
functionality can make our lives easier” (DG2). In
short, analysts had positive feedback and were excited
0%#
10%#
20%#
30%#
40%#
50%#
60%#
Ratings:
ConText Features
Participants Percentage
Evidence
Recommendation
NLP Access
Points in Text
Analysts
Annotation
Evidence
Alerts
3 4 5
Figure 5: Participants feedback (ratings) on the importance
of features. Ratings are at 5-point likert scale (1=least
important, 5=most important.
about a ConText-like unified tool to assist them in
their IIA tasks.
Limitations in the current prototype were also
recorded. In particular, few participants suggested
more transparent visual query functions, such
as interactive ways of building logical and/or
queries. Others suggested to use visual cues to
distinguish their commented ‘read’ reports from the
uncommented ones to easily identify them.
8 DISCUSSION
ConText is designed to support the IIA workflow
to identify issues and collect and manage evidence
for Pharmacovigilance, a large domain world-wide
(Jeetu and Anusha, 2010) having analytics goals
and challenges (Bergvall et al., 2014) similar to the
FDA. Our evaluation illustrates that systems like
ConText can help fill the gap in the IIA workflow for
investigating potentially life-critical incident reports
which can also be adapted by other IIA domains such
as the FAA.
We learned many lessons during the design and
evaluation of ConText that we believe can be useful to
the visualization and HCI community. These lessons
come from our experience of developing a unified tool
for the IIA and some comments and suggestions we
received from the FDA experts. Below we discuss
these lessons that include both new insights we deem
useful for the design of future systems for IIA (L1,
L3, L5) as well as some established knowledge
we intend to corroborate with additional details and
further support for their value (L2, L4).
L1. Actual Text Reports Are the Backbone of
IIA. During the initial interviews, we observed that
analysts continuously emphasized the importance of
reading the actual text narratives to make a decision
if a reported incident is worthy of opening an
investigation. The importance of reading the actual
text document is highlighted previously in other
investigative domains as well (G
¨
org et al., 2014). Our
ConText: Supporting the Pursuit and Management of Evidence in Text-based Reporting Systems
47

initial designs included 2D document representations
for the recommended documents. Analysts wanted
to see the document first hand without having to
click through the 2D tile (abstraction). Existing work
to aid actual documents with visualizations, without
disrupting the raw text, is limited to typographic
features such as highlighting (Strobelt et al., 2015).
Other text analytics approaches provide summaries
and abstractions of text documents, such as clustering,
or topic analysis (J
¨
anicke et al., 2015). We propose
that adding a layer of such abstraction to these
text reports (Koch et al., 2014) would need careful
design and empirical evaluation to examine if the
abstraction improves or worsens the efficiency of
the IIA workflow, because analysts have to read the
narrative in any case.
L2. Goal-oriented Analysis Outweighs General
Insight Seeking. During the initial design phase
of the project, we discussed sketches of designs
consisting word clouds and topic analysis (Blei
et al., 2003) – common visual document analysis
approaches – to help analysts examine the incident
reports and get insights about these reports. The
insights from these techniques were general (unique
or similar keywords/topics) and were not helpful
in making a decision whether a certain report is
indicative of a potential problem. The analysts instead
emphasized on the importance of certain information
within these reports for decision making. This was
confirmed during evaluation as well when analysts
would first read the sentences with highlighted
NLP-generated access points, paying attention to
specific information such as drug and treatment.
While insight generation is one of the main metrics
for evaluating visual analytics (North, 2006), it’s
important that such insights are aligned with the
analysts goals, which we have witnessed during
the development of ConText. Therefore, for more
focused tasks such as IIA, analysis goals should be
prioritized over general insight seeking during design.
L3. Smooth Transition between Concurrent
Investigative Tasks Is Important. During
evaluation, we observed that analysts often switched
between analysing their weekly batch and collecting
evidence for a particular problem they found
interesting while reviewing a narrative. One analyst,
in particular, spotted a report indicative of an
adverse reaction from the reports recommended for
a potential medication error and started investigating
it by creating a new case. In short, analysts do
not review reports in a linear fashion, and ends up
going in multiple directions based on their findings,
which ConText supports. During evaluation, analysts
also mentioned that sometimes they lag behind
their weekly reports analysis due to an active and
time-intensive investigation of an ongoing safety
problem. Therefore, it is crucial for future designs
to keep track of the state of multiple analyses at all
times by providing occasional reminders about their
incomplete tasks, so that they can easily pick up
where they left off an analysis.
L4. Providing Support for Tracking Analysts’
Operations Leading to Insights. When analysts
were performing IIA tasks during our evaluation,
several analysts pointed out the need for the system
to remember their queries used during searching
for evidence. Particularly, upon the confirmation
of a report being evidence to a suspected problem,
the analysts want to use the same search query
possibly with minor modifications, for future searches
to collect evidence for a certain case. Given the
importance of analytics provenance (North et al.,
2011), future designs for IIA systems can incorporate
analysts’ interactions with the system similar to
(Endert et al., 2015), to allow analysts quickly access
their reasoning process that lead to the insights in the
first place.
L5. Communicating Uncertainty to Promote
Transparency Is Crucial. During our evaluation,
we observed that participants were hesitant to trust
the results of computational techniques such as NLP
or recommended evidence because they are used
to manually analyzing actual report text. Due to
ambiguity in the medical text, NLP techniques suffer
from lower accuracy (Jackson et al., 2017; Wunnava
et al., 2020) and hence leading to uncertainty in
the data (Mayr et al., 2019). Besides developing
more accurate algorithms, one way to to address this
is to design systems that visually communicate the
uncertainty in the underlying data to build users’
trust. For instance, similar to (Kay et al., 2016), a
word-scale visualization (Goffin et al., 2020) can be
used with each NLP-generated entity depicting the
confidence interval for the model accuracy. However,
this would need to be empirically investigated in the
context of IIA.
9 CONCLUSION
In this paper, we contribute a design study for
an analytics prototype ConText to support the
Instance-based Incident Analysis (IIA). Our design
of interactive operations and features is based
on an in-depth analysis of the Pharmacovigilance
workflows at the US FDA. ConText is designed
as a unified system to support the identification of
an incident of concern, finding evidence to build
IVAPP 2022 - 13th International Conference on Information Visualization Theory and Applications
48

and strengthen a case supporting the incident, and
interactively managing multiple ongoing cases over a
large weekly batch of semi-structured text reports. We
discuss our experience of designing and evaluating
ConText, and share the insights we gained during
this process to benefit future IIA tools and techniques
for this and similar real-world problems concerning
public safety.
ConText prototype, developed as a proof of
concept for designing visual analytics for IIA,
has impacted and inspired the next generation of
commercial tools being developed for IIA at the
FDA. In the future we plan to empirically study
the long-term usability of ConText in performing
IIA tasks. This would give us further insights
into the adoption of an interactive analytics tool
such as ConText in life-critical workflows. Other
research directions include designing and evaluating
interactive trustworthy visual displays for analyzing
textual data (Mayr et al., 2019).
REFERENCES
Allahyari, M., Pouriyeh, S., et al. (2017). A brief survey of
text mining: Classification, clustering and extraction
techniques. arXiv preprint arXiv:1707.02919.
Amershi, S., Lee, B., Kapoor, A., Mahajan, R., and
Christian, B. (2011). CueT: human-guided fast and
accurate network alarm triage. In Proceedings of the
SIGCHI Conference on Human Factors in Computing
Systems, pages 157–166.
Avnon, Y. and Boggan, S. L. (2010). Fit and finish
using a bug tracking system: challenges and
recommendations. In CHI’10 Extended Abstracts
on Human Factors in Computing Systems, pages
4717–4720. ACM.
Berger, M., McDonough, K., and Seversky, L. M. (2016).
cite2vec: Citation-driven document exploration
via word embeddings. IEEE Transactions
on Visualization and Computer Graphics,
23(1):691–700.
Bergvall, T., Nor
´
en, G. N., and Lindquist, M. (2014).
vigigrade: a tool to identify well-documented
individual case reports and highlight systematic data
quality issues. Drug Safety, 37(1):65–77.
BIFACT (2019). http://www.bifact.com/faers-bifact.html
[Accessed: 2019-06-19].
Blei, D. M., Ng, A. Y., and Jordan, M. I. (2003). Latent
dirichlet allocation. Journal of Machine Learning
Research, 3(Jan):993–1022.
B
¨
ohm, R., von Hehn, L., Herdegen, T., Klein, H.-J.,
Bruhn, O., Petri, H., and H
¨
ocker, J. (2016).
Openvigil fda–inspection of us american adverse drug
events pharmacovigilance data and novel clinical
applications. PloS one, 11(6):e0157753.
CFPB (2021). https://www.consumerfinance.gov/
[Accessed: 2021-12-01].
Chen, Y., Barlowe, S., and Yang, J. (2010). Click2annotate:
Automated insight externalization with rich
semantics. In IEEE Symposium on Visual Analytics
Science and Technology (VAST), pages 155–162.
IEEE.
Cheng, W.-H. and Gotz, D. (2009). Context-based page unit
recommendation for web-based sensemaking tasks.
In Proceedings of the 14th International Conference
on Intelligent User Interfaces (IUI), pages 107–116.
ACM.
Da Silva, B. A. and Krishnamurthy, M. (2016). The
alarming reality of medication error: a patient
case and review of pennsylvania and national data.
Journal of Community Hospital Internal Medicine
Perspectives, 6(4):31758.
Endert, A., Chang, R., North, C., and Zhou, M. (2015).
Semantic interaction: Coupling cognition and
computation through usable interactive analytics.
IEEE Computer Graphics and Applications,
35(4):94–99.
FDA (2018). https://www.fda.gov/ICECI/CriminalInvesti\
\gations/ucm594800.htm[Accessed: 2018-02-10].
FDA (2021). www.fda.gov/Drugs/GuidanceCompliance\
\RegulatoryInformation/Surveillance/AdverseDrug\
\Effects/ucm070434.htm [Accessed: 2021-02-10].
Goffin, P., Blascheck, T., Isenberg, P., and Willett, W.
(2020). Interaction techniques for visual exploration
using embedded word-scale visualizations. In
Proceedings of the 2020 CHI Conference on Human
Factors in Computing Systems, pages 1–13.
G
¨
org, C., Liu, Z., Kihm, J., Choo, J., Park, H., and
Stasko, J. (2013). Combining computational
analyses and interactive visualization for document
exploration and sensemaking in jigsaw. IEEE
Transactions on Visualization and Computer
Graphics, 19(10):1646–1663.
G
¨
org, C., Liu, Z., and Stasko, J. (2014). Reflections on
the evolution of the jigsaw visual analytics system.
Information Visualization, 13(4):336–345.
Gotz, D., Zhou, M. X., and Aggarwal, V. (2006).
Interactive visual synthesis of analytic knowledge. In
IEEE Symposium On Visual Analytics Science And
Technology, pages 51–58. IEEE.
H
¨
armark, L. and Van Grootheest, A. (2008).
Pharmacovigilance: methods, recent developments
and future perspectives. European Journal of Clinical
Pharmacology, 64(8):743–752.
Jackson, R. G., Patel, R., et al. (2017). Natural
language processing to extract symptoms of severe
mental illness from clinical text: the clinical record
interactive search comprehensive data extraction
project. BMJ open, 7(1).
J
¨
anicke, S., Franzini, G., Cheema, M. F., and Scheuermann,
G. (2015). On close and distant reading in digital
humanities: A survey and future challenges.
In Eurographics Conference on Visualization
(EuroVis)-STARs. The Eurographics Association.
ConText: Supporting the Pursuit and Management of Evidence in Text-based Reporting Systems
49

Jeetu, G. and Anusha, G. (2010). Pharmacovigilance:
a worldwide master key for drug safety monitoring.
Journal of Young Pharmacists, 2(3):315–320.
Jian-Xiang, W., Yun-Xia, Z., et al. (2015). ADRVis: an
information visualization platform for adverse drug
reactions. International Journal of u-and e-Service,
Science and Technology, 8(10):139–150.
Kakar, T., Qin, X., et al. (2019a). Mev: Visual analytics
for medication error detection. In International
Conference on Information Visualization Theory and
Applications (IVAPP). SciTePress.
Kakar, T., Qin, X., Rundensteiner, E., Harrison, L.,
Sahoo, S., and De, S. (2019b). Diva: Exploration
and validation of hypothesized drug-drug interactions.
In Computer Graphics Forum, volume 38, pages
95–106. Wiley Online Library.
Karimi, S., Wang, C., Metke-Jimenez, A., Gaire, R., and
Paris, C. (2015). Text and data mining techniques
in adverse drug reaction detection. ACM Computing
Surveys (CSUR), 47(4):56.
Kay, M., Kola, T., et al. (2016). When (ish) is my
bus? user-centered visualizations of uncertainty in
everyday, mobile predictive systems. In Proceedings
of the 2016 CHI Conference on Human Factors in
Computing Systems, pages 5092–5103.
Koch, S., John, M., W
¨
orner, M., M
¨
uller, A., and
Ertl, T. (2014). Varifocalreader—in-depth
visual analysis of large text documents. IEEE
Transactions on Visualization and Computer
Graphics, 20(12):1723–1732.
Lam, H., Bertini, E., Isenberg, P., Plaisant, C.,
and Carpendale, S. (2011). Empirical studies
in information visualization: Seven scenarios.
IEEE Transactions on Visualization and Computer
Graphics, 18(9).
Lazarou, J., Pomeranz, B. H., and Corey, P. N. (1998).
Incidence of adverse drug reactions in hospitalized
patients: a meta-analysis of prospective studies.
The Journal of American Medical Association,
279(15):1200–1205.
Liu, S., Wang, X., Collins, C., Dou, W., Ouyang, F.,
El-Assady, M., Jiang, L., and Keim, D. (2018).
Bridging text visualization and mining: A task-driven
survey. IEEE Transactions on Visualization and
Computer Graphics.
Liu, Z., G
¨
org, C., Kihm, J., Lee, H., Choo, J.,
Park, H., and Stasko, J. (2010). Data ingestion
and evidence marshalling in jigsaw vast 2010 mini
challenge 1 award: Good support for data ingest.
In IEEE Conference on Visual Analytics Science and
Technology (VAST), pages 271–272. IEEE.
Marais, K. B. and Robichaud, M. R. (2012). Analysis
of trends in aviation maintenance risk: An empirical
approach. Reliability Engineering & System Safety,
106:104–118.
Mayr, E., Hynek, N., Salisu, S., and Windhager, F.
(2019). Trust in information visualization. In EuroVis
Workshop on Trustworthy Visualization (TrustVis),
volume 20191187.
North, C. (2006). Toward measuring visualization insight.
IEEE Computer Graphics and Applications, 26(3).
North, C., Chang, R., Endert, A., Dou, W., May, R.,
Pike, B., and Fink, G. (2011). Analytic provenance:
process+ interaction+ insight. In CHI’11 Extended
Abstracts on Human Factors in Computing Systems,
pages 33–36.
Robertson, S., Zaragoza, H., et al. (2009). The
probabilistic relevance framework: Bm25 and
beyond. Foundations and Trends® in Information
Retrieval, 3(4).
SDR (2021). http://av-info.faa.gov/sdrx/ [Accessed:
2021-11-30].
Sedlmair, M., Meyer, M., and Munzner, T. (2012). Design
study methodology: Reflections from the trenches and
the stacks. IEEE Transactions on Visualization and
Computer Graphics, 18(12):2431–2440.
Serrano, N. and Ciordia, I. (2005). Bugzilla, itracker, and
other bug trackers. IEEE Software, 22(2):11–13.
Shneiderman, B., Plaisant, C., and Hesse, B. W. (2013).
Improving healthcare with interactive visualization.
Computer, 46(5):58–66.
Shrinivasan, Y. B., Gotzy, D., and Lu, J. (2009). Connecting
the dots in visual analysis. In IEEE Symposium
on Visual Analytics Science and Technology, pages
123–130. IEEE.
Stasko, J., G
¨
org, C., and Liu, Z. (2008). Sensemaking
across text documents: human-centered, visual
exploration with jigsaw. In Sensemaking Workshop@
CHI 2008.
Strobelt, H., Oelke, D., Kwon, B. C., Schreck,
T., and Pfister, H. (2015). Guidelines for
effective usage of text highlighting techniques.
IEEE Transactions on Visualization and Computer
Graphics, 22(1):489–498.
Sultanum, N., Singh, D., Brudno, M., and Chevalier, F.
(2018). Doccurate: A curation-based approach for
clinical text visualization. IEEE Transactions
on Visualization and Computer Graphics,
25(1):142–151.
Wright, W., Schroh, D., Proulx, P., Skaburskis, A.,
and Cort, B. (2006). The sandbox for analysis:
concepts and methods. In Proceedings of the SIGCHI
Conference on Human Factors in Computing Systems,
pages 801–810. ACM.
Wunnava, S., Qin, X., et al. (2017). Towards transforming
fda adverse event narratives into actionable structured
data for improved pharmacovigilance. In Proceedings
of the Symposium on Applied Computing, pages
777–782. ACM.
Wunnava, S., Qin, X., Kakar, T., Kong, X., and
Rundensteiner, E. (2020). A dual-attention network
for joint named entity recognition and sentence
classification of adverse drug events. In Proceedings
of the 2020 Conference on Empirical Methods in
Natural Language Processing: Findings, pages
3414–3423.
IVAPP 2022 - 13th International Conference on Information Visualization Theory and Applications
50
