
OTDR based Estimation of Optical Fiber Link Residual OFDM CFO
Adriana Lipovac
1
, Vlatko Lipovac
1
, Mirza Hamza
2
and Vedran Batos
1
1
Dept. of Electrical Engineering and Computing, Univ. of Dubrovnik, Dubrovnik, Croatia
2
Dept. of Telecommunications, Faculty of Electrical Engineering, Univ. of Sarajevo, Sarajevo, Bosnia and Herzegovina
Keywords: OTDR, BER, Dynamic Range, OFDM CFO.
Abstract: Optical time-domain reflectometer (OTDR) has long been and is still considered the main test tool for
characterizing fiber optic links, i.e. identify and localize refractive and reflective events such as breaks, splices
and connectors, and measure their insertion/return loss. Specifically, sufficient dynamic range and thus alike
signal-to-noise-ratio (SNR) enable clear far-end visibility even of long fiber links. Moreover, under such
conditions, the highest achievable optical bit-error-rate (BER) floor is to the large extent determined by major
reflective events such as the specific trace distortion caused by connectors and splices, each with significant
return loss. Realizing this has provided the opportunity window to extend the standard OTDR capabilities list
by the appropriate trace postprocessing to predict the BER floor. Accordingly, considering the SNR high, and
thereby the inter-symbol interference dominant error generating mechanism, we applied the time-dispersion
channel model that determines the BER floor by the rms delay spread of the (fiber) channel power-delay
profile. We verified the BER floor prediction in the exemplar practical test situation, by measuring the actual
BER on the same fiber link, and found the obtained values well matching the OTDR - based predicted ones.
Furthermore, when no dominant reflective events are identified on the OTDR trace, it implies very small time
dispersion allowing the OFDM symbol cyclic prefix to always prevent inter-symbol interference. This retains
the CFO to solely determine the residual BER floor and vice versa, enabling indirect estimation of CFO-
induced phase distortion by simple BER testing. With this regard, we abstracted CFO with the AWGN being
justified by the Central Limiting Theorem to enable efficient and quite accurate short-term BER (and so CFO
phase error) predictions.
1 INTRODUCTION
Optical time-domain reflectometer (OTDR) has long
been used as a test tool of choice during installation and
maintenance of fiber optic communication systems. It
has been useful for fault locating and troubleshooting -
basically identifying various refractive and reflexive
events such as e.g. breaks, as well as measuring
attenuation, splice and connector insertion/return
losses, and fiber length (Lipovac, 2020; Wenzer, 2018;
Hui, 2009; Hui, 2020), Figure 1.
In short, OTDR transmits a pulse of laser light
through the fiber, while detecting the reverse-
direction travelling incoming signal, commonly
referred to as Rayleigh backscatter that is being
reflected back by irregularities in the optical fiber
structure, with the reflections’ delays expressed as in
distance units, by appropriately scaling the time axis
multiplying it with the speed of light in the fiber (Lu,
2017; Alekseev, 2016; Hartog, 2008; Lu, 2016).
Figure 1: OTDR architecture.
Basically, an OTDR is made of a microprocessor,
pulse trigger and generator, laser diode, optical
coupler, detector, analog-to-digital converter and
display, Figure 1.
So, initiated by the microprocessor accordingly
commanding the trigger and generator, these make
the laser transmitting a series of pulses unaffectedly
passing through the optical directional coupler (ODC)
to the near end of the actual fiber. However, in the
Lipovac, A., Lipovac, V., Hamza, M. and Batos, V.
OTDR based Estimation of Optical Fiber Link Residual OFDM CFO.
DOI: 10.5220/0010762900003121
In Proceedings of the 10th International Conference on Photonics, Optics and Laser Technology (PHOTOPTICS 2022), pages 91-96
ISBN: 978-989-758-554-8; ISSN: 2184-4364
Copyright
c
2022 by SCITEPRESS – Science and Technology Publications, Lda. All rights reserved
91

reverse direction, the ODC re-routes the reflected
backscatter signal to not come back (and potentially
harm) the transmitting laser, but to the avalanche
photodiode (APD) or positive-intrinsic-negative
(PIN) diode detector. Then, following the detector,
the signal passes through the analog-to-digital
converter (ADC) to the microprocessor for analysis
and forming the OTDR trace on the display, where
the analysis includes signal averaging to increase
SNR.
Furthermore, in any phase of network lifetime
cycle – no matter be it development, production,
installation or maintenance of fiber transmission
systems, the end-to-end bit-level transmission
performance is most adequately described by the bit-
error-rate (BER), which is measured out-of-service,
using the pseudo-random binary sequence (PRBS)
generator and receiver. (Most often, single BER test
(BERT) unit comprises both the generator and the
receiver, which presumes a loop-back at the far end
of the fiber.)
Specifically, we focus here the residual
(irreducible) BER, also commonly referred to as BER
floor, which is achievable under high-SNR
conditions, when practically it is just time dispersion
that remains out of the bit error generating
mechanisms.
Moreover, considering Orthogonal Frequency-
Division Multiplexing (OFDM) signal transmission
over optical fiber link, the BER floor is generally also
determined by the two main OFDM shortcomings -
the carrier frequency offset (CFO) and (large) peak-
to-average power ratio (PAPR).
However, coming closer to our final test scenario
of OFDM transmission over homogeneous optical
fiber links, we consider no dominant discrete events
(neither reflective, nor refractive ones detected by
OTDR), as well as enough large optical receiver
dynamic range (DR) or used any PAPR reduction
method) to prevent the non-linear high-power
transmitting amplifier from generating errors.
Finally, we consider time dispersion small enough
to allow the OFDM symbol cyclic prefix (CP) prevent
any inter-symbol interference (Lipovac, 2021).
This all imply that, under such conditions
common in practice, the CFO remains the sole
determining factor of the residual BER, which
enables indirect estimation of CFO-induced phase
distortion by much simpler BER testing (Lipovac,
2021).
This motivates our investigation of how accurate
and reliable is to estimate the fiber BER floor and
OFDM CFO from the related OTDR trace?
So, in Section 2, after reviewing the relevant
OTDR basic concepts, we firstly present the BER
floor model as a function of the crucial time
dispersion parameter – rms delay spread of the
reflective events dominant optical channel PDP that
is considered determined by the OTDR trace.
Then, in case of uniform OTDR trace decay with
a number of smaller discrete refractive events –
attenuations, we modelled the residual BER and CFO
by applying the link abstraction principle.
In Section 3, we present and discuss the obtained
preliminary test results for the exemplar test situation,
providing the according analysis to qualify matching
between the OTDR - based and directly measured
BER floor and CFO values. Conclusions are
summarized in Section 4.
2 ANALYSIS
The backscatter signal returning to the OTDR
consists of both Rayleigh scattering and Fresnel
reflections, where the former enables calculating fiber
attenuation as a function of distance, which is
represented by the constantly falling part of an OTDR
trace. However, Fresnel reflection occurs when the
light pulse light hits an abrupt change in refraction
index, which causes a strong reflection back, and so
enables detection of physical events identifiable by
spikes in OTDR trace due to connectors, mechanical
splices, bulkheads, fiber breaks or opened connectors
(the higher the spike with respect to the backscatter
levels, the greater the reflectance), Figure 2.
Figure 2: Typical OTDR trace for a longer fiber with
various reflective and refractive events (5 dB/Div;
4 km/Div).
2.1 Basic OTDR Analytical OFDM
BER Floor Model
More precisely, when the OTDR transmits the light
pulse of power P
0
into the fiber, then the power P
T
(z)
of the pulse propagating downstream the fiber, is the
PHOTOPTICS 2022 - 10th International Conference on Photonics, Optics and Laser Technology
92
exponential function of distance z of the observation
point from the fiber near-end (OTDR):
P
T
(z) =P
0
⸱10
−α⸱z/10
(1)
where α=α
s
+α
a
is the sum of the scattering and
absorption losses expressed in dB/km.
The total scattered power at distance z is:
P
s
(z) = α'
s
⸱Δz⸱P
T
(z) (2)
where α'
s
= 0.23⸱α
s
and Δz denote the fiber loss and
the light pulse length, respectively.
The latter can be expressed as:
Δz = w⸱v
gr
= w⸱c/n
gr
≈ w⸱c/n (3)
where: w, v
gr
, n
gr
, and c denote the pulse duration, the
group velocity in the fiber, the group refractive index
(justifiably approximated by the ordinary index n),
and the speed of light in vacuum, respectively.
Determined by the fiber numerical aperture, i.e.
by limited efficiency of an optical fiber to confine the
incident light, only a certain part S<1 of the scattered
light travels back to the OTDR (and is being subjected
to equal loss as during forward propagation), and
reaches the arbitrary point that is z apart from the
OTDR, with the total backscattered power:
P
BS
(z) = S⸱α'
s
⸱Δz⸱P
0
⸱10
−2α⸱z/10
(4)
implying that the backscattering power reflected from
the end of the fiber (z = L) is:
P
BS
(L) = S⸱α'
s
⸱Δz⸱P
0
⸱10
−2α⸱L/10
(5)
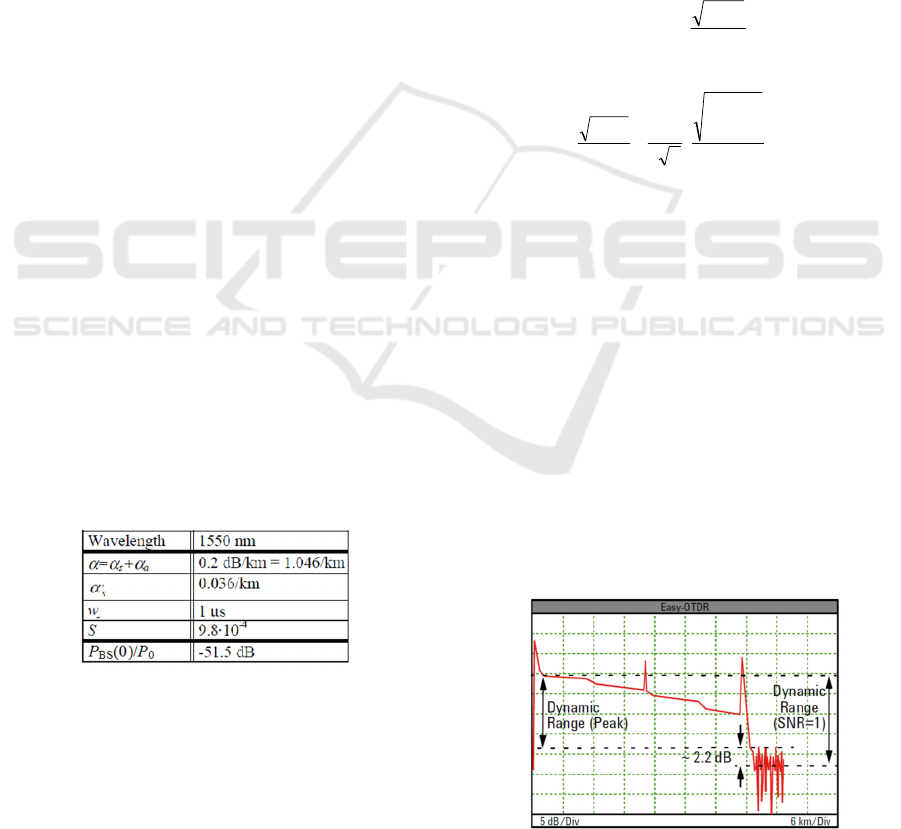
So, for example, in order to estimate the
backscattered power at 1550 and 1300 nm, we need
to adopt some typical parameters’ values in (5), such
as the ones in Table 1.
Table 1: Typical parameters’ values.
2.2
OFDM BER Floor Model for OTDR
Trace with Significant Reflective
Events
On the other hand, the orthogonal frequency-division
multiplexing (OFDM) has become widely spread in
optical communications as attractive modulation
format for long-haul transmission (Hui, 2020).
As it is challenging to uniquely relate the OTDR
trace events (primarily the reflective ones) to the
parameter(s) determining the OFDM BER error floor
under high-SNR conditions and therefore dominant
time dispersion, which implies that we can apply the
OFDM BER floor model (Lipovac, 2021),
specifically when sampling time is just upon the
arrival of the first impulse of the channel impulse
response.
So, we consider the power-delay profile (PDP)
as the sum of N impulses with powers
2
i
A
, and delays
i
τ
,
Ni ,...2,1=
(Lipovac, 2021).
Then, with no loss in (OFDM) generality, for
simple NRZ transmission, the BER floor for the trace
with significant reflections is:
[]
s
T
E
BER
2
28.0
τ
⋅≈
(6)
where:
[]
s
N
i
ii
s
T
A
T
E
=
⋅=
1
22
2
π2
1
τ
τ
(7)
is the standard rms delay spread (normalized to the
symbol time T
S
) of the channel PDP P
BS
(z), which we
consider to conform to the OTDR backscatter trace
(as describing time dispersion alike).
The BER floor condition of high SNR is fulfilled
with large enough OTDR dynamic range, which is
basically achieved with long enough transmitted
pulse.
However, on the contrary, an OTDR trace being
effectively an attenuated two-way squared response
of the fiber channel to the transmitted laser pulse, can
only be considered the PDP for short enough laser
pulse considered an impulse.
Thus, with this regard, the crucial OTDR attribute
is dynamic range, which is the difference between the
backscatter level at the front end and the noise floor
at the far end of the fiber, where the latter is mostly
considered as where SNR equals unity, Figure 3.
Figure 3: Dynamic range definitions with two definitions of
the noise floor.
OTDR based Estimation of Optical Fiber Link Residual OFDM CFO
93
Measured in decibels, DR is the difference
between the backscatter level at the front end of the
fiber and the noise floor at the far end of the fiber,
where most often the latter corresponds to the signal
level (i.e. where SNR=1).
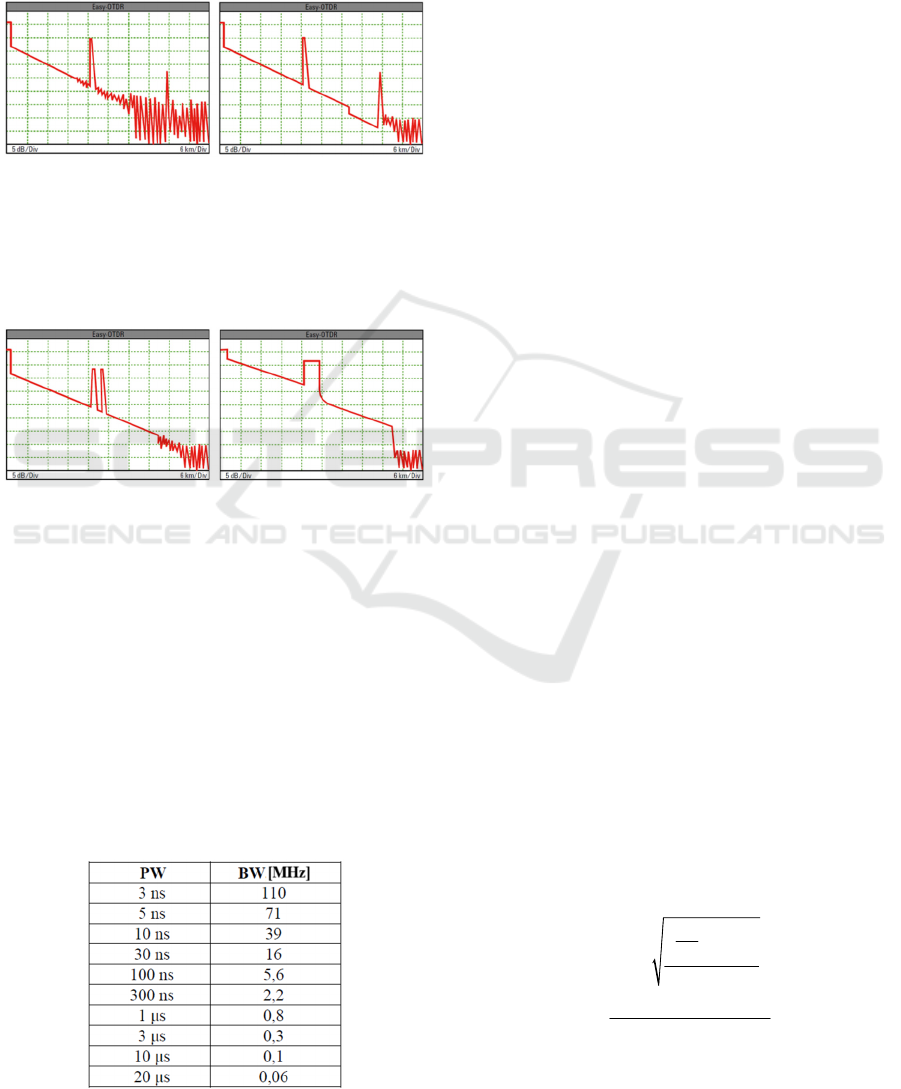
Thus, small dynamic range disables proper
OTDR measurements at the fiber end, Figure 4.
a
)
b)
Figure 4: OTDR trace; a) small dynamic range, b) large
dynamic range.
Longer pulses provide larger dynamic range, as
well as worse event resolution and longer attenuation
dead zone, Figure 5.
a
)
b)
Figure 5: OTDR trace; a) small dynamic range, b) large
dynamic range.
Furthermore, in addition to pulse width, receiver
bandwidth is another crucial performance criterion,
which determines the actual OTDR resolution
(Charlamov, 2013).
So, for each OTDR laser pulse width and desirable
attenuation dead zone, we can calculate the impulse
response and bandwidth of an optical receiver.
With this regard, in Table 2 some exemplar
OTDR receiver bandwidth (BW) values for given
pulse width (PW) values, are presented.
Table 2: OTDR pulse width and bandwidth.
Considering that:
P
BS
(z) = P
BS
(c/2·n⸱τ) = C
0
⸱10
−α·c·n⸱τ/10
;
C
0
= S⸱α'
s
⸱Δz⸱P
0
(9)
the response of the fiber-made link onto the OTDR-
transmitted pulse P
T
1/2
(z), is the convolution of the
latter with the fiber impulse response h(τ).
P
BS
1/2
(τ) = P
T
1/2
(τ)
*
h(τ) ; τ = (2z·n)/c (10)
So, to obtain h(τ), we need to de-convolve it from
P
T
1/2
(τ), which means to solve (9) per h(τ), leading to:
h(τ) = c/2n⸱E
i
⸱S⸱η
i
⸱exp(-2αz) (11)
where c, n, E
i
and η
i
stand for speed of light, laser
energy, average refractive index of the actual fiber,
and APD quantum efficiency, respectively.
However, pragmatically looking, large OTDR
dynamic range still makes its transmitted pulse (of
about 1 µs duration) short enough (with respect to the
reciprocal of the OTDR receiver bandwidth) – almost
as of an impulse described by delta-function:
P
T
(z) = δ(-2αz) (12)
so that (10) modifies to:
P
BS
1/2
(z) = δ(-2αz)
*
h(z) = h(z) ; z = c⸱ τ /2 (13)
Consequently, the normalized power – delay
profile of the fiber can be approximated by the
normalized (to unity area) relative OTDR trace as:
׀h(τ)׀
2
= P
BS
(z = c⸱ τ /2) (14)
Thereby, we can consider the OTDR trace to be
the first approximation of the average fiber PDP.
2.3 AWGN Abstraction of CFO from
Uniform-Decay OTDR Trace
Regardless of whether any kind of CFO
compensation used or not, the task here is to quantify
the residual CFO-caused phase error for given
conditions (Lipovac, 2016).
Furthermore, back to basics, the well-known BER
expression for the M-QAM signal transmission over
the additive white Gaussian noise (AWGN) channel,
as a function of the ratio of the energy E
b
of a bit to
noise spectral density N
0
, is (Lipovac, 2021):
2
0
2
3log
4
1
log
b
E
M
N
Q
M
BER
M
⋅
⋅
−
=
(15)
where Q denotes the Gaussian tail function.
PHOTOPTICS 2022 - 10th International Conference on Photonics, Optics and Laser Technology
94
Now, as it is already elaborated in Introduction,
the scenario of interest here is OFDM transmission
over homogeneous fiber link, where we consider no
dominant discrete events of any kind detected in the
OTDR trace, and qualified as either reflective or
refractive. This practically implies that we can then
justifiably consider CFO as the main error generating
mechanism, and thus determining BER.
Moreover, from the OTDR trace, we can read out
the SNR (i.e. E
b
/N
0
) value at the far end, and
substitute it into (12), considering that it abstracts the
actual BER with the AWGN one (as if a number of
mutually independent small distortions in summary
enable the application of Central Limit Theorem) of
the according mean and variance (Lipovac, 2021).
Then, having calculated this AWGN-modelled
BER due to CFO, we can calculate the maximal
squared CFO-caused phase deviation as (Lipovac,
2016):
()
()
2
CFO s
2
max
2
1
2
30
31
1
log
4
;1
10
k
k
fMT
Φ BER
s
M
BER M
Q
kM
−
Δ
Δ≈⋅ ⋅
⋅
−
⋅
⋅≤≤
(16)
where
CFO
fΔ
denotes the CFO.
3 TEST RESULTS
3.1 Test System
The HP 8147A optical time domain reflectometer was
used for preliminary BER floor prediction model. It
was designed long ago and aimed for lightwave
network operators during installation and field
maintenance of their networks.
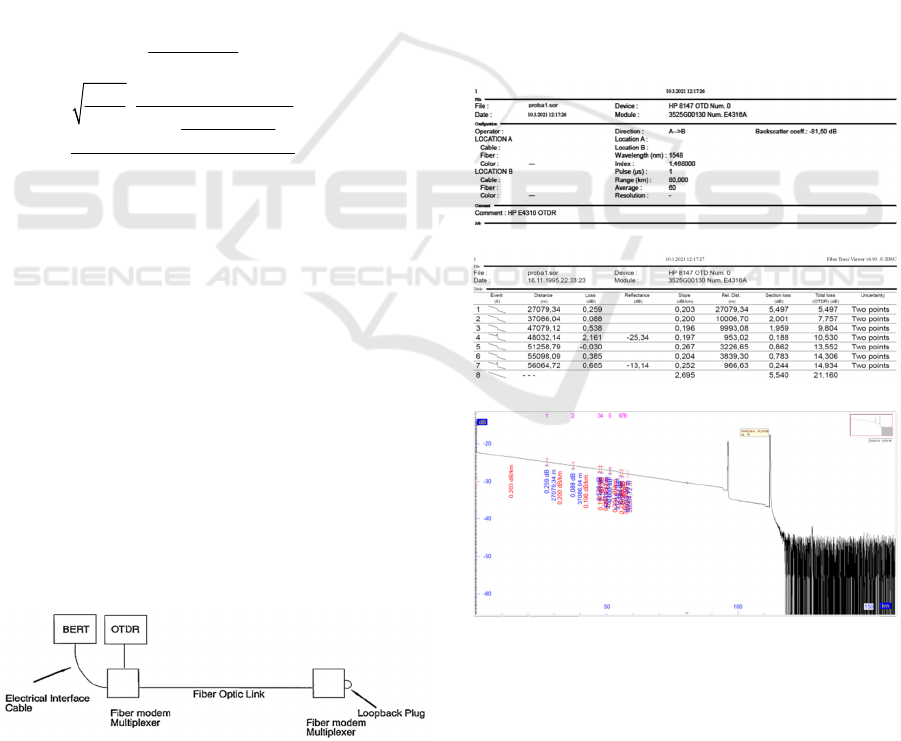
The OTDR with the plug-in optical interface
module supporting both 1310 nm and 1550 nm
windows, was connected in the test configuration
alternately with the BER tester (BERT) according to
Figure 6.
Figure 6: OTDR and two-way BERT configuration.
OTDR aided fiber testing is naturally out-of-
service, which is certainly not what network operators
favour with neither OTDR, nor BER testing (BERT).
That is why, to make our tests, we connected both the
OTDR and then the BERT to unused Gbit/s “dark”
fiber, and so not interrupt active fibers carrying live
traffic by neither OTDR nor BER tests.
The high-SNR condition that was earlier
considered by the proposed BER floor model as
equivalent to the requirement for large dynamic
range, which is mostly achieved by using long enough
transmitted pulses.
However, as on the contrary, longer pulses are
less credibly considerable as impulses, thus our
choice of about 1 µs long pulse seems to be a good
compromise for the fibers under test.
3.2 Preliminary Test Results
The exemplar OTDR setup, discovered and qualified
events, and screen shots of detailed test traces are
presented in Figures 7 a) – c):
a)
b)
c)
Figure 7: OTDR screen shots: a) setup; b) discovered and
qualified events; c) detailed trace printout.
As it is summarized in Table 3, good matching is
evident between the estimated and the actually
measured residual BER values, both in case of
considering the same test traces as having or not
OTDR based Estimation of Optical Fiber Link Residual OFDM CFO
95

having dominant reflective events. In the latter case,
abstracting the CFO by the AWGN model provided
the CFO phase error prediction.
Table 3: OTDR trace based estimate vs. measured BER
floor; 50 and 80 km fiber link, 1 Gbit/s.
Link length 50 km 80 km
BER_OTDR
SNR>>
4.13·10
-12
6.31·10
-12
BER_OTDR
CFO
4.24·10
-12
6.41·10
-12
BER_BERT 4.49·10
-12
6.89·10
-12
2
maxk
ΦΔ
[rad]
4.7·10
-8
6.1·10
-8
This validates the proposed model.
4 CONCLUSIONS
A simple prediction of fiber optic link residual BER
coming out directly from the OTDR trace, is proposed
to extend the standard OTDR functionalities beyond
bare identifying and characterizing various bit-error
generating events, and so enable troubleshooting of
fiber optic links, but also predict the residual BER, as
the ultimate end-to-end transmission performance.
This came out of the idea to consider the reflective
events in the OTDR trace as determining the time
dispersion standard describing parameter – mean
delay spread, so modelling the residual BER of the
fiber link.
The obtained preliminary test results that we
conducted on a dark fiber (to avoid the network
operator dissatisfaction with out-of-service testing),
validated the analytical model, showing good
matching between the OTDR-predicted and actually
measured residual BER, for short transmitted pulses
and large enough OTDR receiver (photodetector)
bandwidth, at least 40 % wider than the reciprocal
pulse width.
Furthermore, when no dominant reflective events
are identified on the OTDR trace, it implies very
small time dispersion allowing the OFDM symbol
cyclic prefix to always prevent inter-symbol
interference, retaining the CFO to solely determine
the residual BER floor. Thus, we abstracted CFO with
the AWGN to enable efficient and quite accurate
short-term BER (and so CFO phase error) predictions.
REFERENCES
Lipovac, A. Practical Enhancement of Fiber Installation
and Maintenance Test Tools - Example of Extending
OTDR Distance Range by Optical Preamplifier,
Proceedings of the European Lasers, Photonics and
Optics Technologies Summit, Paris, France, September
2020.
Winzer, P. J.; Neilson, D. T.; Chraplyvy, A. R. Fiber-optic
transmission and networking: the previous 20 and the
next 20 years. Optics Express 2018, 26, pp. 24190-
24239.
Hui, R. Passive optical components. Introduction to Fiber-
Optic Communications, 1st ed.; Academic Press: USA,
2020; pp. 209-297.
Hui, R.; O'Sullivan, M. Characterization of Optical
Devices. Fiber Optic Measurement Techniques, 1st ed.;
Academic Press: USA, 2009; pp. 259-363.
Lu, X.; Soto, M. A.; Thévenaz, L. Temperature-strain
discrimination in distributed optical fiber sensing using
phase-sensitive optical time-domain reflectometry.
Optics Express 2017, 25, pp. 16059-16071.
Alekseev, A. E.; et al. Fading reduction in a phase optical
time-domain reflectometer with multimode sensitive
fiber. Laser Physics 2016, 26, pp. 95-101.
Hartog, A. H. Frequency-scanned optical time domain
reflectometry. US Patent 7859654B2, 2008.
Lu, X.; Soto, M. A.; Thévenaz, L. Optimal detection
bandwidth for phase-sensitive optical time-domain
reflectometry, Proceedings of the Sixth European
Workshop on Optical Fibre Sensors EWOFS'2016,
Limerick, Ireland, 2016, pp. 374-377.
Lipovac, A.; Lipovac, V.; Modlic, B. PHY, MAC, and RLC
Layer Based Estimation of Optimal Cyclic Prefix
Length. Sensors 2021, 21, 4796.
https://doi.org/10.3390/s21144796
Lipovac, A., V. Lipovac and B. Modlic, Modeling OFDM
Irreducible BER with Impact of CP Length and CFO in
Multipath Channel with Small Delay Dispersion,
Wireless Communications and Mobile Computing, vol.
16(9), pp. 1065-1077, 2016.
Charlamov, J., R. Navickas, A. Baskys, V. Barzdenas, L.
Nickelson, Optical Receiver for Optical Time Domain
Reflectometer, Computer Engineering Department,
Vilnius Gediminas Technical University, Naugarduko
St. 41, LT–03227 Vilnius, Lithuania, 2013.
PHOTOPTICS 2022 - 10th International Conference on Photonics, Optics and Laser Technology
96
